



Table of contents

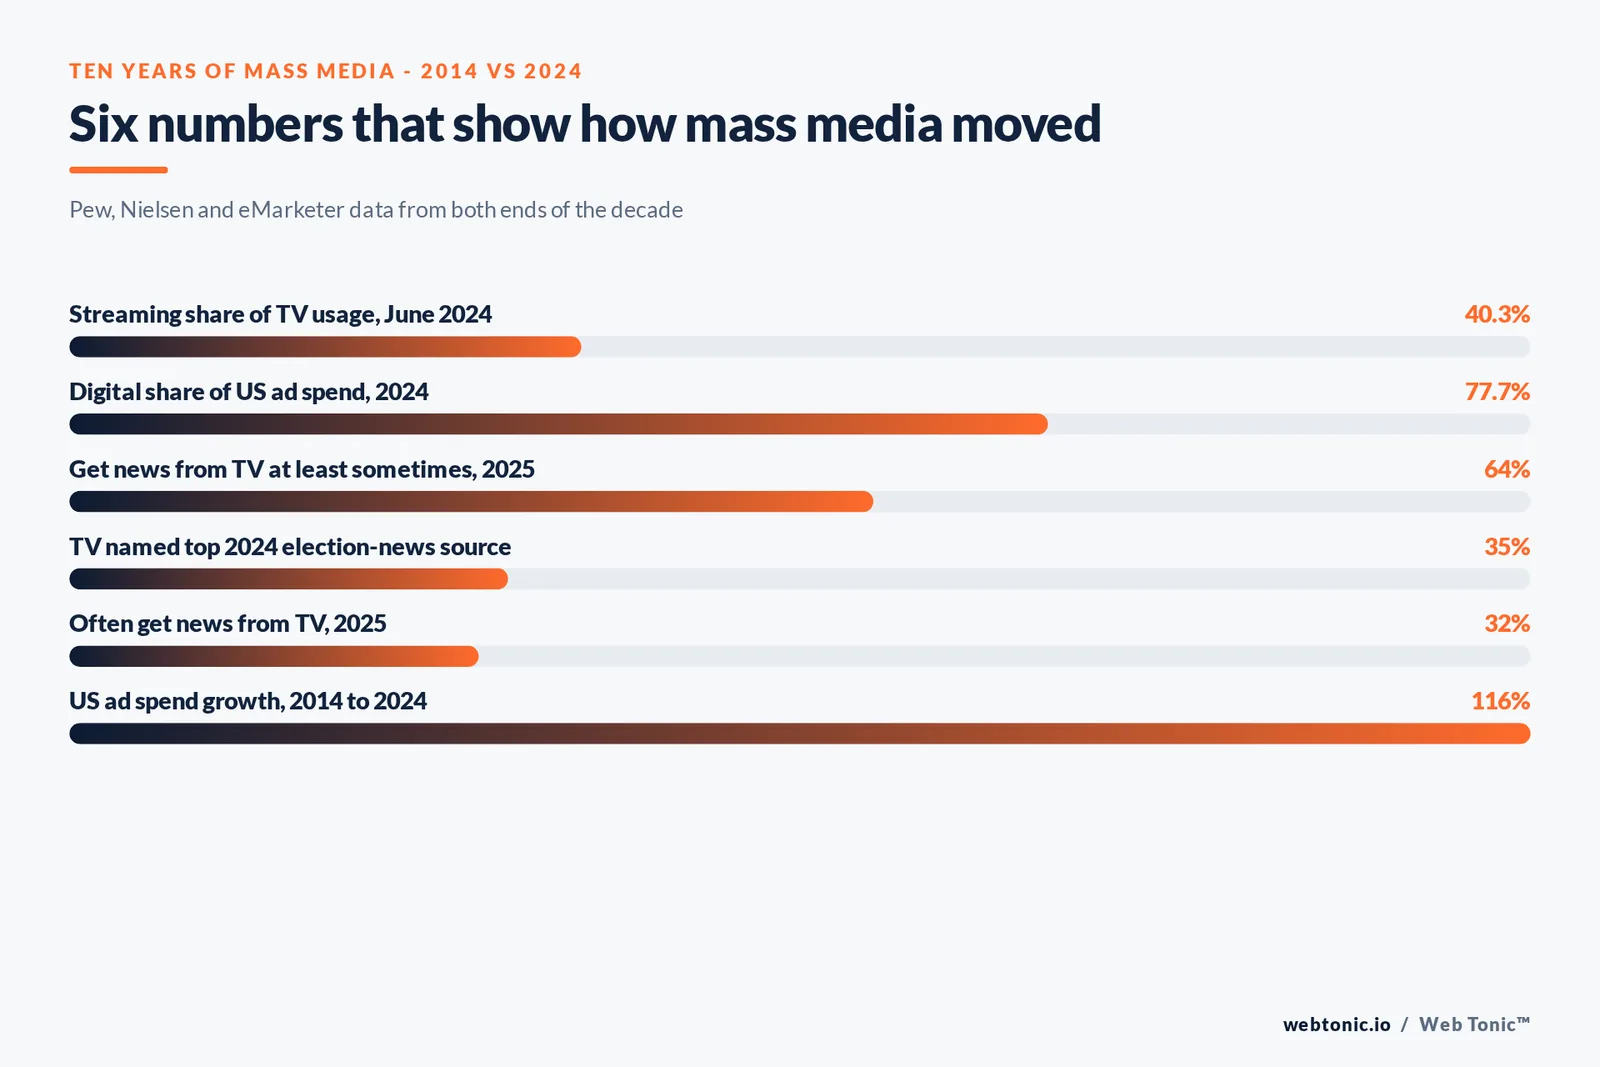
The average American watched 4 hours 32 minutes of live television a day in 2014; by 2024, streaming alone accounted for 40.3% of all TV-set usage, the highest share Nielsen has ever recorded for any single category. This page lines up Pew, Nielsen and eMarketer data from both ends of that decade to show exactly how mass media moved.
Key Takeaways
- Live TV viewing was 4 hours 32 minutes a day in Q3 2014.
- Streaming reached 40.3% of TV usage in June 2024, a record high.
- US audiences streamed nearly 14 trillion minutes of content in 2024.
- That is about 9.7 billion days of viewing in a single year.
- 64% of Americans still get news from TV at least sometimes, as of 2025.
- Only 32% get news from TV "often", down from the mid-2010s norm.
- 35% named TV their top source for 2024 election news.
- Total US ad spending was near USD 180 billion in 2014.
- Total US media ad spending reached USD 389.49 billion in 2024, more than double.
- Digital channels captured 77.7% of that 2024 spend.
- Smartphone ownership was 58% in early 2014.
- Smartphone ownership reached roughly 91% by the mid-2020s.
- Trust in news is at a ten-year low, per the Reuters Institute's 2026 report.
- Social and video networks now beat TV news as a first news touchpoint.
- 87% of Americans used TV as a news device in 2014, per AP-NORC.
- Smartphone daily use overtook TV time growth as early as Q3 2014.
Live television, 2014: still the default screen
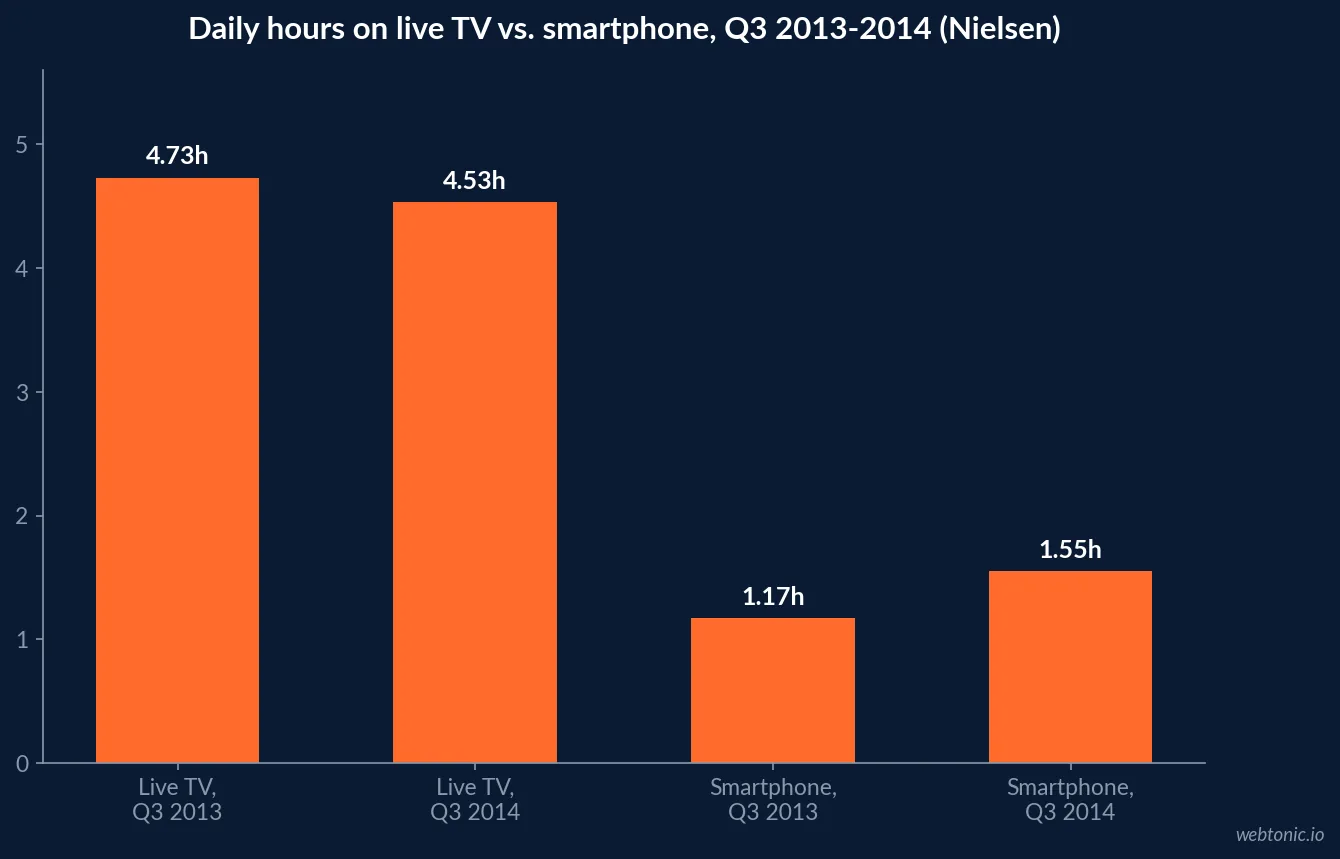
In the third quarter of 2014, Nielsen's cross-platform report measured the average US adult watching 4 hours 32 minutes of live television a day — already down 12 minutes from 4 hours 44 minutes the year before, but still the dominant screen in most households. The same report recorded smartphone use climbing from 1 hour 10 minutes to 1 hour 33 minutes a day over the same period, the earliest visible sign of the shift that would define the following decade.
| Screen-time metric, Q3 2014 vs. Q3 2013 | Q3 2013 | Q3 2014 | Source |
|---|---|---|---|
| Average daily live TV viewing | 4h 44m | 4h 32m | Nielsen |
| Average daily smartphone use | 1h 10m | 1h 33m | Nielsen |
| Change in live TV viewing | n/a | -12 minutes | Nielsen |
| Change in smartphone use | n/a | +23 minutes | Nielsen |
By 2024, streaming had become the largest single category
A decade later, the shift Nielsen first flagged in 2014 had gone further than most forecasts expected. Nielsen's The Gauge reported time spent streaming surging to 40.3% of total TV usage in June 2024 — topping the previous single-category record set by cable in June 2021 at 40.1%, and the highest share any category has ever posted in the measure's history. Across the full year, Nielsen's 2024 ARTEY Awards recap found US audiences streamed nearly 14 trillion minutes of content — roughly 9.7 billion days, or 26.5 million years' worth of viewing in a single year.
News consumption moved off the TV set, but not away from TV entirely
Pew Research's 2025 News Platform Fact Sheet found 64% of Americans still get news from television at least sometimes, including 32% who do so often — a share that has held fairly steady in recent years even as digital devices became the more common overall pathway to news. For the 2024 election specifically, Pew found 35% of adults named television their most common source for political and election news, ahead of news websites and apps at 21% and social media at 20% — still the single largest platform, but no longer a majority format.
| News-consumption metric | 2014 reference point | 2024-2025 figure | Source |
|---|---|---|---|
| Americans using TV as a news device | 87% (2014, AP-NORC) | 64% at least sometimes (2025) | AP-NORC / Pew |
| Adults naming TV top election-news source | n/a | 35% (2024 election) | Pew Research |
| Smartphone ownership | 58% (early 2014) | ~91% (mid-2020s) | Pew Research |
| Trust in news, decade trend | Higher baseline | Ten-year low | Reuters Institute 2026 |
Ad dollars roughly doubled, and digital took over the mix
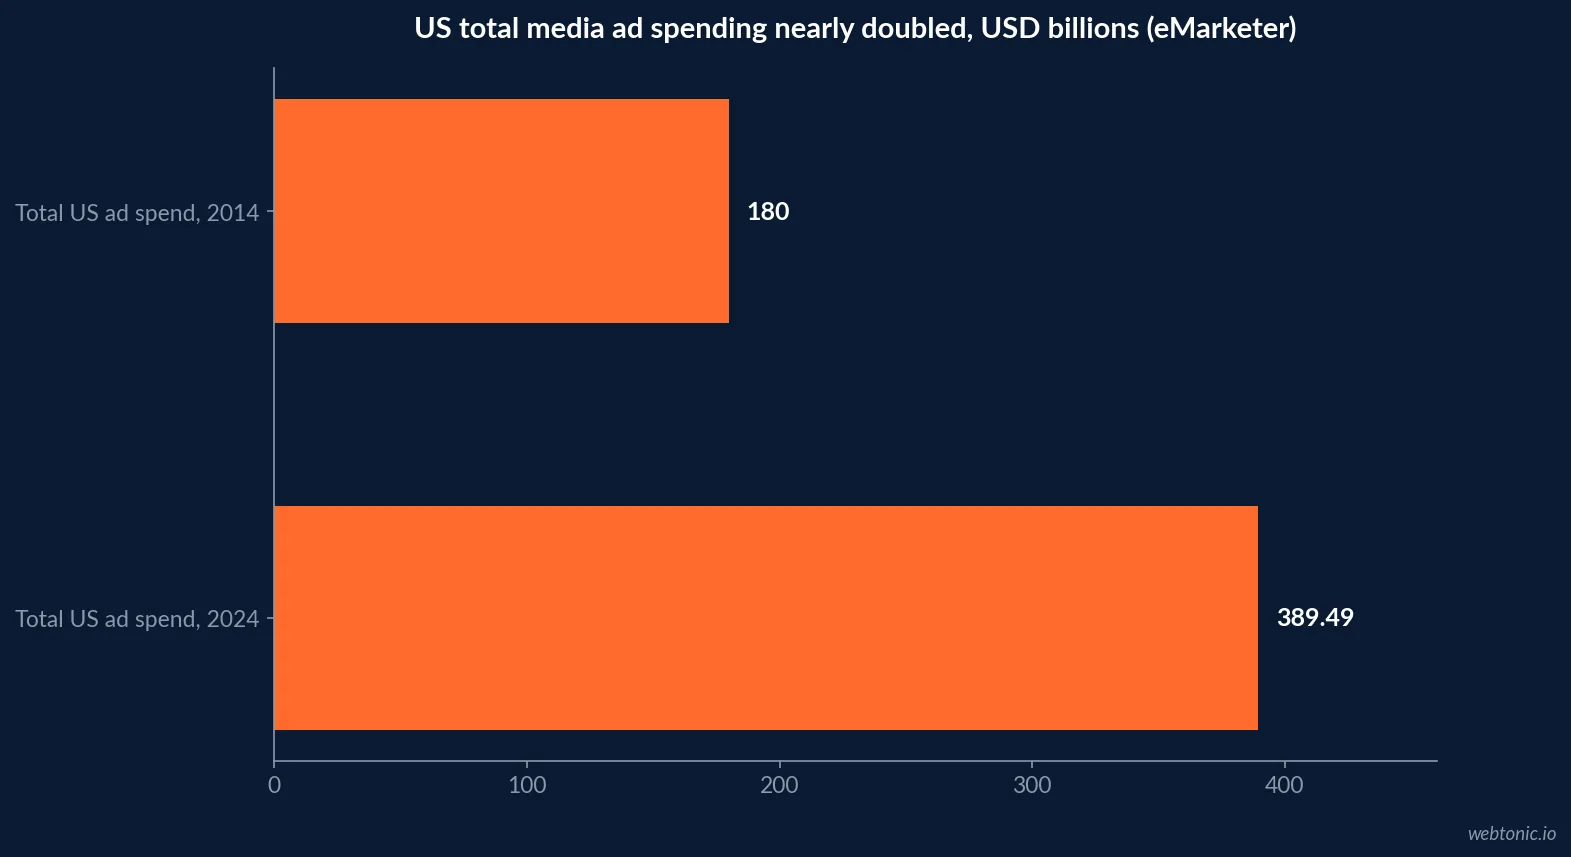
In 2014, eMarketer's estimate put total US advertising spending near USD 180 billion for the year, with the US already accounting for close to a third of global ad spend. By 2024, eMarketer put total US media ad spending at USD 389.49 billion, with 77.7% of that flowing to digital channels — mobile, desktop and connected TV. The market did not just grow; the channel mix inverted from majority-traditional to more than three-quarters digital inside a decade.
| US ad-spend metric | 2014 | 2024 | Source |
|---|---|---|---|
| Total US ad/media spending | ~USD 180 billion | USD 389.49 billion | eMarketer |
| US share of global ad spend | ~1/3 | n/a | eMarketer |
| Digital share of total spend | Minority | 77.7% | eMarketer |
Trust in the format has fallen as fast as viewing habits have shifted
The behavioral shift has a trust dimension attached to it. The Reuters Institute's Digital News Report 2026, surveying nearly 100,000 respondents across 48 markets, found trust in news at a ten-year low and reported that, for the first time, social media and video networks have moved ahead of both news organizations' own sites and apps and TV news as the leading way people first encounter information. Television and radio are losing audience less because people actively reject the format and more because fewer people are adopting it as a habit in the first place, a pattern the Institute's 2026 report documents directly.
Radio and print lost ground quietly, without a single dramatic year
The AP-NORC Personal News Cycle study, conducted in the mid-2010s, found 87% of Americans using television as a news device, ahead of computer at 69%, radio at 65% and print at 61%. By the mid-2020s, Pew's tracking shows digital devices as the single most common news pathway overall, with television holding on as the largest individual platform rather than the default across every format. Radio and print did not collapse in any one year; both lost small, compounding shares every year for a decade, which is why their decline shows up more clearly in a ten-year comparison than in any single annual report.
| News device used (mid-2010s baseline) | Share of Americans | Source |
|---|---|---|
| Television | 87% | AP-NORC Personal News Cycle |
| Computer | 69% | AP-NORC Personal News Cycle |
| Radio | 65% | AP-NORC Personal News Cycle |
| 61% | AP-NORC Personal News Cycle | |
| Cellphone | 56% | AP-NORC Personal News Cycle |
What stayed constant across the decade
Television did not vanish from the media diet — 64% of Americans still touch it for news, and live sports and event programming continue to draw some of the largest single-night audiences any format can produce. What changed is default behavior: in 2014, TV was the assumed screen and everything else was measured against it; by 2024, streaming, smartphones and social platforms had become the default, and linear TV had become one input among several rather than the anchor.
Smartphones did the heavy lifting behind the shift
Pew's tracking shows smartphone ownership at 58% of US adults in early 2014, up from just 35% when Pew first measured it in 2011. That single device is the mechanical cause behind most of the other numbers on this page: it is what let streaming replace scheduled viewing, what let social platforms overtake news homepages, and what turned "check the news" into a dozen short glances a day instead of one appointment with a nightly broadcast.
What this means for a 2026 media plan
A media mix built on 2014 assumptions — TV as the reach vehicle, digital as the supplement — no longer matches where attention or ad dollars sit. Planning against 2024-era data means treating streaming and connected TV as the default video buy, budgeting for a fragmented, largely zero-click news environment, and accepting that any single-channel trust story will keep eroding rather than recovering on its own.
Our growth marketing team builds media mixes against current consumption data rather than a decade-old default, and our Facebook Ads cost breakdown is a useful comparison point for the social side of that reallocation.
Where to look next if this trend continues
The direction of travel across every metric here — less linear TV, more streaming, less trust in any single format, more spend chasing digital — points toward an even more fragmented attention landscape by the end of this decade, not a reversal. Reviewing a media plan against fresh consumption data at least once a year, rather than carrying a channel mix forward by habit, is the practical takeaway.
Talk to us if a media-mix review against current data is the next step, or see our agency background for how we approach that kind of reallocation.
Frequently Asked Questions
How much has TV viewing declined since 2014?
Nielsen's Q3 2014 cross-platform report measured the average US adult watching 4 hours 32 minutes of live television a day, already down 12 minutes from the prior year. By June 2024, Nielsen's The Gauge reported streaming had overtaken every other category at 40.3% of total TV set usage, the highest share any single category had ever recorded. Live linear viewing did not disappear, but it stopped being the default the way it was in 2014.
Do Americans still get news from television?
Most still do, but less as their primary source than a decade ago. Pew Research's 2025 News Platform Fact Sheet found 64% of Americans get news from television at least sometimes, with 32% saying they do so often. For the 2024 election specifically, Pew found 35% named TV their single most common source of political news, still the largest individual platform but no longer the majority format it was through the mid-2010s.
How much has digital advertising grown since 2014?
Total US ad spending was estimated near USD 180 billion in 2014, with digital still a minority of that. By 2024, eMarketer put total US media ad spending at USD 389.49 billion, with digital channels — mobile, desktop and connected TV — capturing 77.7% of it. The market roughly doubled in ten years, and the channel mix inside it flipped from TV-led to digital-led.
Is trust in mass media higher or lower than it was ten years ago?
Lower, and still falling. The Reuters Institute's Digital News Report 2026 found trust in news at a ten-year low, with social media and video networks now ahead of both news organizations' own sites and TV news as a first point of contact with information, for the first time the survey has recorded that shift.
How much time do people spend streaming video now compared to 2014?
The scale is not comparable. Nielsen's 2024 ARTEY Awards recap found US audiences streamed nearly 14 trillion minutes of content in 2024 alone — about 9.7 billion days, or 26.5 million years' worth of viewing. In 2014, Nielsen was still measuring total TV consumption in hours per month per person, because subscription streaming had not yet become a primary viewing mode for most households.
Sources
Nielsen - Q3 2014 cross-platform viewing report
Nielsen - The Gauge, June 2024 streaming record
Nielsen - 2024 ARTEY Awards streaming recap
Pew Research Center - News Platform Fact Sheet, 2025
Pew Research Center - Where Americans turn for election news, 2024
Pew Research Center - US smartphone use, 2014-2015
eMarketer - US ad spending, 2024
Advanced Television - eMarketer 2014 US ad spend estimate
Reuters Institute for the Study of Journalism - Digital News Report 2026
AP-NORC - The Personal News Cycle study


