Table of contents
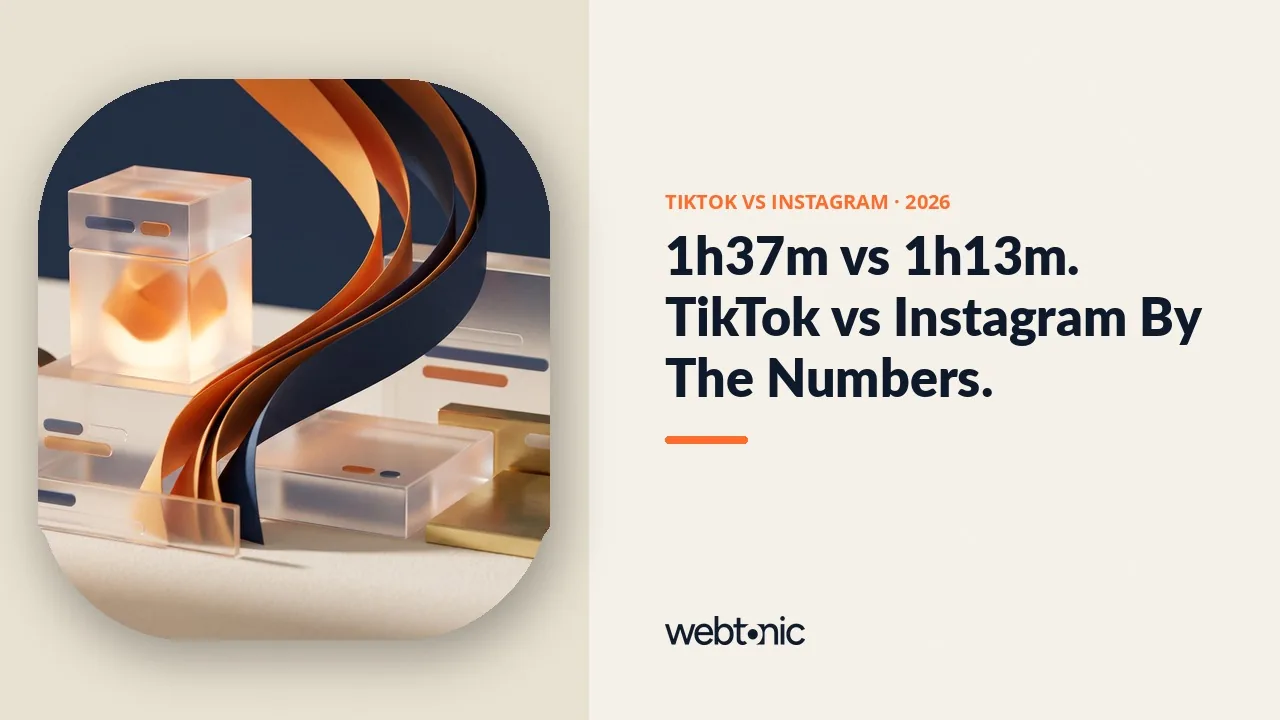
TikTok users spend 1 hour and 37 minutes a day on the app; Instagram users spend 1 hour and 13 minutes. That single gap in time spent shapes almost every other number in this comparison - engagement rate, ad cost and where commerce budgets are moving in 2026. This page sets the two platforms' own reported numbers side by side rather than arguing for one over the other, because the data points to different jobs for each.
Key Takeaways
- TikTok users average 1 hour 37 minutes a day on the Android app.
- Instagram users average 1 hour 13 minutes a day on the Android app.
- Instagram has passed 3 billion monthly active users worldwide.
- Instagram reaches 55.1% of online adults in the past month, per GWI.
- TikTok reaches 36% of online adults in the same GWI survey, ex-China.
- TikTok's median engagement rate is 2.01% in Quid's 2026 benchmark.
- Instagram's median engagement rate is 0.30% in the same Quid report.
- Sprinklr's 2026 Index puts TikTok engagement at 4.9%.
- The same report puts Instagram engagement at 0.98%.
- TikTok CPC runs USD 0.30 to USD 1.50.
- Instagram CPC runs USD 0.40 to USD 2.
- TikTok CPV can fall as low as USD 0.01.
- Instagram CPE runs USD 0.03 to USD 0.08.
- TikTok Shop hit USD 50.3 billion in global GMV in H1 2026 alone.
- Instagram's engagement fell 17% year over year to a 0.30% median.
- Global social media users passed 5.66 billion, or 68.7% of the population.
Time spent: the gap that drives everything else
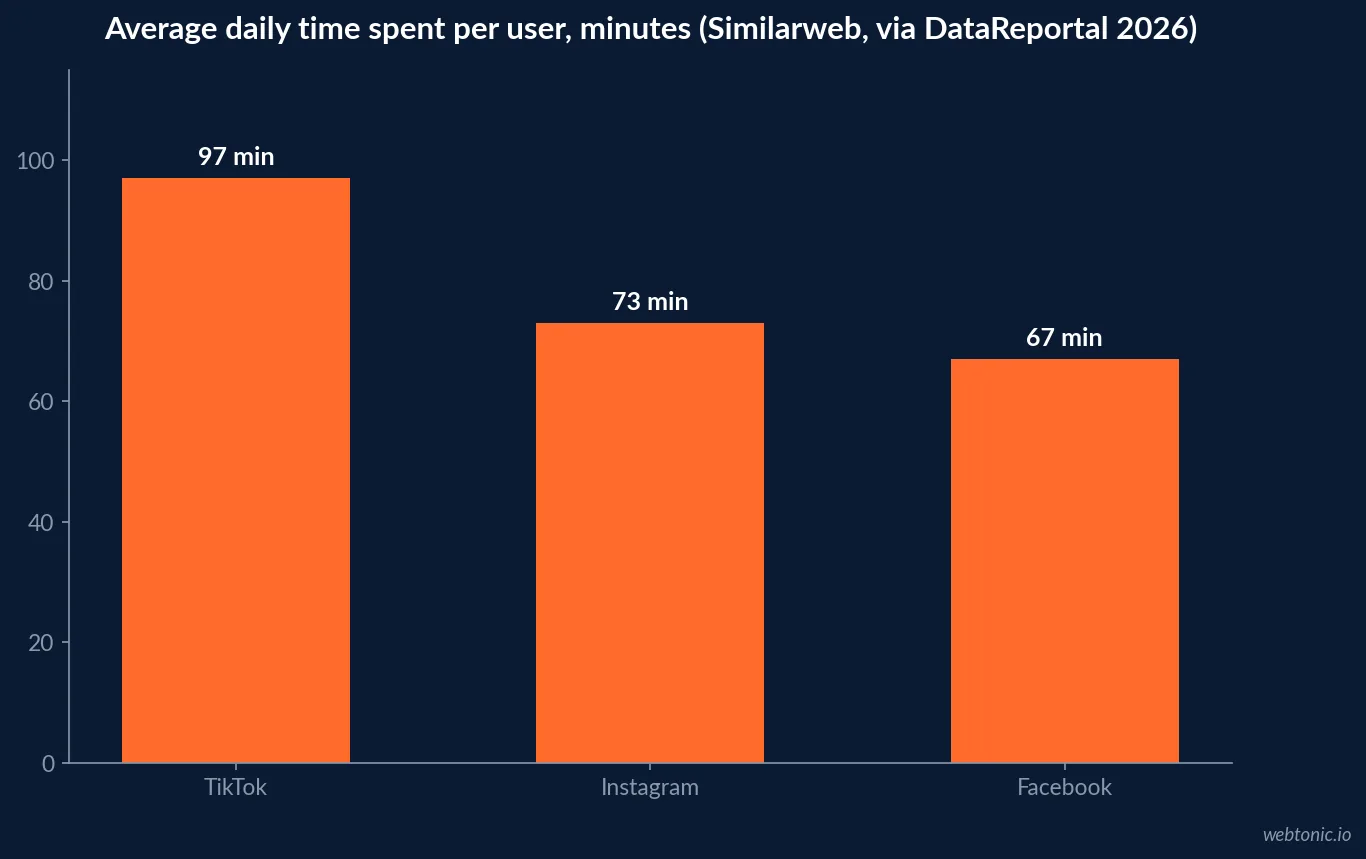
Similarweb's app-intelligence data, published inside DataReportal's Digital 2026 Global Overview Report, shows the typical TikTok user spending 1 hour and 37 minutes a day on the platform's Android app - roughly 14% longer than the typical YouTube user and well ahead of Instagram's 1 hour and 13 minutes. Facebook trails further back at 67 minutes.
Time spent is the input every other metric in this comparison sits on top of: more minutes per user means more inventory for ads, more chances for a post to be seen, and a higher ceiling on engagement rate.
| Platform | Avg. time spent per day (Android app) | Source |
|---|---|---|
| TikTok | 1 hr 37 min | Similarweb, via DataReportal Digital 2026 |
| 1 hr 13 min | Similarweb, via DataReportal Digital 2026 | |
| 67 min | Similarweb, via DataReportal Digital 2026 | |
| 59 min | Similarweb, via DataReportal Digital 2026 |
Audience size: Instagram is still the bigger platform
Reach still favours Instagram. Meta CEO Mark Zuckerberg said in September 2025 that Instagram had grown to 3 billion monthly active users. GWI's survey data, reported inside DataReportal's Digital 2026 report, ranks Instagram third among all platforms by past-month usage at 55.1% of online adults, ahead of WhatsApp (54%) and Messenger (38.4%). TikTok ranks sixth in the same survey at 36%, once China's Douyin figure is excluded.
A bigger audience does not mean a more engaged one - that gap is exactly where TikTok's numbers pull ahead in the next section.
| Reach metric (2025-2026) | TikTok | Source | |
|---|---|---|---|
| Monthly active users, global | 3 billion+ | Not officially disclosed | Meta / Reuters |
| Past-month usage, online adults | 55.1% | 36% (ex-China) | GWI, via DataReportal |
| Platform rank by past-month usage | 3rd | 6th | GWI, via DataReportal |
Engagement rate: TikTok wins on every measure
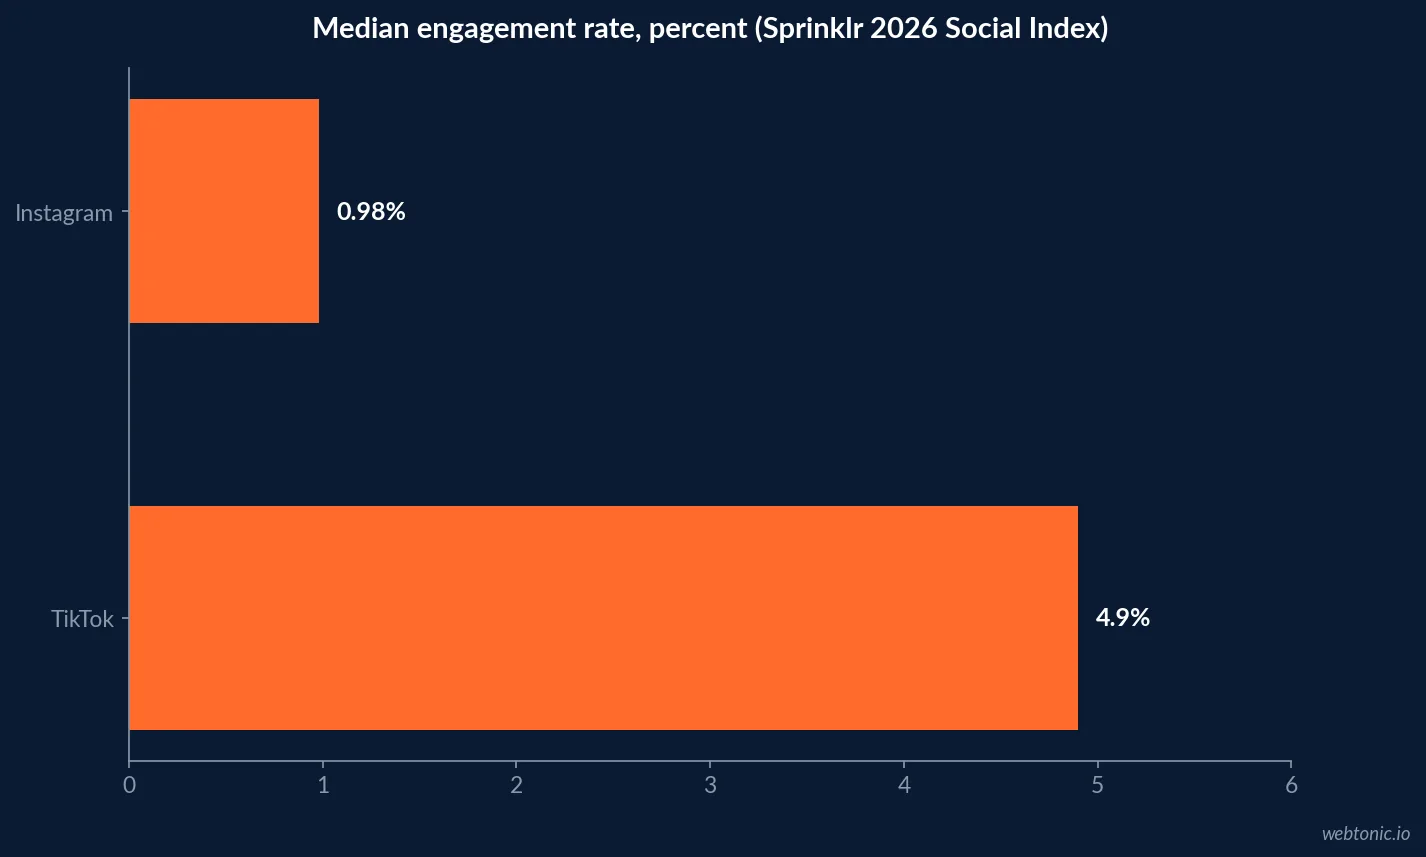
Two independent 2026 studies agree on direction even where they disagree on scale. Quid's 2026 Social Media Industry Benchmark Report puts TikTok's all-industry median engagement rate at 2.01% against 0.30% for Instagram, which fell 17% year over year from 0.36%. Sprinklr's 2026 Social Index, described on Sprinklr's engagement benchmark page, puts TikTok at 4.9% against Instagram's 0.98%.
Either dataset puts TikTok's engagement rate five to seven times Instagram's - a gap wide enough that it holds regardless of which methodology a team standardizes on.
| Engagement rate benchmark | TikTok | Source | |
|---|---|---|---|
| All-industry median (Quid 2026) | 2.01% | 0.30% | Quid / Rival IQ |
| All-platform median (Sprinklr 2026) | 4.9% | 0.98% | Sprinklr Social Index |
| YoY direction | Stable to rising | Down 17% | Quid / Rival IQ |
Ad cost: TikTok is the cheaper click, Instagram the cheaper engagement
WordStream's 2026 online advertising cost guide puts TikTok's cost per click at USD 0.30 to USD 1.50 and its cost per view as low as USD 0.01, against Instagram's cost per click of USD 0.40 to USD 2 and cost per engagement of USD 0.03 to USD 0.08. Which platform is "cheaper" depends on what the campaign is buying: a click, a view, or an interaction.
Our Meta ROI breakdown covers the equivalent comparison for Facebook if the budget spans all three platforms.
| Cost metric | TikTok | What it buys | |
|---|---|---|---|
| Cost per click (CPC) | USD 0.30 - 1.50 | USD 0.40 - 2 | A visit to the destination |
| Cost per view (CPV) | USD 0.01 - 0.07 | n/a | A video impression, TikTok specific |
| Cost per engagement (CPE) | n/a | USD 0.03 - 0.08 | A like, comment or share, IG specific |
Commerce: TikTok is building a second business inside the app
TikTok Shop's global gross merchandise value reached an estimated USD 50.3 billion in the first half of 2026, up 92% year over year, according to Momentum Works data reported by Tubefilter, with USD 11.8 billion of that inside the United States. Instagram has commerce features layered on the same feed, but no comparable in-app marketplace generating a standalone GMV figure of that size has been published.
That gap matters for any brand weighing the two platforms for direct response: TikTok is increasingly a checkout, not only a discovery feed.
What the comparison means for a media plan
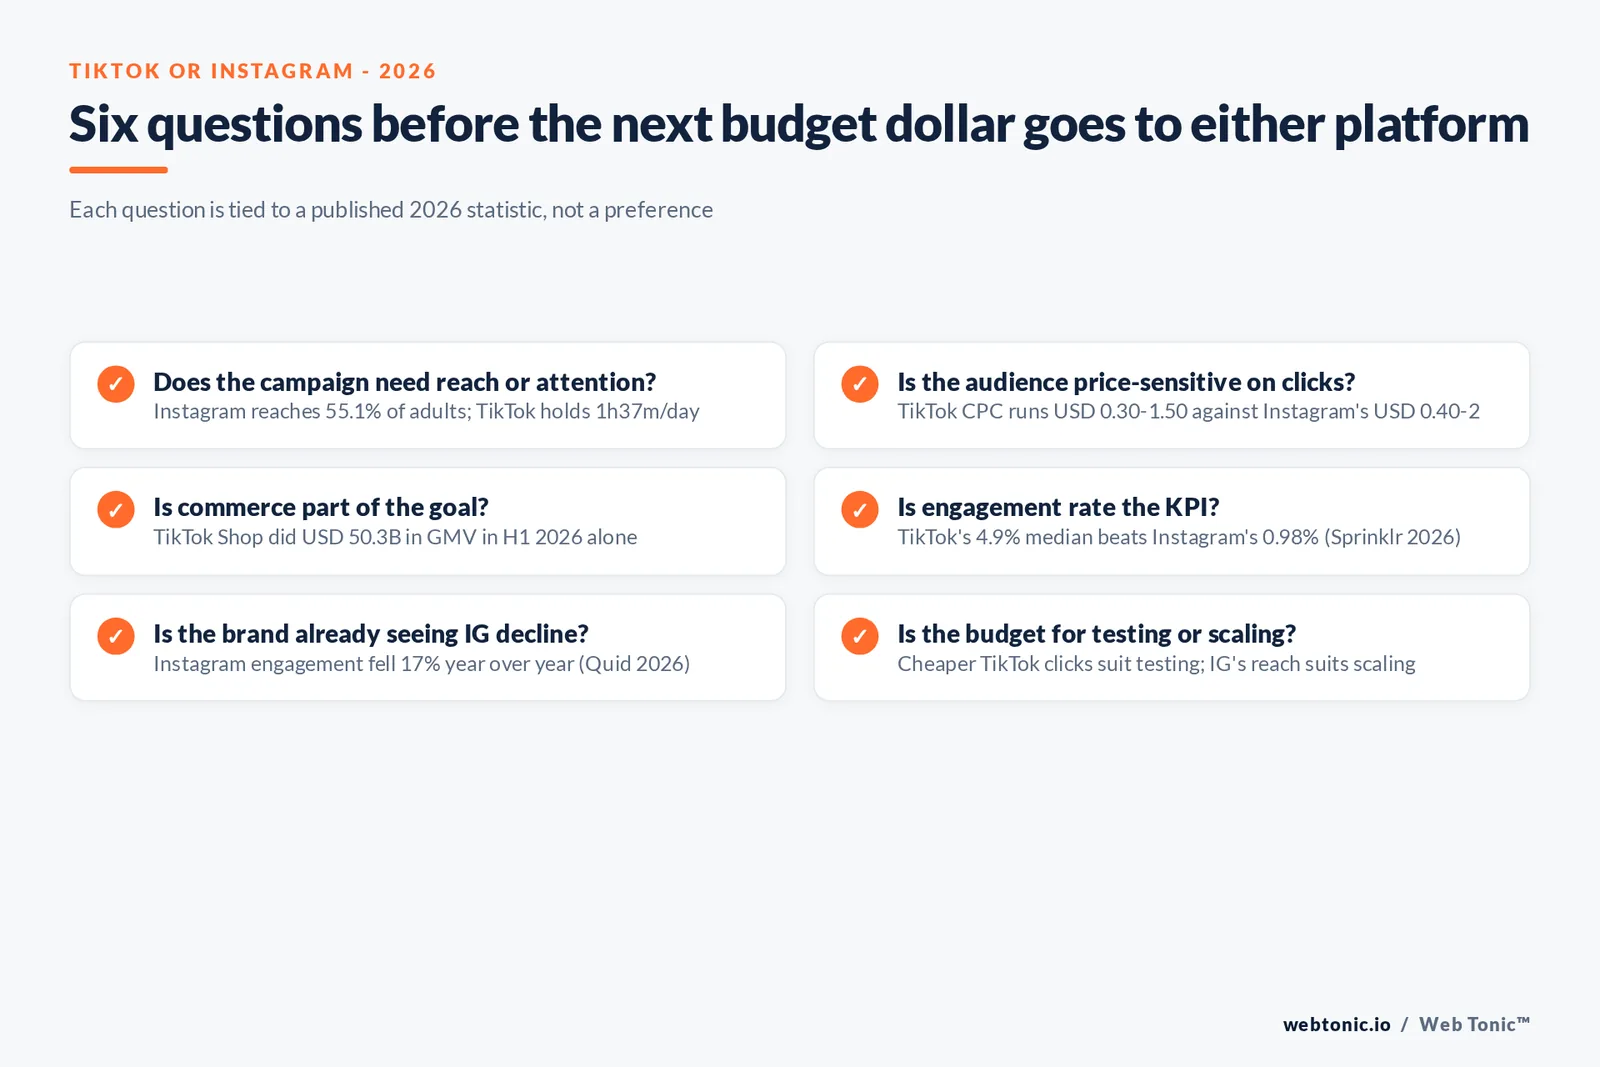
Instagram's larger, more mainstream audience (55.1% past-month usage against TikTok's 36% ex-China) makes it the safer choice for broad reach and retargeting. TikTok's engagement rate, running five to seven times higher across two independent studies, and its cheaper per-click cost make it the stronger choice for top-of-funnel creative testing and for commerce campaigns riding TikTok Shop's growth.
Neither platform replaces the other in a 2026 plan - the numbers argue for running both, sized by the job each one does best. Our growth marketing team builds that split from a client's own conversion data rather than a fixed ratio.
A useful starting split for a brand new to both platforms: weight discovery and creative-testing budget toward TikTok given its cheaper clicks and higher engagement ceiling, and weight retargeting and reach-extension budget toward Instagram given its larger, more broadly distributed audience. Revisit the split quarterly against fresh CPC and engagement data rather than locking it in for the year, since both platforms' numbers moved meaningfully within 2026 alone.
Where the gap could close or widen next
Instagram's 17% year-over-year engagement decline (Quid, 2026) suggests the platform's feed is getting more crowded per user, which typically pushes brands toward paid amplification to hold the same reach they got organically. TikTok's engagement has stayed closer to stable across the same period, which is part of why eMarketer's H2 2026 forecast singles out Meta and TikTok specifically as the platforms driving continued ad spend growth.
If Instagram's decline continues at a similar pace, expect budgets to keep tilting toward paid social exactly on the platform where organic reach is falling fastest.
Demographics: who is actually on each platform
GWI's survey data, reported inside DataReportal's Digital 2026 report, shows Instagram skewing toward the broadest adult audience of the two - it is the clear favourite among users aged 16 to 34, while platforms like WhatsApp only overtake it once users pass 35. TikTok's ex-China usage figure of 36% concentrates more heavily in the same younger cohort but starts from a smaller overall base. Neither platform's demographic skew is dramatic enough to rule the other out for a mainstream consumer brand, but a campaign targeting an older B2B or professional audience will find more of it on Instagram than on TikTok.
Our Meta Ads management practice builds audience targeting around these demographic splits rather than a platform-wide assumption.
| Demographic signal | TikTok | Source | |
|---|---|---|---|
| Favourite platform, ages 16-34 | Leading choice | Strong but smaller base | GWI, via DataReportal |
| Favourite platform, ages 35+ | Declines relative to WhatsApp | Declines further | GWI, via DataReportal |
| Global monthly active users | 3 billion+ | Not officially disclosed | Meta / industry estimates |
What creators and brands are actually posting
Format preference has shifted on both platforms toward short-form video, but the split still differs. Instagram's own growth is concentrated in Reels, which the platform's algorithm now favours over static posts in distribution. TikTok's entire library is short-form video by design, which is part of why its per-post engagement rate holds so far ahead of Instagram's blended average across formats - there is no lower-performing static-photo format dragging the median down.
A brand publishing the same asset natively on both platforms should expect it to under-perform its TikTok benchmark if repurposed without editing for the platform's own pacing and sound conventions - a distinct production decision from simply cross-posting.
Measurement: why the two engagement figures disagree
Quid's 2.01% TikTok figure and Sprinklr's 4.9% figure both describe 2026, and both show the same platform ranking, yet they land on different absolute numbers because they sample different post sets and normalize against different denominators - one against total impressions, the other against a broader engagement-to-follower ratio. Neither figure is wrong; they answer slightly different questions.
The practical lesson for a manager reporting these numbers upward: pick one benchmark source per platform and stay with it quarter over quarter, because the absolute number moves less than the choice of methodology does. Our cross-channel cost guide applies the same discipline to paid search benchmarks, where the same methodology gap exists between tools.
| Benchmark source | TikTok engagement | Instagram engagement | Denominator |
|---|---|---|---|
| Quid 2026 Benchmark Report | 2.01% | 0.30% | Interactions per impression |
| Sprinklr 2026 Social Index | 4.9% | 0.98% | Interactions per follower |
Frequently Asked Questions
Which platform holds attention longer, TikTok or Instagram?
TikTok, by a clear margin. Similarweb's app-intelligence data, published inside DataReportal's Digital 2026 Global Overview Report, puts the typical TikTok user at 1 hour and 37 minutes a day on the Android app against 1 hour and 13 minutes for Instagram - TikTok runs roughly 33% longer per session.
Which platform has the higher engagement rate?
TikTok again, though the margin depends on the study. Quid's 2026 Social Media Industry Benchmark Report puts TikTok's all-industry median engagement rate at 2.01% against Instagram's 0.30%. Sprinklr's 2026 Social Index puts TikTok at 4.9% against Instagram's 0.98%. The two studies use different denominators, but both show TikTok several times ahead.
Which platform is cheaper to advertise on?
TikTok, on a per-click basis. WordStream's 2026 data puts TikTok CPC at USD 0.30 to USD 1.50 against Instagram's USD 0.40 to USD 2, with TikTok's cost-per-view floor as low as USD 0.01. Instagram's cost per engagement, USD 0.03 to USD 0.08, is the more relevant comparison for brands buying engagement rather than clicks.
Does Instagram still have the bigger audience?
Yes, by a wide margin globally. Meta CEO Mark Zuckerberg stated Instagram had reached 3 billion monthly active users as of September 2025. GWI's survey data, cited in DataReportal's Digital 2026 report, ranks Instagram third among platforms by monthly usage at 55.1% of online adults, well ahead of TikTok's ex-China figure of 36%.
Should a brand pick one platform over the other?
The data argues for both, split by job. Instagram's larger reach and lower relative engagement suit retargeting and reach campaigns; TikTok's higher engagement rate and cheaper clicks suit top-of-funnel testing and creative discovery. Momentum Works data shows TikTok Shop alone generated USD 50.3 billion in global GMV in the first half of 2026, so commerce budgets increasingly need a line on both.
Sources
DataReportal - Digital 2026 Global Overview Report (Kepios, We Are Social, Meltwater)
Reuters - Meta CEO says Instagram has grown to 3 billion monthly active users
Quid (formerly Rival IQ) - 2026 Social Media Industry Benchmark Report
Sprinklr - Social Media Engagement: What the Data Says, 2026
WordStream - The comprehensive guide to online advertising costs, 2026
Tubefilter - TikTok Shop GMV data from Momentum Works, 2026
EMARKETER - US Social Network Ad Spending, H2 2026