



Table of contents
97% of B2B marketers now say they have a strategy, and only 13% say its effectiveness improved significantly last year. That gap is what marketing strategy consulting is actually hired to close - and it is measurable with benchmarks that already exist.
Key Takeaways
- 97% of B2B marketers report having a content strategy; only 3% do not.
- Just 13% say strategy effectiveness improved significantly; 30% saw it stay flat.
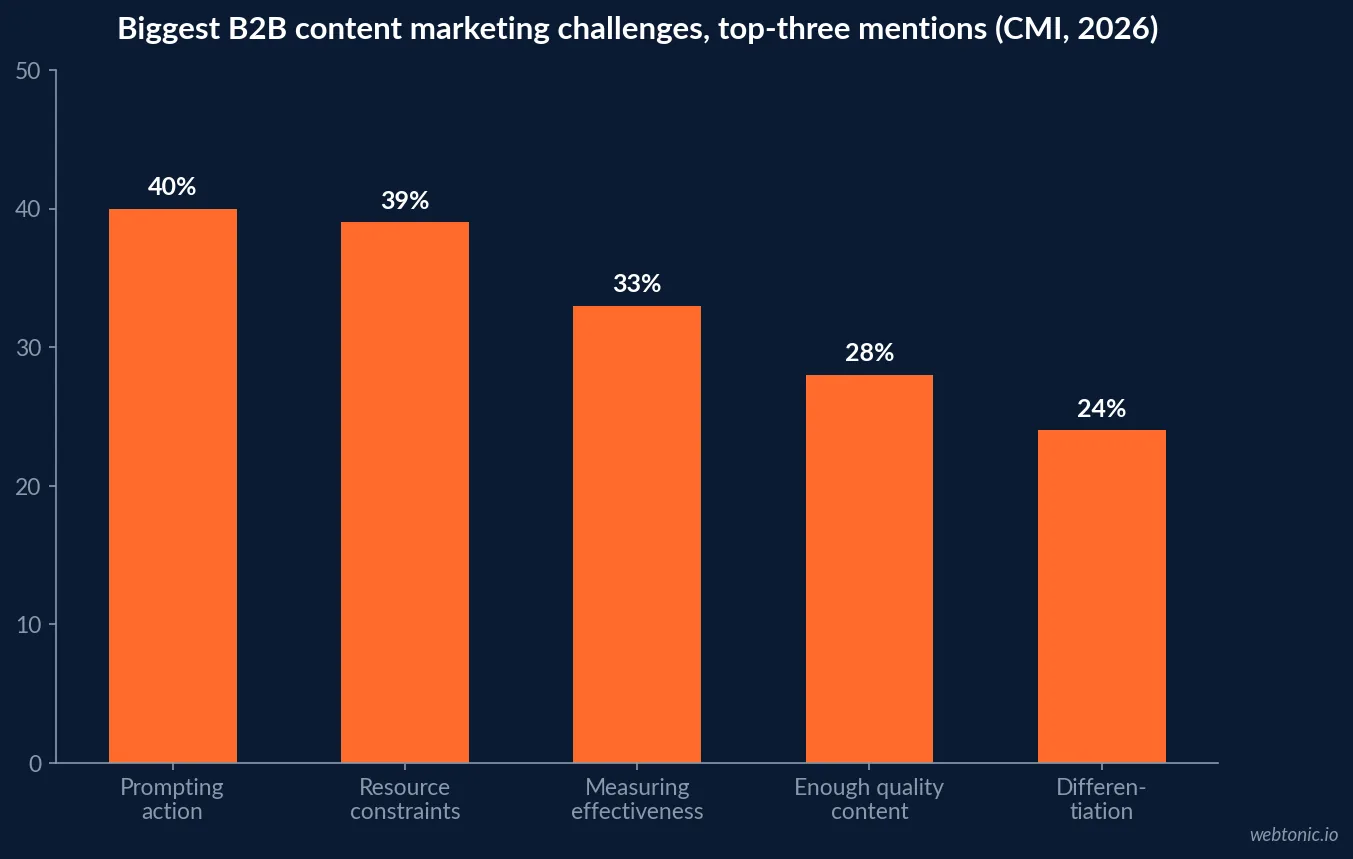
- The top challenge is creating content that prompts action, at 40%.
- Resource constraints follow at 39% and measuring effectiveness at 33%.
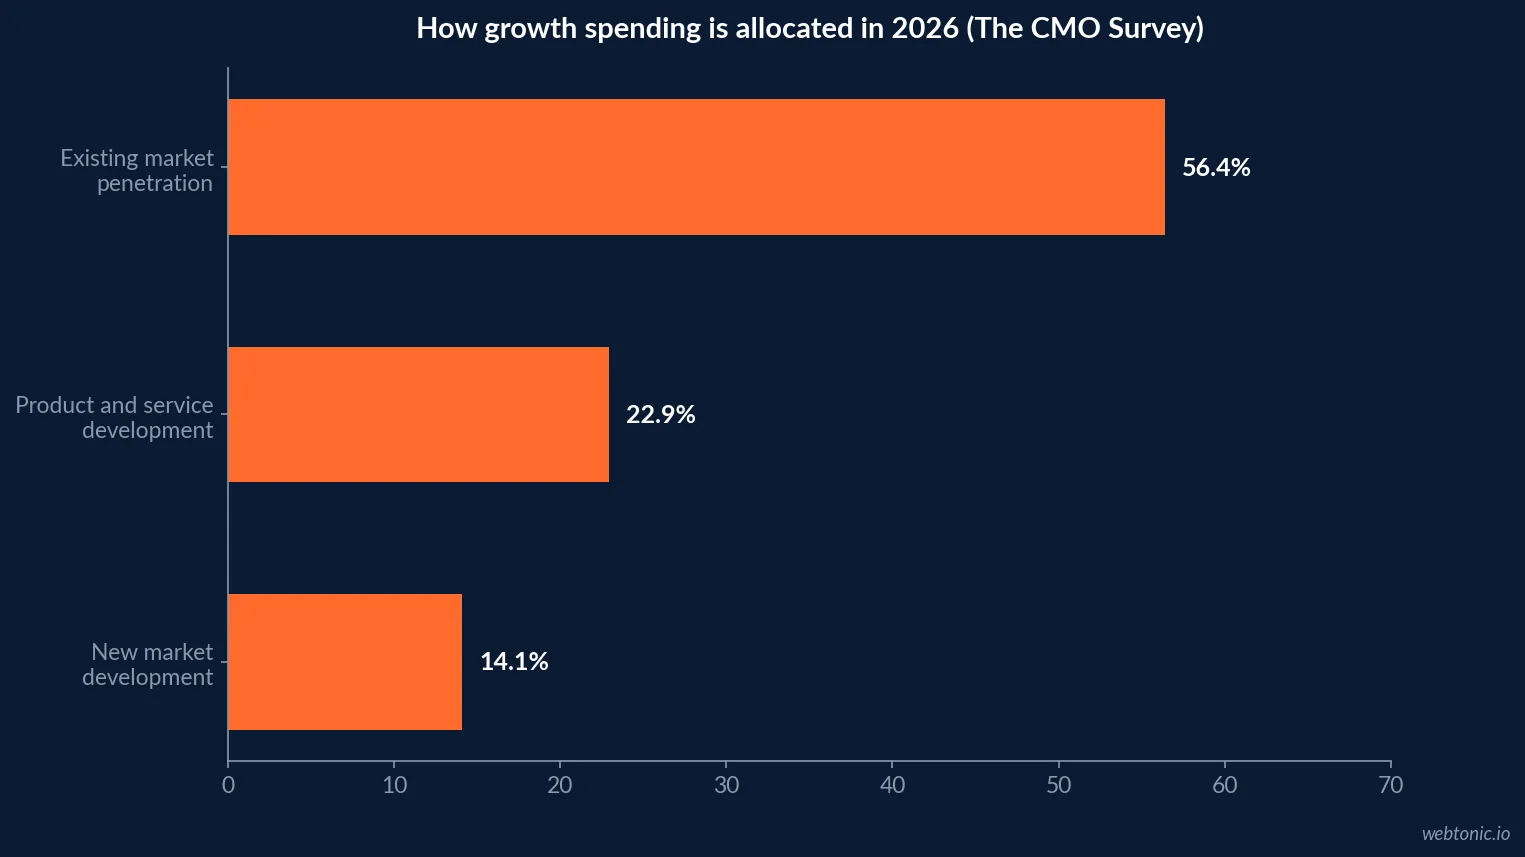
- Existing market penetration takes 56.4% of growth spending.
- Product and service development rose to 22.9% from 19.2% since 2024.
- New market development fell to 14.1% from 17.0%.
- Marketers spend 68% of their time on the present, 32% on the future.
- 70.6% shift toward short-term impact under executive pressure.
- 71% of leaders call agility key to their organisation's success.
- High-growth firms grew 36.6% against a 9.9% market median.
- 80% of high-growth firms run structured research; one in five firms run none.
The planning gap, in numbers
The Content Marketing Institute's 2026 B2B research reports 97% of marketers with a content strategy and 3% without. Among those with one, 13% saw effectiveness improve significantly, 48% somewhat and 30% saw no change. Documented strategy has stopped being a differentiator and become a hygiene factor.
The stated obstacles explain why. Asked for their top three challenges, B2B marketers named creating content that prompts a desired action at 40%, resource constraints at 39% and measuring content effectiveness at 33%, followed by producing enough quality content at 28% and differentiating from competitors at 24%. Notably, developing a strategy and plan ranks near the bottom at 16% - the plan is not what teams find hard.
| Challenge named in top three | Share of B2B marketers | What it points at |
|---|---|---|
| Creating content that prompts action | 40% | Offer and message, not volume |
| Resource constraints (time, people, budget) | 39% | Sequencing, not ambition |
| Measuring content effectiveness | 33% | Measurement precedes strategy |
| Creating enough quality content | 28% | Production model and standards |
| Differentiating from competitors | 24% | Positioning work |
| Aligning content with the buyer's journey | 23% | Funnel mapping |
| Developing a strategy and plan | 16% | Planning is the easy part |
Which KPIs have a real external benchmark
This is the most useful discipline a strategy engagement can impose. Some metrics have a population-matched public benchmark; most do not, and inheriting a number from an unrelated sample is worse than having none. The table below splits them honestly.
| KPI | External benchmark available? | 2026 reference point |
|---|---|---|
| CAC payback period | Yes, software population | 16-month median, 10 to 24 quartiles |
| Marketing spend as share of revenue | Yes | 9.0% overall; 12.0% high-growth services |
| Profitability | Yes, services population | 39.5% high growth, 20.3% no growth |
| Growth rate | Yes, services population | 9.9% median, 36.6% high growth |
| Lead source mix | Yes, services population | Referrals 39.5% of leads |
| Conversion rate and CTR | No usable public benchmark | Use own trailing twelve months |
| MQL to SQL rate | No usable public benchmark | Define the stages first |
| Share of voice | No, category-specific | Measure against named rivals only |
Where growth budgets actually go
The CMO Survey's 2026 report shows existing market penetration dominating growth spending at 56.4%, with product and service development at 22.9%, up from 19.2% since 2024, and new market development down to 14.1% from 17.0%. Firms choosing penetration cite core strengths and resource constraints; those choosing new offerings point to AI and digital innovation.
Strategy work has to be written for that reality. 19.0% of companies are combining loyalty building with a premium-segment focus and 18.7% loyalty with new segments in current geographies - deepening rather than expanding. A recommendation to enter a new market is not wrong, but it now needs to survive a budget conversation running the other way.
| Growth strategy | Share of growth spending | Change since 2024 |
|---|---|---|
| Existing market penetration | 56.4% | Still dominant |
| Product and service development | 22.9% | Up from 19.2% |
| New market development | 14.1% | Down from 17.0% |
| Loyalty plus premium segments | 19.0% of companies | Inward orientation |
| Loyalty plus new segments, same geography | 18.7% of companies | Expansion without new markets |
The execution constraints any plan inherits
The same survey quantifies why good plans stall. Marketers spend roughly 68% of their time managing the present against 32% preparing for the future, unchanged since 2019. Under executive pressure, 70.6% shift toward short-term impact and 47.1% return to established strategies. Training budgets have fallen to 3.8% of marketing spend from a pre-pandemic 5.8%, and headcount growth has slowed by more than 50% year over year.
Meanwhile 71% of leaders call developing agility key to their organisation's success, with a further 25% calling it moderately important. Agility with no protected time and a shrinking training budget is an aspiration, not a capability - and a strategy that ignores the arithmetic gets quietly abandoned by the second quarter.
| Execution constraint | 2026 reading | Design response in the plan |
|---|---|---|
| Time on the present | 68% of marketing time | Protect calendar slots explicitly |
| Shift to short-term under pressure | 70.6% of leaders | Front-load a visible quick win |
| Return to established strategies | 47.1% of leaders | Pilot new channels small |
| Training budget | 3.8% of marketing spend | Buy the skill or narrow the scope |
| Headcount growth | Down more than 50% | Plan for the current team |
What the top cohort does differently
The Hinge Research Institute's High Growth Study 2026 gives the clearest behavioural contrast. High-growth firms posted 36.6% median growth against a 9.9% market median and 39.5% profitability against 20.3% for no-growth firms, while allocating 12.0% of revenue to marketing against 5.0%.
On behaviour: 80% of high-growth firms conduct structured research, with 46.1% doing competitive research and 45.2% client satisfaction or marketplace research, while one in five firms conduct none at all. Referrals still generate 39.5% of leads with sales and direct outreach at 23.5%. And SEO and keyword research fell from 33.5% to 27.0% - a shift worth watching as AI answers absorb more discovery, and one we track in our data and analytics work.
The scorecard to hold a strategy engagement to
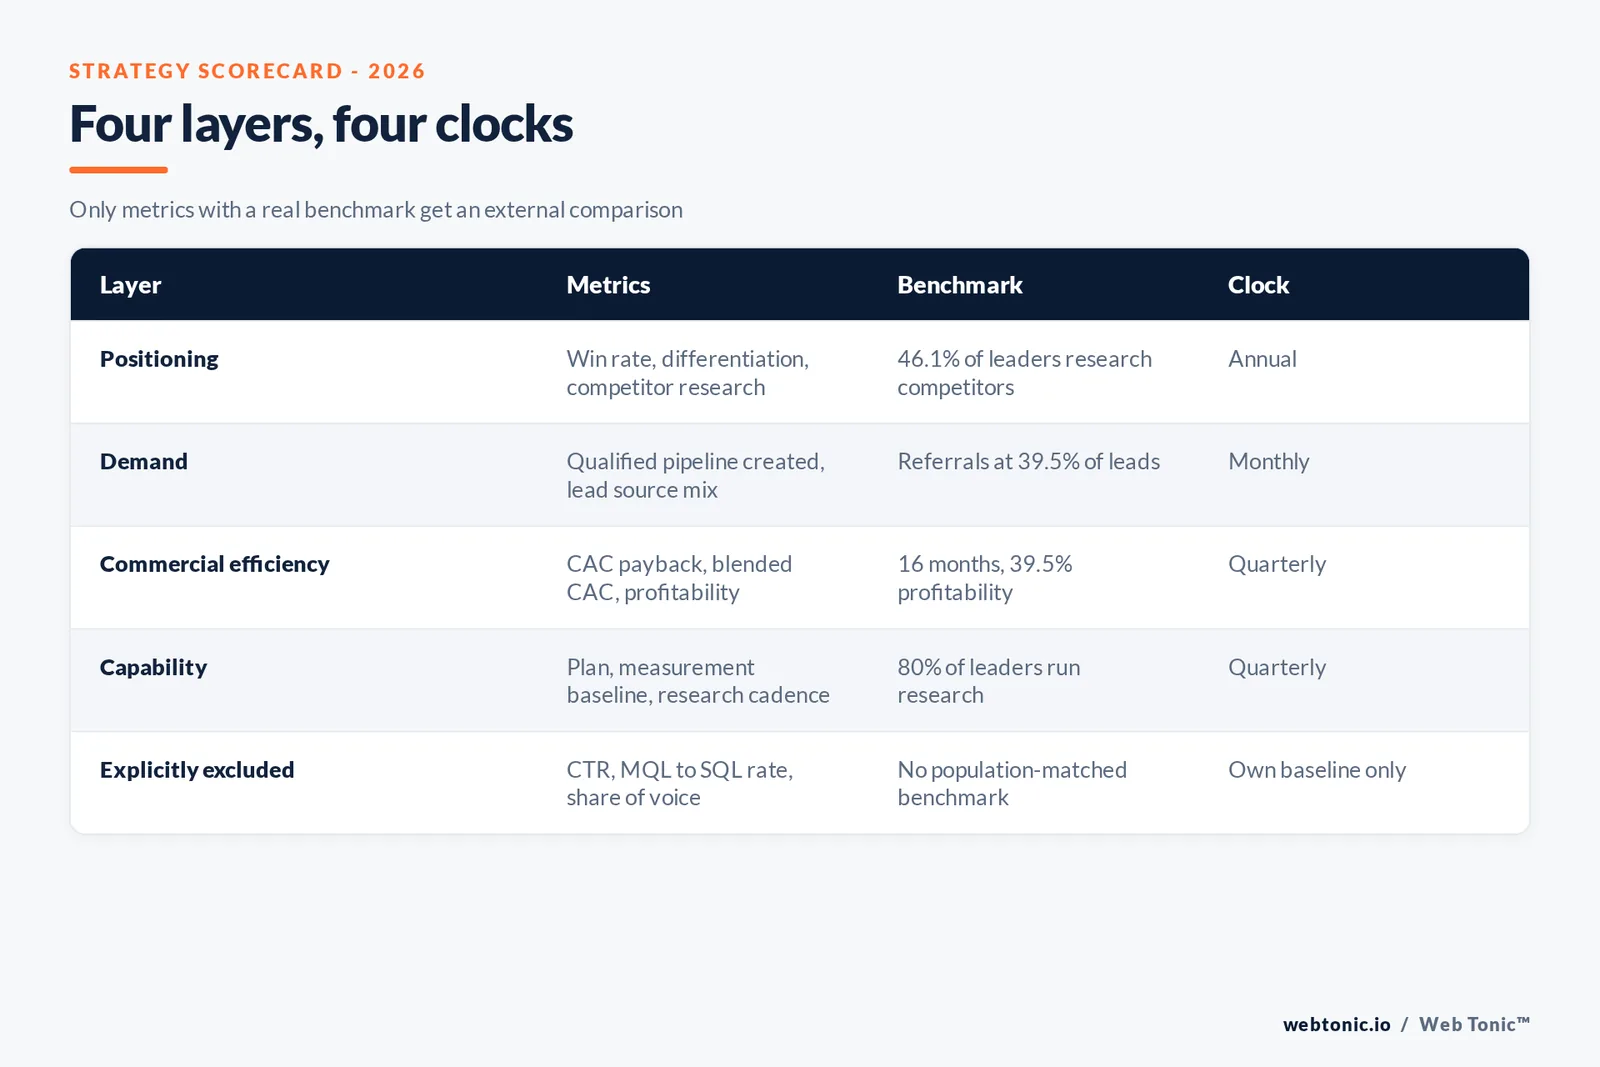
Four layers, each with a benchmark that exists and a clock that matches how slowly the metric can move. This is the structure we write into growth marketing engagements, and it is deliberately short: a scorecard with twenty metrics gets read by nobody.
| Layer | Metrics | Benchmark | Review clock |
|---|---|---|---|
| Positioning | Win rate, differentiation, competitive research cadence | 46.1% of leaders research competitors | Annual |
| Demand | Qualified pipeline created, lead source mix | Referrals 39.5% of leads | Monthly |
| Commercial efficiency | CAC payback, blended CAC, profitability | 16 months; 39.5% profitability | Quarterly |
| Capability | Documented plan, measurement baseline, research cadence | 80% of leaders run research | Quarterly |
Positioning and message, where the data is thinnest
The hardest part of strategy consulting has the least public benchmark data, and 2026 made that worse. HubSpot's 2026 State of Marketing report finds 61% of marketers calling this the biggest disruption in 20 years because of AI, with 80% using AI for content creation and 75% for media production. When production is commoditised, differentiation moves to point of view - which is unmeasurable by CTR and only visible in win rate and referral behaviour over quarters.
Two proxies are usable. First, differentiation as a named challenge: 24% of B2B marketers list it in their top three. Second, thought-leadership measurement: CMI reports marketers tracking audience engagement at 80%, business impact at 63%, audience feedback at 40% and brand authority at 38%. Moving business impact and brand authority up that list is a realistic twelve-month goal for a positioning engagement.
| Positioning proxy | 2026 reading | How to use it |
|---|---|---|
| Differentiation named a top challenge | 24% of marketers | Baseline the perceived sameness |
| Tracking audience engagement | 80% of marketers | Necessary but weak evidence |
| Tracking business impact | 63% | Target metric for a strategy engagement |
| Tracking brand authority | 38% | Second target metric |
| Marketers calling AI the biggest disruption | 61% | Point of view becomes the moat |
How to read this benchmark set without misusing it
Three rules. Match the population: Hinge measures professional services firms, Benchmarkit measures B2B software, The CMO Survey leans large US organisations and CMI measures B2B content teams. Separate correlation from cause - high-growth firms research and spend more, but no study proves the sequence. And date every figure, since spending and payback benchmarks both moved materially inside a year.
Used that way, the set does the job strategy work most needs at the start: it tells you whether the constraint is the message, the demand engine, the unit economics or simply the size of the budget. That diagnosis is the first deliverable worth paying for, and you can get in touch if you want a second read on which one is yours. For the paid-media side of the same question, our Google Ads strategy guide covers the channel-level version.
Related reading
- Marketing Strategy Consulting Statistics: ROI and Payback
- Marketing Operations Consulting Statistics: Benchmarks and KPIs
- Marketing Strategy Consulting: what it costs in 2026
- Marketing Strategy Consulting services at Web Tonic
Frequently Asked Questions
Do documented marketing strategies still differentiate anyone?
No. The Content Marketing Institute's 2026 B2B research found 97% of marketers saying they have a content strategy, with only 3% saying they do not. Among those with one, 13% said effectiveness improved significantly in the last twelve months, 48% somewhat and 30% stayed flat. Having a plan is now table stakes; the measurable variable is whether the plan changed what the team does, which is why execution benchmarks matter more than planning artefacts.
Which marketing KPIs have a credible external benchmark in 2026?
Fewer than most dashboards imply. CAC payback has one: Benchmarkit's calendar-2025 study puts the median at 16 months with a first quartile of 10 and a fourth of 24. Marketing spend as a share of revenue has one: 9.0% in The CMO Survey and 12.0% versus 5.0% between high-growth and no-growth professional services firms in Hinge's study. Lead-source mix has one: referrals at 39.5% of leads at high-growth firms. Conversion rate, MQL-to-SQL rate and share of voice do not have a population-matched public benchmark worth inheriting - those should be measured against your own trailing twelve months.
What does a strategy engagement actually change in the numbers?
Usually the allocation, not the total. The CMO Survey shows existing market penetration remaining the dominant growth strategy at 56.4% of growth spending, with product and service development at 22.9%, up from 19.2% since 2024, and new market development at 14.1%, down from 17.0%. Companies choosing penetration cite core strengths and resource constraints. A strategy engagement that recommends new market entry is arguing against both the budget trend and the stated reasoning behind it.
How much of a marketing team's time is available for strategy work?
About a third, and it has not moved. The CMO Survey finds marketers spending roughly 68% of their time managing the present against 32% preparing for the future, a ratio unchanged since 2019, while 70.6% respond to executive pressure by shifting toward short-term impact and 47.1% return to established strategies. Any plan assuming protected strategic time needs that time written into the calendar, or the plan is competing with firefighting and will lose.
What separates high-growth firms on strategy behaviour?
Research cadence and spending level. Hinge's High Growth Study 2026 found 80% of high-growth firms conducting some structured research, with 46.1% doing competitive research and 45.2% running client satisfaction or marketplace research, while one in five firms conduct none at all. Those firms posted 36.6% median growth and 39.5% profitability against 9.9% market median growth. The correlation is strong; the study does not prove causation, so treat research cadence as a measurable input rather than a guaranteed lever.
Sources
Content Marketing Institute - B2B Content and Marketing Trends 2026
The CMO Survey - Highlights and Insights Report 2026
Hinge Research Institute - High Growth Study 2026
Benchmarkit - B2B SaaS Performance Metrics Benchmarks (CY-2025)
HubSpot - 2026 State of Marketing
Sagefrog - 2026 B2B Marketing Mix Report
Spencer Stuart - CMO Tenure 2026 Snapshot
RSW/US - 2026 New Year Outlook Report


