



Table of contents

Measuring a marketing audit means measuring two different things: whether the audit was any good, and whether the business changed afterwards. Most companies report neither.
Key Takeaways
- Measure the audit on three layers: implementation (was it acted on), correction (was measurement fixed), and commercial outcome (did the numbers move).
- The primary audit metric is recommendation implementation rate — implemented recommendations divided by total recommendations, tracked as a standard audit KPI.
- Set the baseline before the audit ends and freeze it. A corrected baseline is a finding, not a moving target.
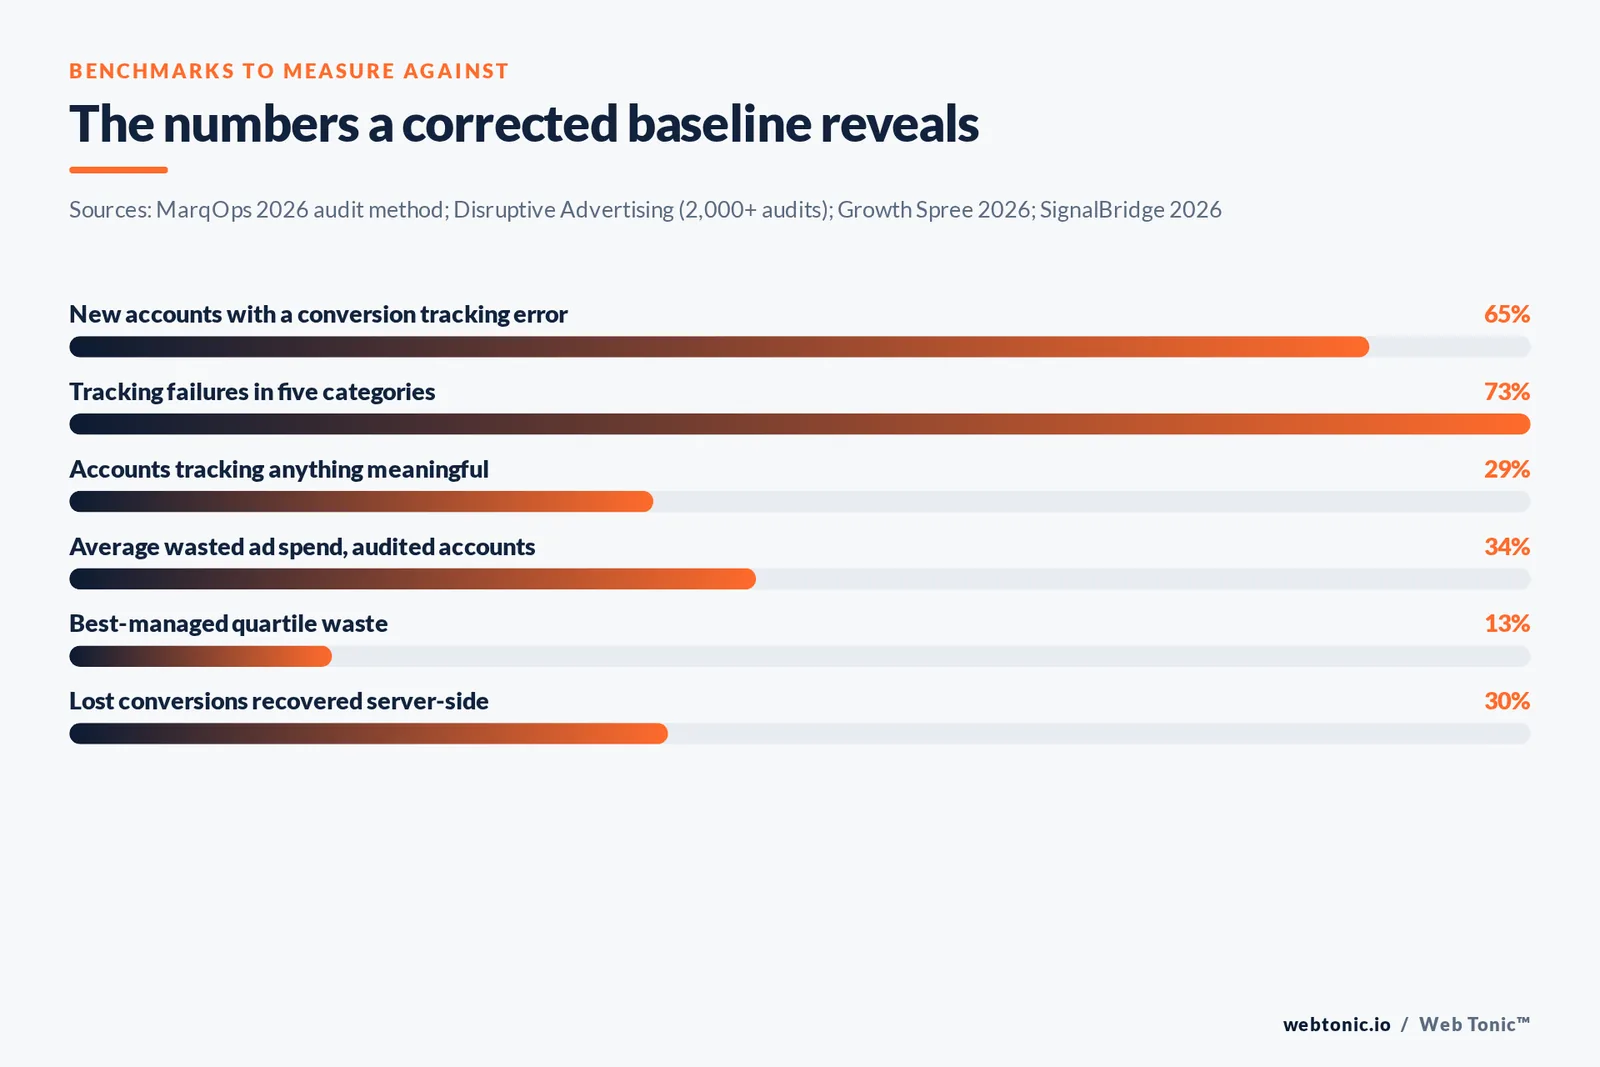
- Verify your data first. Practitioner reviews find conversion tracking errors in 60–70% of newly audited accounts, and 73% of failures cluster into five repeatable categories.
- Waste recovery is the most measurable single output. Audited account samples show 34% average waste, with a 13.2% to 49.8% spread by management quality.
- Attribute conservatively: use the best-managed-quartile waste figure, not the average, and count only spend you actually moved.
- Report a ratio, not a story. One published worked example puts recovered value at $10,000–$50,000 in 90 days against a $3,000 audit fee, and says plainly that it depends on spend.
Why audits so rarely get measured
An audit produces a document, and documents feel self-evidently valuable. The measurement problem is that the deliverable and the outcome are separated by a quarter of other people's work, so by the time the numbers move, several other things have changed too — seasonality, a pricing decision, a new competitor, a site release.
The way out is to measure the chain rather than the endpoint. Audit KPI frameworks put implementation rate first for this reason: a recommendation that was never implemented cannot have failed, and reporting on it as though it had is how good diagnosis gets blamed for weak execution.
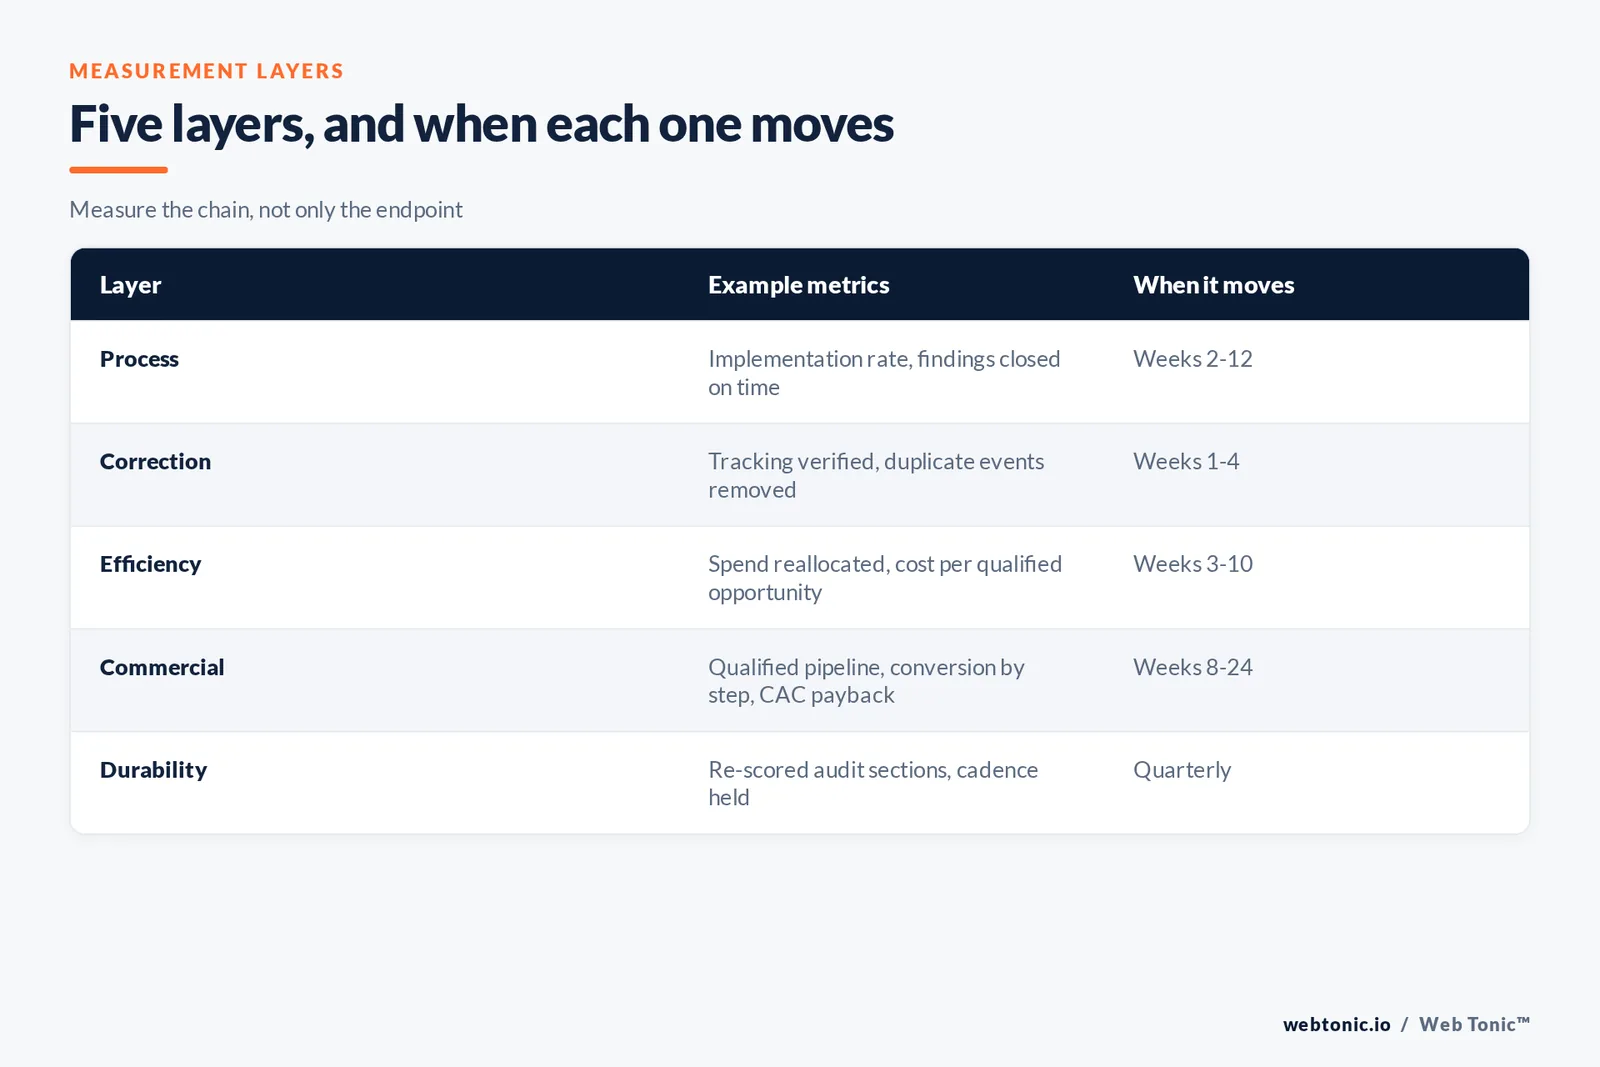
So a marketing audit should be measured on three layers, in order of controllability. Layer one is process: how much of the plan was executed, on time, by the named owner. Layer two is correction: is the measurement stack now trustworthy, and by what test. Layer three is commercial: cost per qualified opportunity, waste removed, contribution by channel.
| Layer | Example metrics | When it moves |
|---|---|---|
| Process | Implementation rate, findings closed on time, owners assigned | Weeks 2–12 |
| Correction | Tracking verified end to end, duplicate events removed, definitions agreed | Weeks 1–4 |
| Efficiency | Spend reallocated, wasted-spend share, cost per qualified opportunity | Weeks 3–10 |
| Commercial | Qualified pipeline, conversion rate by step, CAC and payback | Weeks 8–24 |
| Durability | Re-scored audit sections, review cadence held, single dashboard in use | Quarterly |
Fix the instrument before you read it
Measuring outcomes on broken tracking produces confident nonsense. Practitioner audit data reports a conversion tracking error in roughly 60–70% of newly reviewed accounts, with 73% of failures falling into five repeatable categories. An analysis of more than 2,000 account audits found 57.7% of accounts had conversion tracking installed while only about half of those tracked anything meaningful — roughly 29% able to say whether campaigns worked.
Duplicate counting is the most common and the most flattering error: a platform tag and an analytics import both recording the same conversion can inflate reported results two- to three-fold. An audit that removes it will appear to make performance worse. That is why the corrected baseline must be recorded as a finding, with the before and after side by side, or month two turns into an argument.
Collection loss is the mirror image. 2026 server-side tracking benchmarks report recovery of 20–40% of previously lost conversions in typical e-commerce implementations — demand that existed but was invisible. Both directions have to be settled before any channel is graded, because the audit's own credibility rests on the numbers it hands the team.
The efficiency layer, measured honestly
Waste recovery is the cleanest number an audit produces, because it is a decision you can point at. A 2026 study of 104 B2B accounts covering $78m of spend measured average waste of 34% — around $255,000 per account — with a spread from 13.2% in the best-managed quartile to 49.8% in the worst. Wasted-spend research treats this as a maintained benchmark rather than a one-off headline, which is what makes it usable for forecasting.
Two disciplines keep the claim defensible. Count only budget you actually moved or switched off, evidenced by platform change history — not budget you identified as questionable. And when estimating value before the fact, use the best-managed-quartile figure, so the forecast survives contact with a well-run account.
Then convert to a rate the finance team recognises. Published audit ROI guidance uses the plain formula — recovered value minus audit investment, divided by audit investment — and the same source is clear that ongoing tracking frameworks, not the report, are what sustain it. Reporting one ratio with the inputs shown beats a page of narrative.
Setting a baseline you can be judged against
A baseline needs four properties: it is recorded before changes ship, it uses the corrected data, it names the comparison window, and it includes the competitive context. Audit guidance on sequencing is a good discipline here — start with which channels and campaigns drive conversions and at what cost, then layer attribution to see assists, then compare to benchmarks. Skipping to attribution first is how teams end up debating models instead of results.
Context matters as much as the level. HubSpot's audit framing puts it neatly: a 3% conversion rate looks acceptable in isolation and looks like a problem when a direct competitor converts at 7%. Record the benchmark alongside your own number, or the day-90 review becomes a discussion of whether the number is "good".
Freeze the window too. Comparing a 30-day post-fix period against a 90-day pre-fix average is a common and unnecessary way to lose an argument. Same length, same seasonality where possible, stated in the report.
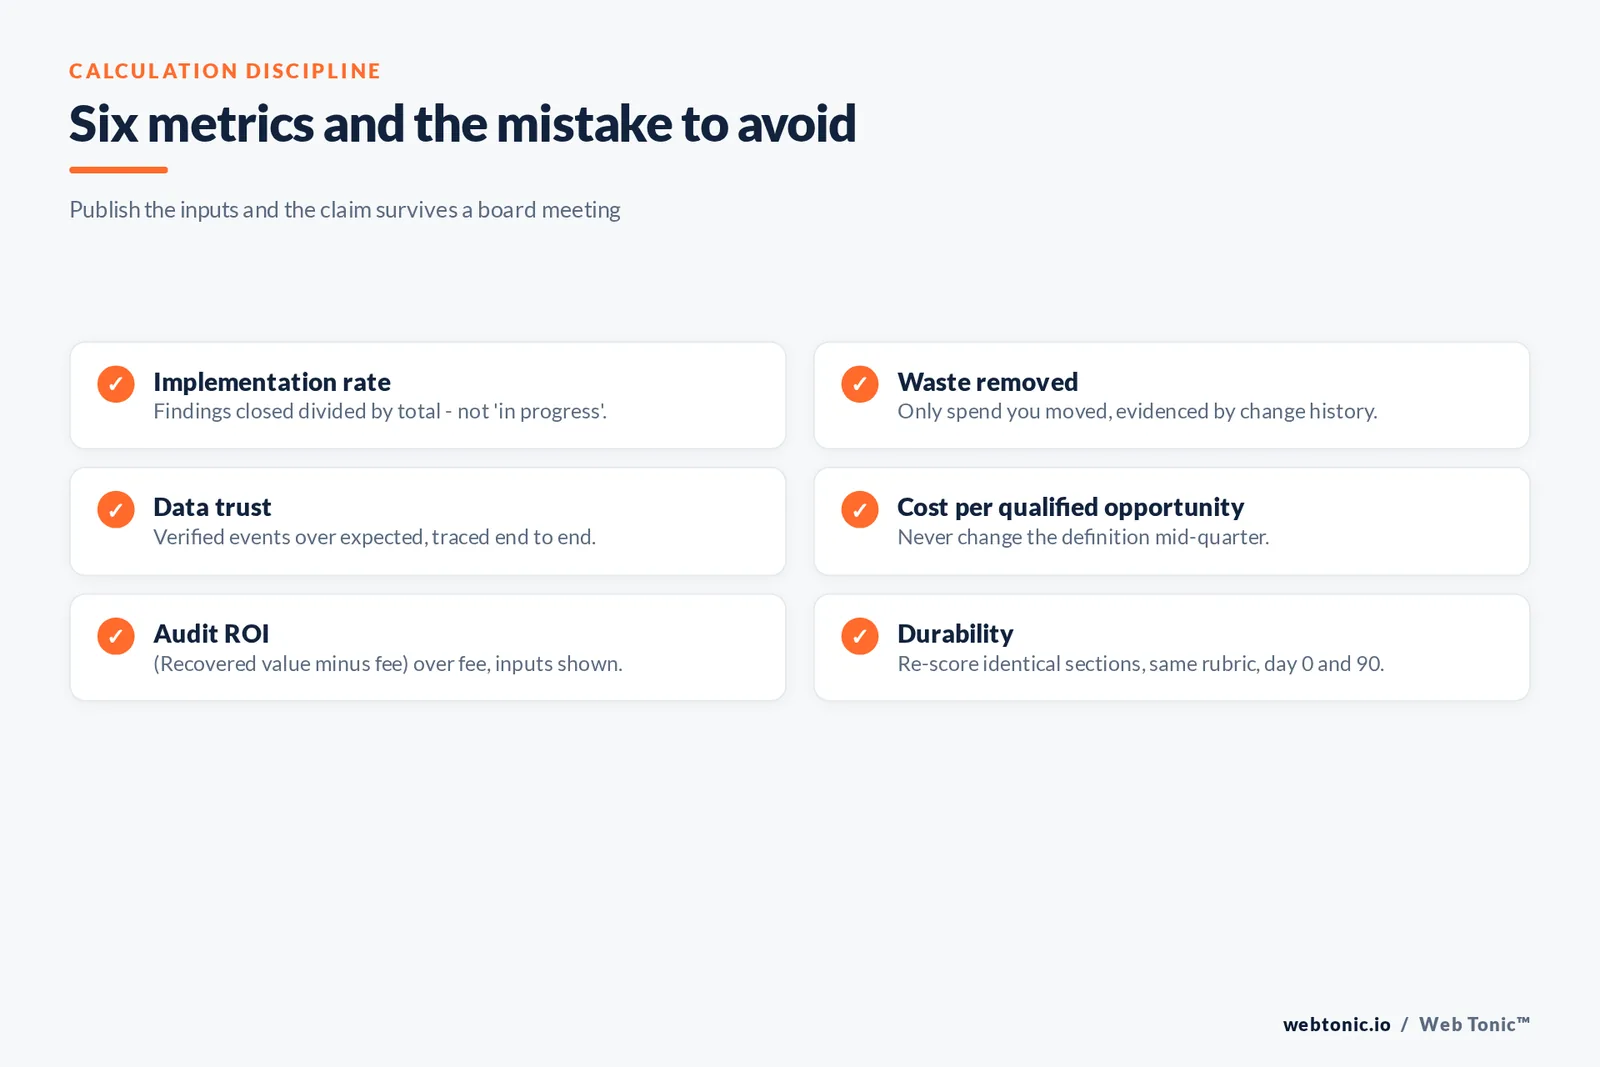
| Metric | How to calculate it | Common mistake |
|---|---|---|
| Implementation rate | Findings closed ÷ total findings, by severity | Counting "in progress" as closed |
| Waste removed | Spend switched off or reallocated, per change log | Claiming identified waste as recovered |
| Data trust | Verified events ÷ expected events, end to end | Trusting the platform's own status label |
| Cost per qualified opportunity | Spend ÷ opportunities meeting the written definition | Changing the definition mid-quarter |
| Audit ROI | (Recovered value − fee) ÷ fee, inputs shown | Attributing all growth in the window to the audit |
| Durability | Re-scored audit sections at day 90 versus day 0 | Re-scoring against different criteria |
Re-scoring: the measurement most teams skip
The simplest way to measure an audit is to run it again. Scored audit templates rate each section 0–5 against a defined standard, where 0 is absent or actively harmful and 5 is a competitive asset. Re-scoring the identical sections at day 90 turns a subjective improvement into a delta per area, and it exposes the areas everyone quietly avoided.
Keep the scope stable. Comprehensive audit checklists span a dozen or more areas — goals and strategy alignment, brand and messaging, SEO, paid efficiency, sales and marketing alignment, dashboards and KPIs. Adding areas at re-score time flatters or punishes the result arbitrarily. Same sections, same rubric, same reviewer where possible.
Audit methodology guidance also suggests scoring effort relative to your own team's capability rather than in absolute hours — twenty hours of specialist developer time is a very different score in a two-person company than in a fifty-person one. Effort scoring that ignores capacity produces plans that look reasonable and are not.
Measuring coverage across channels, not just the headline
A single blended number hides where the effectiveness actually changed. Break the commercial layer down by channel and by step so the audit's effect is visible: organic search and content, paid campaigns, email and lifecycle, social, website conversion, and the sales handover. For each, record one measure of efficiency and one of quality — cost per qualified opportunity and win rate, or cost per lead and the share that meets the written definition.
That structure also protects you from the most common measurement mistake, which is judging the whole organization on the metric that happens to be easiest to collect. If the audit's strongest recommendations concerned the website and email systems, those are the areas whose objectives should carry the clearest before-and-after evidence, and a channel the plan never touched should not be credited or blamed.
Where an audit produced customer-facing changes, add one qualitative check to the numbers: what customers now see, and any direct feedback from sales conversations after the change. A short study of five recent deals — what the buyer said, what they compared you against, which of your resources they actually used — often explains the quantitative movement better than another attribution model, and it costs nothing but an hour of someone's time.
Attribution honesty: what the audit can and cannot claim
An audit's defensible claim is narrow and worth more for being narrow. It can claim the waste removed, because there is a change log. It can claim the measurement corrections, because there is a before and after. It can claim the specific improvements from shipped fixes with their own acceptance tests. It cannot claim the quarter's revenue.
The proportionality test is useful in both directions. 2026 pricing data puts single-channel audits at roughly $2,500–$7,500 and comprehensive multi-channel audits at $8,000–$25,000, while agency cost benchmarks put a standalone technical SEO audit at $1,500–$5,000 for small-business scope. If a five-figure fee needs a six-figure claim to look sensible, the scope was wrong for the account, not the measurement.
One published worked example is instructive because it shows its inputs: a $3,000 external audit (or 40 hours of senior internal time, valued at $4,000–$6,000) against recovered value of $10,000–$50,000 in the first 90 days, a 2–10x first-quarter return, stated as dependent on ad spend and on how much was broken (worked example). Publish your assumptions the same way and the number will hold up in a board meeting.
A reporting shape that survives scrutiny
One page, five blocks. Baseline, with the correction noted. Findings by severity, with implementation rate. Waste removed, with the change log referenced. The two or three commercial metrics the plan claimed it would move, over matched windows. And the re-score delta per audit area with next quarter's three priorities.
Give every number an owner's name and a source system. Metrics without an owner drift; metrics without a source get re-derived differently in the next meeting. Where a number cannot be sourced cleanly, say so in the report — an acknowledged gap costs far less credibility than a confident figure someone later cannot reproduce.
Finally, agree the report format before the audit starts. Deciding what will count as success while the findings are still unknown is the single cheapest measurement discipline available, and it removes the temptation to grade the quarter on whichever metric happened to move.

Related reading
- Marketing Audit / Growth Audit: what it costs in 2026
- Fractional CMO: how to measure it
- EOS / Scorecard & KPI Advisory: how to measure it
- Marketing Strategy Consulting services at Web Tonic
Frequently Asked Questions
What is the single best metric for a marketing audit?
Recommendation implementation rate — implemented recommendations divided by total recommendations, broken out by severity. It is the only metric that isolates whether the audit was acted on, and every commercial result downstream depends on it.
How soon should we expect measurable results?
Measurement corrections land within about four weeks and efficiency gains within roughly ten. Commercial metrics such as qualified pipeline and CAC payback move over one to two quarters. Judging the audit on revenue at day 30 measures noise.
How do we separate audit impact from everything else?
Restrict the claim to changes with a change log and an acceptance test, use matched comparison windows, and note confounders — seasonality, pricing changes, site releases — in the report itself. A narrow, evidenced claim is more persuasive than a broad one.
Our numbers got worse after the audit. Did it fail?
Often the opposite: removing duplicate conversion counting can reduce reported conversions by a wide margin overnight. Compare corrected data to corrected data, and keep the pre-correction figures visible so the step change is explained rather than argued about.
How often should we re-score?
Re-score the same sections at day 90, then quarterly using an internal review. Commission a full external audit annually, or earlier after a step change in spend, a new market, a site rebuild or a change in marketing leadership.
Where to take this next
If your last audit was never measured, decide the scorecard before you commission the next one. Our marketing audit ships with ranked findings, a corrected baseline and a 90-day plan whose actions carry acceptance tests, data intelligence makes the measurement layer trustworthy first, growth marketing executes against the plan, the wider services lineup covers delivery, and the blog has more method detail. To agree what success will look like before the work starts, talk it through with us.
Sources
KPI Depot — Process Audit KPI Benchmarks
MarqOps — Google Ads Conversion Tracking: The 2026 Audit Method
Disruptive Advertising — Lessons from 2,000+ Account Audits
SignalBridge — 2026 Server-Side Tracking Benchmark Report
Growth Spree — B2B Google Ads Waste Report 2026
Improvado — Wasted Marketing Spend
Improvado — Marketing Audit Guide 2026
The Agency Auditor — Marketing Audit ROI
The Agency Auditor — Marketing Audit Checklist
HubSpot — What's a Marketing Audit?
Sivon HQ — Marketing Audit Template
MarkCMO — How to Run a Marketing Audit
Konabayev — Marketing Audit: Find and Fix Problems
The it Crowd — What a Marketing Audit Actually Costs


