



Table of contents
Effectiveness and efficiency are not the same question, and 2026's most-cited research is itself in public disagreement about how to measure the first one. This page sets out the actual numbers behind the debate, including the published rebuttal to the industry's most-repeated effectiveness claim.
Key Takeaways
- The IPA's research converges on roughly 60% of budget to brand building.
- And 40% to short-term activation, on average across studied categories.
- That ratio shifts to 50:50 or narrower in some online categories.
- A rival claim states creative quality explains 60.1% of campaign results.
- That claim is drawn from 1,265 Effie Insights campaigns.
- Covering nearly USD 140 billion in category revenue.
- Ehrenberg-Bass Institute's director publicly disputed the claim's methodology.
- Average 2026 marketing budgets sit at 7.8% of company revenue.
- Up only marginally from 7.7% in 2025 - essentially flat.
- 56% of CMOs say their budget cannot deliver their 2026 strategy.
- CMOs allocate 15.3% of marketing budget to AI initiatives.
- Yet only 30% report the maturity to scale that AI spend.
- Median B2B SaaS growth compressed from 30% to 20% since CY-2022.
- 75th-percentile growth fell further, from 75% to 42% over the same period.
- High-growth firms still spend 2.4 times more of revenue on marketing than no-growth firms.
Effectiveness is not the same question as efficiency
A campaign can hit every efficiency target — low cost per click, strong short-term ROAS — while contributing almost nothing to the slower effect that lowers acquisition cost and protects pricing power over the following years. The IPA's long-running effectiveness research, built from the IPA Effectiveness Awards Databank, frames this explicitly as two distinct advertising effects operating on two different clocks. Most attribution dashboards are built to see only the first one.
The budget split most effectiveness research converges on
The IPA's original analysis by Les Binet and Peter Field found that roughly 60% of budget on long-term brand building and 40% on short-term sales activation maximizes combined profit gain across the categories they studied. Their follow-up report, Effectiveness in Context (also hosted free by Thinkbox), refines that single ratio into a range that flexes by sector, business model and brand life stage — narrowing toward 50:50 in some online categories and shifting further toward brand building in markets with high loyalty. No sector in that research recommends activation spend exceeding brand-building spend.
| Brand-building vs. activation split (IPA research) | Approx. share of budget |
|---|---|
| Average across categories studied (Binet & Field) | 60% brand / 40% activation |
| Some online / performance-heavy categories | Narrows toward 50% / 50% |
| High customer-loyalty categories | Shifts further toward brand building |
| Any category where activation should exceed brand spend | None found in the IPA's own data |
A live disagreement over what a result actually proves
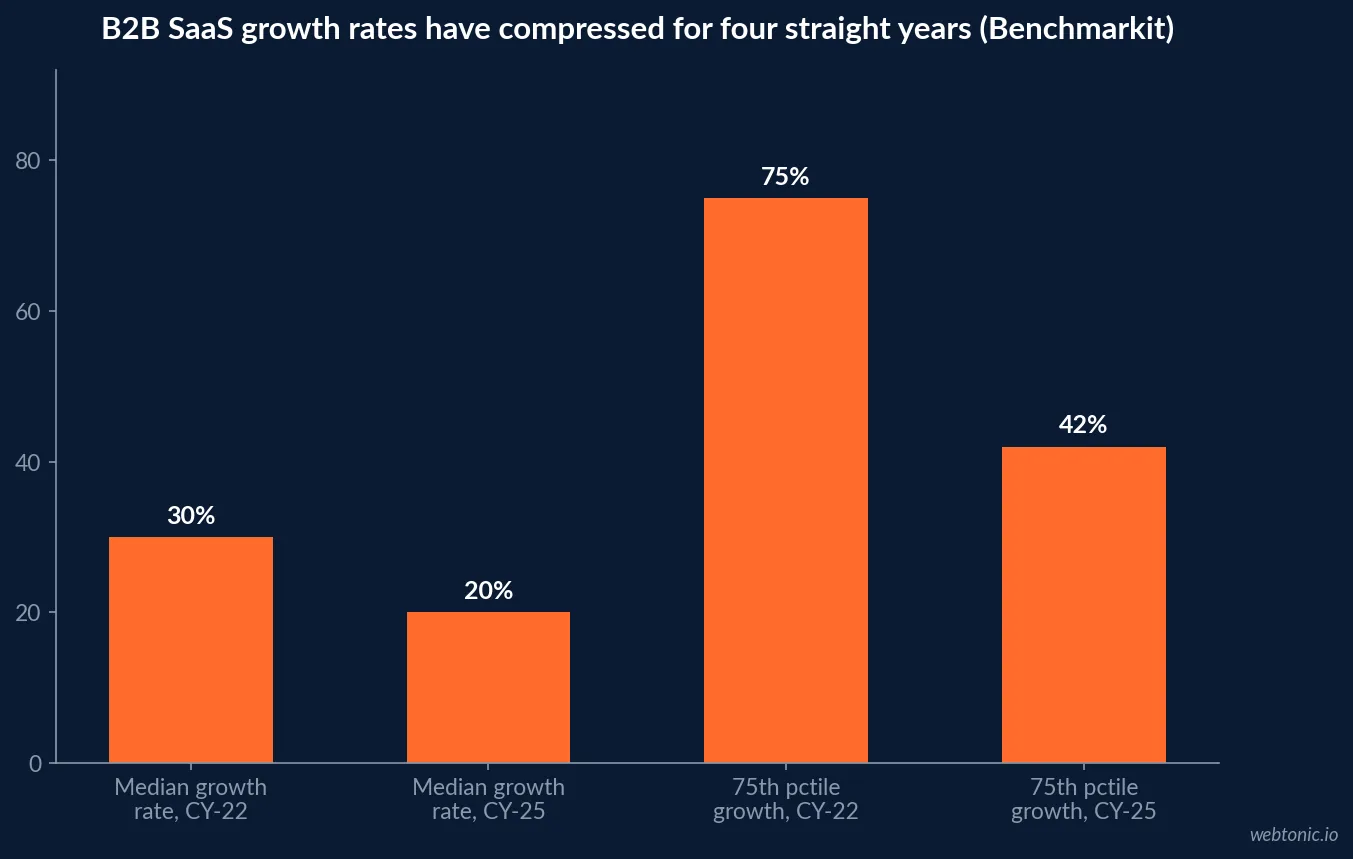
System1 and Effie's Creative Dividend report, built from 1,265 Effie Insights campaign submissions representing close to USD 140 billion in category revenue, claims that "creative quality and media support explain 60.1% of campaign business results." Byron Sharp, director of the Ehrenberg-Bass Institute, challenged that claim by name in Marketing Week: the underlying scatter chart shows a linear relationship, not the exponential one the report describes, and the analysis is vulnerable to selection bias, because big, important business initiatives simply attract bigger advertising budgets as a form of insurance — a correlation the report reads as causation.
The disagreement matters for anyone citing either claim: a headline percentage from an award-body dataset is not the same evidentiary standard as a controlled, peer-reviewed study, and the two camps' own researchers say so publicly about each other.
| Claim | Source | Published counter-argument |
|---|---|---|
| Creative quality explains 60.1% of results | System1 & Effie, Creative Dividend | Ehrenberg-Bass: chart is linear, not exponential |
| The relationship is exponential | System1 & Effie, Creative Dividend | Marketing Week: line of best fit is clearly linear |
| Bigger budgets always work harder | Implied by the correlation shown | Selection bias: big initiatives get insurance-sized budgets |
| 60:40 is a fixed universal split | Popular shorthand for Binet & Field | IPA's own follow-up shows a range, not a fixed ratio |
How much brands are actually spending, against that debate
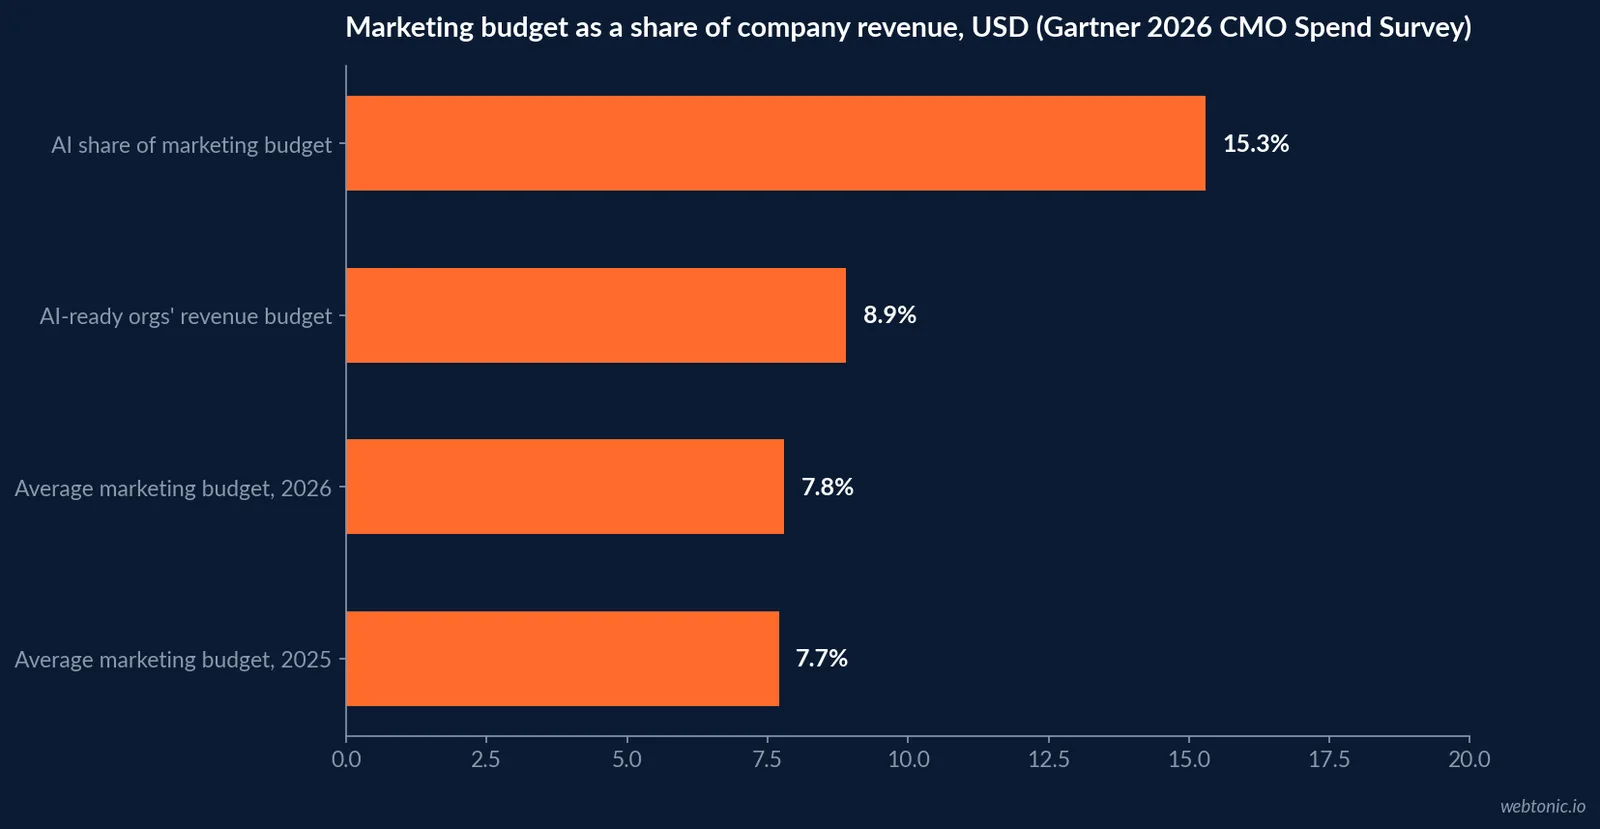
Gartner's 2026 CMO Spend Survey of 401 CMOs found marketing budgets sitting at 7.8% of company revenue in 2026, up marginally from 7.7% in 2025 — essentially flat, not the retreat some effectiveness commentary implies. 56% of CMOs say their organization's budget cannot deliver its 2026 strategy, and 54% report insufficient resources generally. At the same time, CMOs are allocating 15.3% of that flat budget to AI initiatives, even though only 30% report the organizational maturity to scale those AI investments effectively.
| Marketing budget reality (Gartner 2026 CMO Spend Survey) | Figure |
|---|---|
| Average marketing budget, % of company revenue, 2026 | 7.8% |
| Average marketing budget, % of company revenue, 2025 | 7.7% |
| Share of marketing budget allocated to AI | 15.3% |
| CMOs reporting AI maturity to scale that spend | 30% |
| CMOs saying budget can't deliver 2026 strategy | 56% |
Growth itself is getting harder to buy
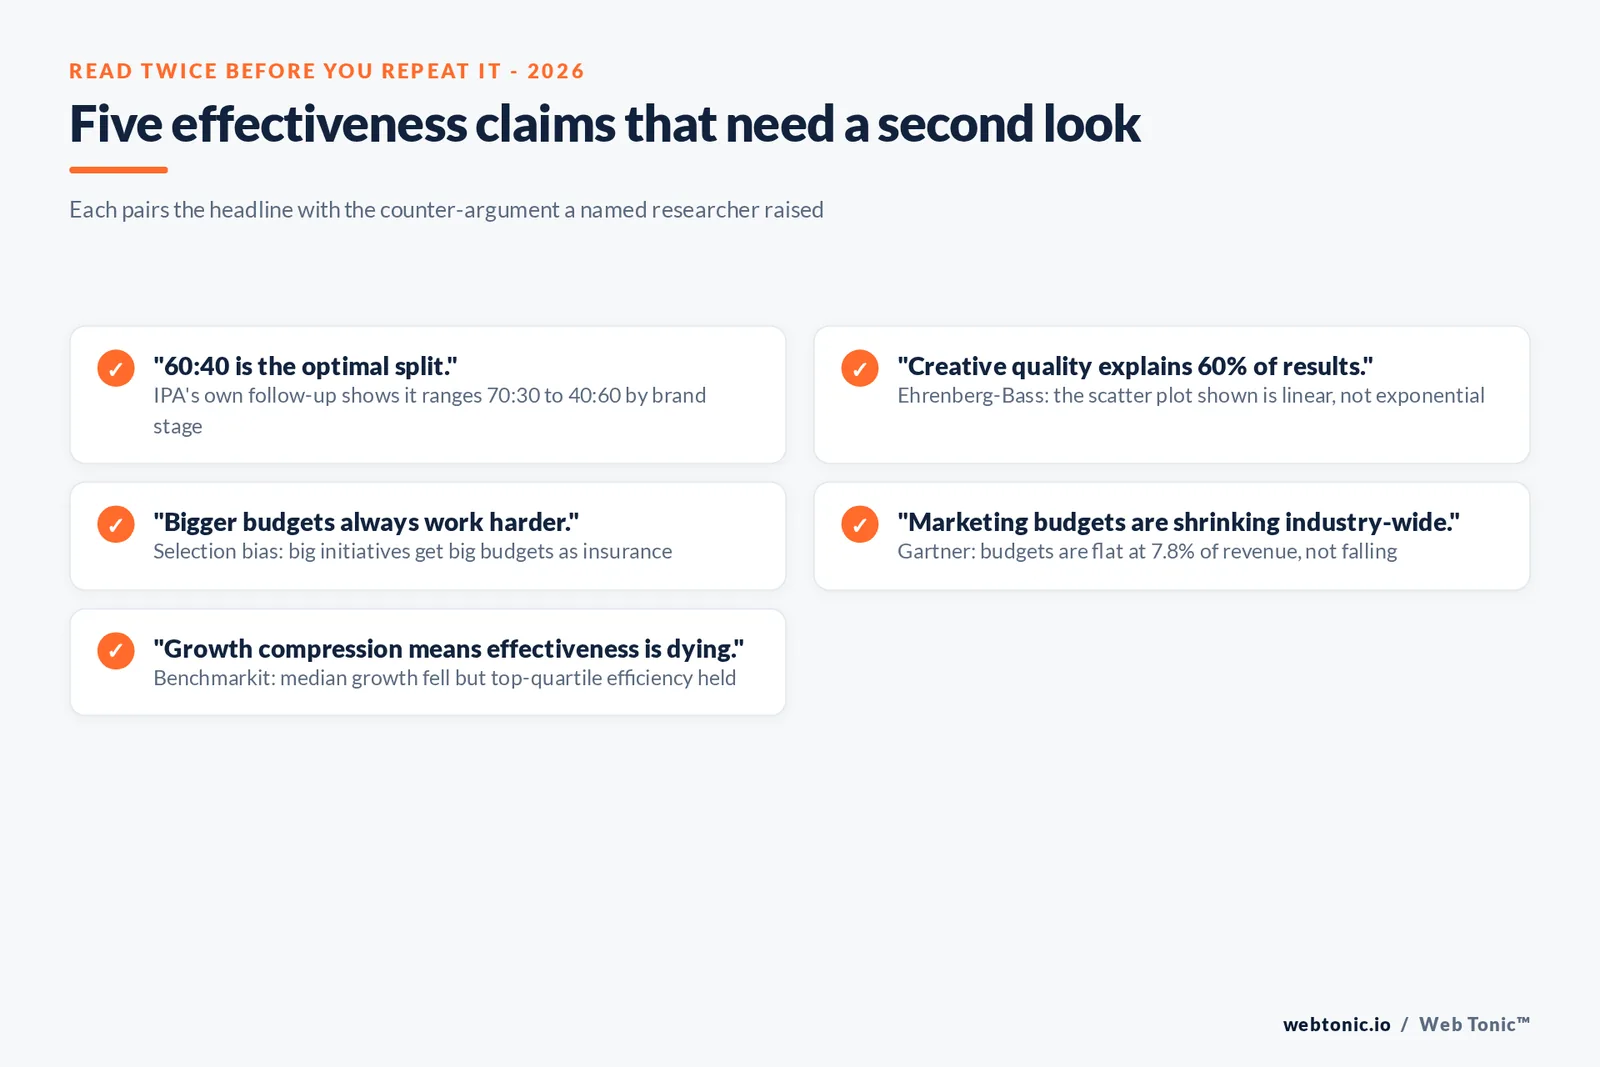
Benchmarkit's CY-2025 benchmarks, drawn from 342 B2B SaaS and AI-native companies, show median growth rates compressing from roughly 30% in CY-2022 to 20% in CY-2025, and 75th-percentile growth falling further, from 75% to 42% over the same window. That compression tracks funding conditions and market maturity more than it tracks marketing effectiveness directly — the same benchmark set shows CAC payback period improving 11% and LTV-to-CAC ratio climbing to a three-year high across the same period, which is the efficiency side of the ledger holding up even as top-line growth slows industry-wide.
How to read a "study of studies" without getting played
Every source in this piece is named, dated and checkable, and the two big claims still disagree with each other — which is the actual state of effectiveness research in 2026, not a failure of this page to find a single answer. Before repeating any effectiveness statistic in a board deck, check three things: whether the underlying dataset is award-submission data (self-selected toward the biggest, best-funded campaigns) or a controlled measurement; whether the claimed relationship is linear or the stronger "exponential" framing some reports prefer; and whether a rival researcher has published a public rebuttal, the way Byron Sharp did with the Creative Dividend report. All three checks take less time than the meeting where the number gets used.
| Check before citing an effectiveness statistic | What to look for |
|---|---|
| Dataset type | Award-submission data self-selects for big budgets; controlled studies don't |
| Shape of the claimed relationship | Linear correlation is common; exponential claims need real evidence |
| Named rebuttal exists? | The Creative Dividend report has one, in print, from Ehrenberg-Bass |
| Time horizon stated? | Short-term activation and long-term brand effects measure different things |
| Budget context given? | 7.8% of revenue (Gartner 2026) is the honest baseline, not a guess |
Where the spend goes when budgets tighten
Hinge Marketing's 2026 High Growth Study shows the split beneath Gartner's flat industry average: firms growing 20% or more annually for three straight years spend 12% of revenue on marketing, more than double the 5% spent by no-growth firms, against a broad market benchmark of 8%. No-growth firms did not just spend less — they held their budget flat year over year while revenue kept declining, the exact pattern effectiveness research predicts for brands that starve the long-term brand-building half of the 60:40 split first when money gets tight.
| Marketing spend as % of revenue, by growth tier (Hinge 2026) | Figure |
|---|---|
| High-growth firms (20%+ annual growth, 3 yrs) | 12% |
| Broad market benchmark | 8% |
| No-growth firms (flat or declining revenue) | 5% |
| High-growth spend vs. no-growth spend | 2.4x more |
What the disagreement means for your own scorecard
Treat any single "explains X% of results" claim as a hypothesis worth checking against your own data, not a settled fact — the researchers behind the two biggest competing claims in this space do exactly that to each other in public. Keep a brand-building line in the budget even when the quarter is tight, because every source cited here agrees direction if not magnitude: activation spend without brand spend behind it decays faster than the reverse. Our data and analytics practice builds effectiveness measurement from a client's own sales and retention data specifically so a single award-body dataset never has to carry the whole argument.
If the budget conversation is heading toward channel allocation next, see our performance creative practice or our guide to building a paid search strategy, or talk to us directly.
Frequently Asked Questions
What is the difference between marketing effectiveness and marketing efficiency?
Efficiency asks what a channel or campaign cost per outcome; effectiveness asks whether the activity moved the business at all, over what time horizon. The IPA's long-running Effectiveness in Context research, built from the IPA Effectiveness Awards Databank, frames this as two distinct advertising effects: a fast, rational, sales-driving effect and a slower, emotional, equity-building one. A campaign can be highly efficient on a short-term cost-per-click basis while contributing almost nothing to the long-term effect that protects pricing power and lowers acquisition cost later.
Is the 60:40 rule for brand versus activation spend still the standard in 2026?
As a rule of thumb, yes, but the IPA's own later work narrows the range rather than fixing one number. Les Binet and Peter Field's original IPA analysis found roughly 60% of budget on long-term brand building and 40% on short-term activation maximizes combined profit gain across the categories studied. Their follow-up report, Effectiveness in Context, shows that ratio shifting by sector, business model, and brand life stage - toward 50:50 in some online categories and further toward brand building for high-loyalty markets. There is no sector in the IPA's own data where activation spend should exceed brand-building spend.
Does creative quality really explain most of a campaign's business result?
That specific claim is contested by name, which is itself useful context. System1 and Effie's Creative Dividend report, drawn from 1,265 Effie Insights campaign submissions worth nearly USD 140 billion in category revenue, states that creative quality and media support together explain 60.1% of campaign business results. Byron Sharp, director of the Ehrenberg-Bass Institute, publicly challenged that framing in Marketing Week, arguing the underlying scatter chart shows a linear relationship (not the exponential one claimed) and that the analysis suffers from selection bias, since bigger business initiatives simply get bigger ad budgets as a form of insurance.
Are marketing budgets actually shrinking in 2026, based on effectiveness research?
No - they are essentially flat, not falling, though the story varies sharply by growth tier. Gartner's 2026 CMO Spend Survey of 401 CMOs found marketing budgets at 7.8% of company revenue in 2026, up only slightly from 7.7% in 2025, with 56% of CMOs saying their budget cannot deliver their 2026 strategy. Hinge Marketing's 2026 High Growth Study shows the split beneath that average: firms growing 20% or more annually spend 12% of revenue on marketing, while no-growth firms spend just 5% and kept that figure flat while revenue declined.
If growth rates are compressing industry-wide, does that mean marketing has stopped working?
The compression is real but it is not evidence that marketing effectiveness has collapsed. Benchmarkit's CY-2025 benchmarks show median B2B SaaS growth rates falling from roughly 30% in CY-2022 to 20% in CY-2025, and 75th-percentile growth falling from 75% to 42% over the same window - a market-wide slowdown tied to funding and macro conditions. At the same time, the same dataset shows CAC payback period improving 11% and LTV-to-CAC ratio climbing to a three-year high, which is the efficiency side of effectiveness holding up even as top-line growth slows.
Sources
IPA / Les Binet & Peter Field - Effectiveness in Context
Thinkbox - Effectiveness in Context, free download
System1 Group - creator and effectiveness research hub
Marketing Week - Byron Sharp on the Creative Dividend report
Business Wire - Gartner 2026 CMO Spend Survey findings
Benchmarkit - 2026 B2B SaaS and AI-Native Performance Benchmarks (CY-2025)
Hinge Marketing - Is your marketing budget too high? (2026 High Growth Study)


