



Table of contents

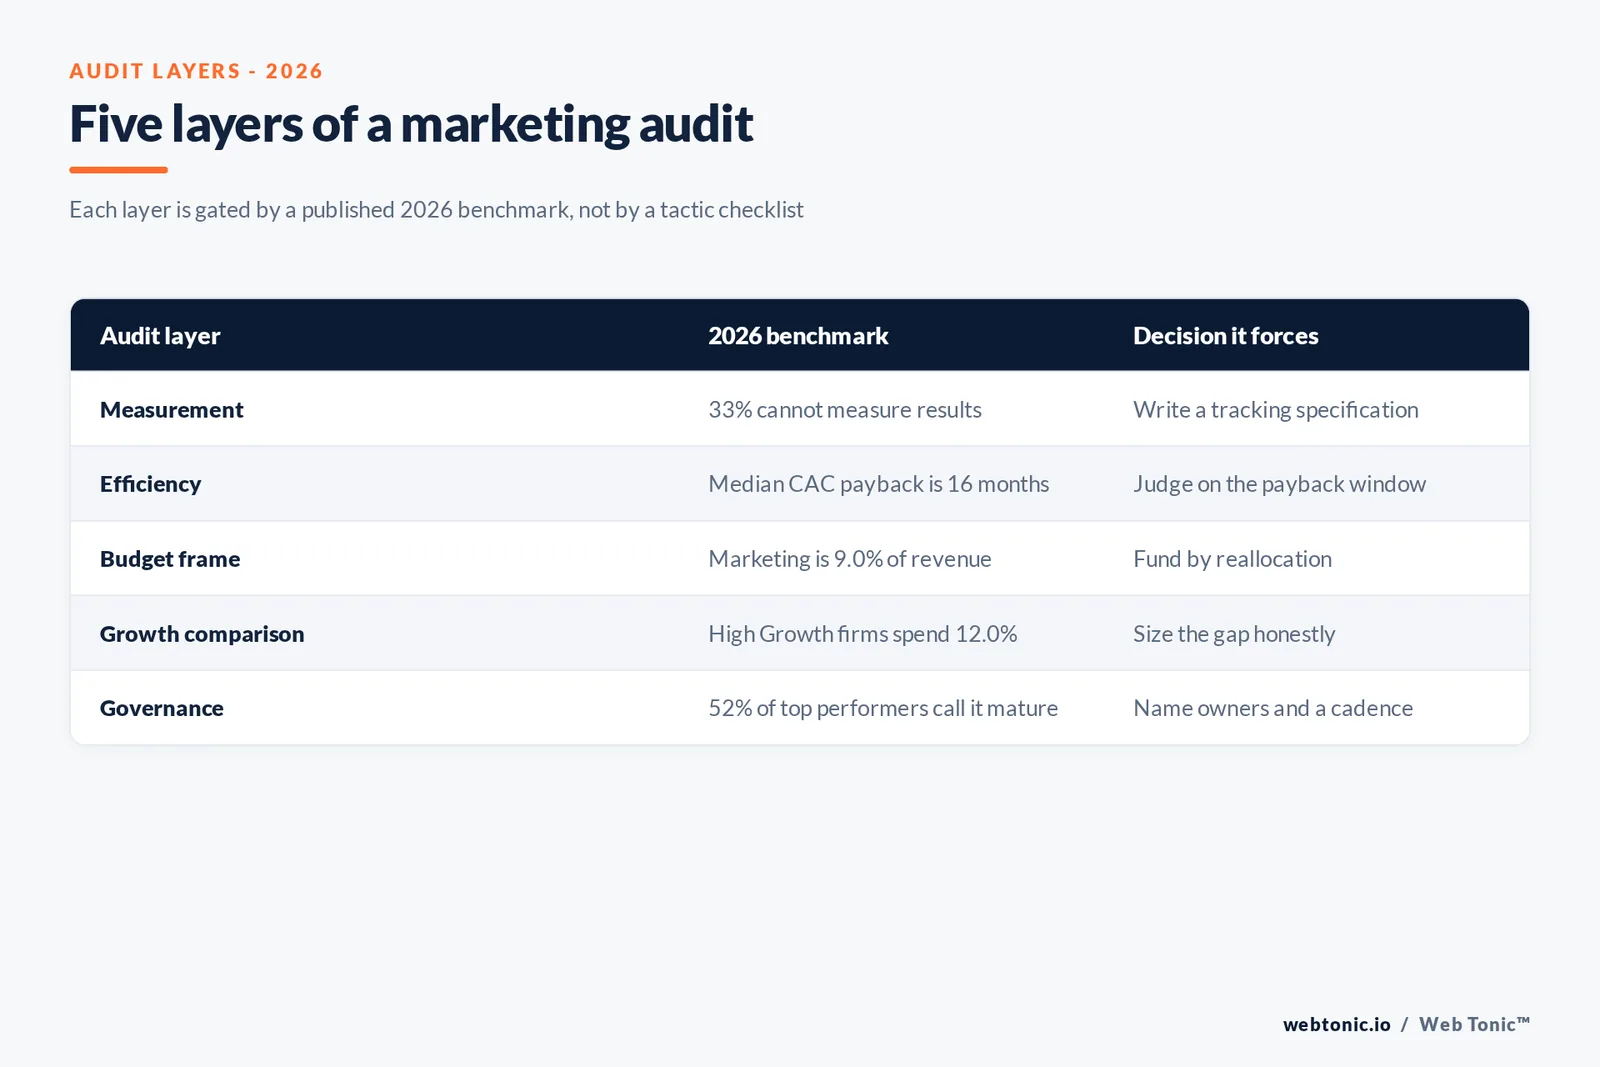
A third of B2B marketers say they cannot measure results properly, and no marketing technology capability in the 2026 data scores above 4.9 out of 7. That is what a marketing audit is really for: proving the baseline before anyone argues about tactics. Here are the benchmarks and KPIs worth auditing against this year.
Key Takeaways
- 33% of B2B marketers name measuring results as a challenge prompting action.
- 39% cite resources and 40% cite prompting action itself.
- Only 13% say effectiveness improved significantly year on year.
- 97% report having a content strategy, yet 52% call governance mature.
- Median CAC payback is 16 months, improved from 18.
- The top quartile recovers acquisition cost in 6 months or less.
- Fastest-growing companies pay back in 10 months against 18.
- Demonstrating technology ROI self-rates at 4.2 out of 7.
- Median professional services growth is 9.9%, the lowest since 2018.
- High Growth firms hold 39.5% profitability against 20.3%.
- High Growth firms spend 12.0% of revenue on marketing against 5.0%.
- 80% of firms run research; 20% run none at all.
- 70.6% of leaders report drifting toward short-term work.
The measurement gap is the headline finding
Every audit brief arrives asking about channels. The 2026 data says the binding constraint sits one level below that. The Content Marketing Institute's 2026 B2B research ranks the challenges prompting marketers to act: 40% prompting action, 39% resources, 33% measuring results, 28% producing enough quality content, 24% differentiation, 23% the buyer journey, 21% collaboration, 20% understanding audience needs and 16% developing a plan.
Read the list as a diagnostic order rather than a ranking. Differentiation and buyer-journey work cannot be judged without measurement, so an audit that starts anywhere other than the data layer is guessing with a template. The same research reports only 13% of marketers saw effectiveness improve significantly, with 48% improving somewhat and 30% flat.
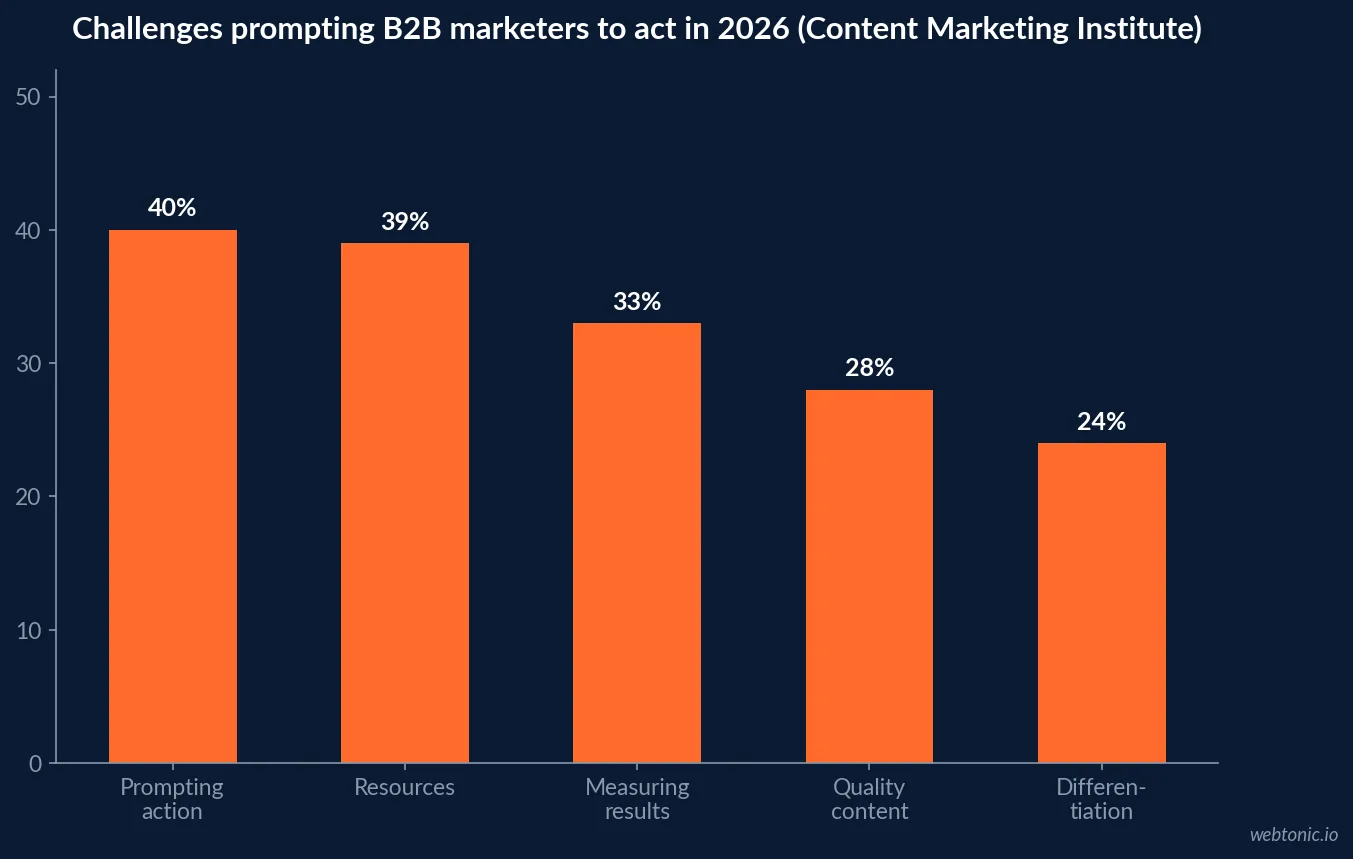
| Audit finding area | 2026 share of marketers | What the audit must produce |
|---|---|---|
| Prompting action from content | 40% | A decision list, not a scorecard |
| Resource constraints | 39% | Scope cut to funded capacity |
| Measuring results | 33% | A tracking specification and owner |
| Enough quality content | 28% | A realistic production rate |
| Differentiation | 24% | Positioning evidence, not adjectives |
| Buyer journey coverage | 23% | Stage-by-stage gap map |
The KPI set that survives scrutiny
A credible marketing audit separates KPIs that can be verified from platform-reported numbers that cannot be reconciled. The reconciliation test matters because The CMO Survey's 2026 report shows marketing leaders rating their own capabilities below the midpoint of usefulness: 4.9 for selecting vendors, 4.8 for integrating systems, 4.8 for using data tactically, 4.5 for generating technology ROI, 4.2 for demonstrating it, 3.9 for training and 3.7 for hiring, on a seven-point scale, with none above 5 and no movement since 2024.
In practice that means the audit should insist on a single source of truth for revenue-linked metrics, and treat channel dashboards as directional. Our data intelligence work starts at exactly this point for the same reason.
| KPI | Auditable source | Common failure in the data |
|---|---|---|
| Customer acquisition cost | Finance plus ad platform spend | Spend excludes agency and tooling |
| CAC payback period | Gross margin from finance | Margin taken from the best product only |
| Marketing qualified leads | CRM stage definitions | MQL to SQL conversion never defined |
| Return on ad spend | Platform plus order data | Platform-reported conversions double-counted |
| Pipeline contribution | Attribution model in the CRM | Model changed mid-period |
| Net promoter score | Survey instrument | Sampled only from happy accounts |
Payback benchmarks: the number that settles arguments
Efficiency debates end quickly once a payback window is on the table. Benchmarkit's CY-2025 benchmark data puts median CAC payback at 16 months, an improvement from 18 months - an 11% gain - with the strongest quartile at 10 months, the weakest at 24 and the top performers at six months or less. The fastest-growing companies recovered acquisition cost in 10 months against 18 for slower growers.
For an audit, the payback window is also a timing rule. Judging a programme that has run for two quarters against a 16-month median is not analysis, it is impatience - and it is how working channels get switched off early.
| Payback benchmark | Months | Audit interpretation |
|---|---|---|
| Top performers | 6 or less | Scale before optimising |
| Strong quartile | 10 | Efficient; check capacity limits |
| Median | 16 | Normal; judge on trend |
| Weak quartile | 24 | Fix margin or targeting first |
| Fastest growers | 10 | Growth follows recovery speed |
| Slower growers | 18 | Payback lags growth, not the reverse |
What thought leadership is measured on
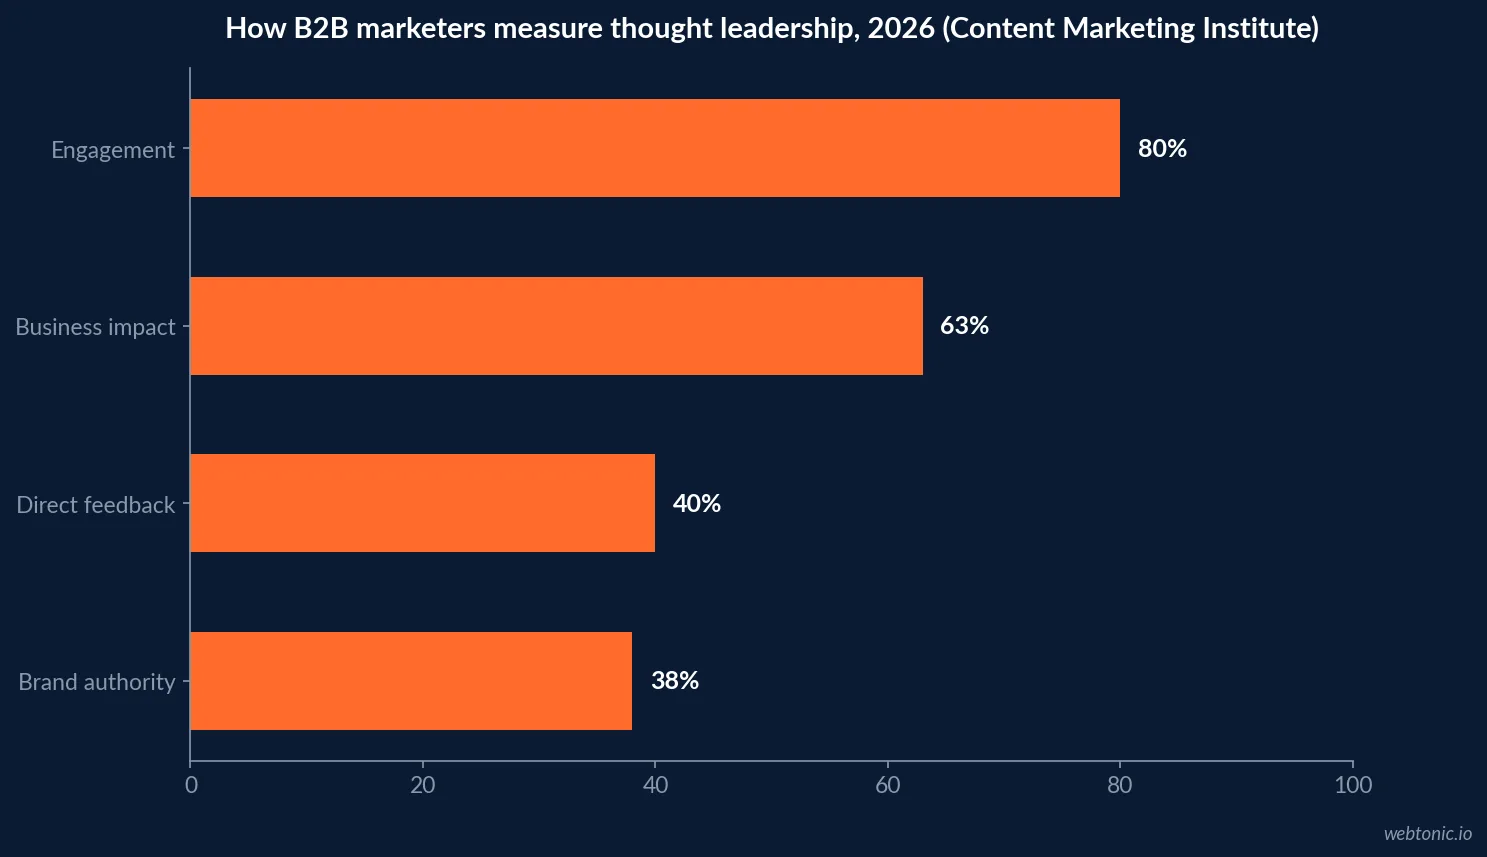
Brand-level KPIs are where audits usually go soft. The CMI 2026 research gives usable shares: marketers measure thought leadership by engagement at 80%, business impact at 63%, direct feedback at 40% and brand authority at 38%. That ordering is diagnostic - engagement is measured most because it is easiest, and business impact is measured least despite being the reason the work is funded.
An audit should push at least one brand metric onto a revenue-linked definition. Otherwise the brand section of the report becomes unfalsifiable, which is how large budgets survive without evidence.
Growth cohorts, and what separates them
Hinge's High Growth Study 2026 reports median growth of 9.9%, the lowest reading since 2018, split into 36.6% for High Growth firms, 8.5% for Average Growth and -11.4% for No Growth. Profitability follows: 39.5%, 29.6% and 20.3%. The behavioural differences are the auditable part - High Growth firms spend 12.0% of revenue on marketing against 5.0% at No Growth firms, referrals supply 39.5% of leads and outreach 23.5%, and 80% of firms conduct research, most often competitive research at 46.1% and client or marketplace research at 45.2%, while 20% conduct none.
One trend deserves a flag in any audit of organic performance: the share of firms doing SEO and keyword research fell from 33.5% to 27.0%. If a competitor set has quietly stopped investing there, the gap is cheaper to close than it was.
| Cohort | Median growth | Profitability | Marketing spend as % of revenue |
|---|---|---|---|
| High Growth | 36.6% | 39.5% | 12.0% |
| Average Growth | 8.5% | 29.6% | Between the two |
| No Growth | -11.4% | 20.3% | 5.0% |
| All firms (median) | 9.9% | Not reported | Not reported |
Budget context an audit has to state
Benchmarks are meaningless without the budget frame. The CMO Survey 2026 puts marketing budgets at 9.0% of company revenue and 9.6% of total company budgets, with spend growth of 1.7%, headcount growth down 50% year on year and training cut to 3.8% of marketing spend from a pre-pandemic 5.8%. Allocation splits 68% to present and 32% to future needs, with 70.6% reporting a shift toward short-term work and 47.1% returning to established markets.
Those figures are why so many audits recommend consolidation rather than expansion. When training and headcount are both compressed, a plan that adds channels adds risk. We apply the same test before recommending new channel work in growth marketing engagements.
| Budget benchmark | 2026 figure | Audit consequence |
|---|---|---|
| Marketing as % of revenue | 9.0% | Compare before calling spend low |
| Marketing as % of total budgets | 9.6% | Frames internal negotiation |
| Marketing spend growth | 1.7% | Reallocation beats requests |
| Headcount growth change | Down 50% year on year | Assume no new hires |
| Training share of spend | 3.8% | Recommend fewer, deeper tools |
| Present versus future split | 68% / 32% | Protect the 32% explicitly |
A KPI dashboard that reflects the 2026 constraints
Most dashboards fail because they mix metrics on different reporting delays into one view. A dashboard built for audit follow-through separates them: daily operational metrics, monthly efficiency metrics and quarterly strategic KPIs, each with a named owner. The CMO Survey's 4.8 out of 7 rating for using data tactically is the honest reason for that separation - real-time data is abundant and real-time interpretation is not.
For paid channels specifically, the reconciliation habit matters more than the visualisation. Our Google Ads strategy guide covers the same discipline at channel level.
| Dashboard layer | Cadence | Example KPI | Owner |
|---|---|---|---|
| Operational | Daily | Spend pacing and click rate | Channel manager |
| Efficiency | Monthly | CAC and cost per qualified lead | Marketing lead |
| Commercial | Monthly | MQL to SQL conversion | Sales and marketing jointly |
| Strategic | Quarterly | CAC payback and LTV to CAC ratio | Finance and marketing |
| Brand | Quarterly | Share of voice and net promoter score | Marketing lead |
Where AI changes the KPI conversation
Adoption is now high enough to affect benchmarks. The CMO Survey 2026 reports AI use rising from 13.1% to 24.2% of marketing activities, generative AI from 7.0% to 22.4%, a 220% increase, with a projection of 55.9% within three years and 41.5% already working on generative engine optimisation. Application splits content creation 73.9%, personalisation 65.4%, automation 48.9%, analysis 46.3% and targeting 45.2%. HubSpot's State of Marketing adds that 61% call this marketing's biggest disruption in 20 years, with 80% using AI for content and 75% for media production.
For KPIs, the effect is volume inflation. Output metrics rise while the number that matters - cost per qualified outcome - often does not move. An audit run in 2026 should explicitly test whether extra production translated into pipeline or only into published assets.
Limits of the benchmark data
Benchmarks are context, not verdicts. Three caveats belong in every audit report. First, sample composition differs: the payback data is SaaS-weighted, the growth cohorts are professional services, and the CMO Survey skews to large US firms. Second, medians hide distribution - a 16-month median payback contains both six-month and 24-month realities. Third, self-reported capability scores measure confidence as much as competence.
The practical rule: use benchmarks to size a gap, use your own trailing twelve months to decide whether it is closing. If the two disagree, the internal trend wins. When neither exists yet, the first audit deliverable is a measurement plan - that is the honest starting point for a programme with no reliable history.
| Benchmark source | Population | Use it for | Do not use it for |
|---|---|---|---|
| Benchmarkit CY-2025 | SaaS companies | Payback and efficiency framing | Retail or local services |
| Hinge High Growth 2026 | Professional services firms | Growth and spend ratios | Ecommerce comparisons |
| The CMO Survey 2026 | Mostly large US firms | Capability and budget context | Small business norms |
| CMI B2B 2026 | B2B content marketers | Content and measurement gaps | Brand-only programmes |
Related reading
- AI Marketing Advisory Statistics: Benchmarks and KPIs
- Fractional Head of Growth Statistics: Benchmarks and KPIs
- Marketing Team Structure Statistics: Benchmarks and KPIs
- Marketing Strategy Consulting services at Web Tonic
Frequently Asked Questions
Which KPIs should a marketing audit actually check?
Start with the ones the 2026 research says teams cannot evidence rather than the ones that are easy to screenshot. In the Content Marketing Institute's 2026 B2B research, 33% of marketers name measuring results as a challenge prompting action and 39% cite resources, while only 13% report that effectiveness improved significantly. A useful audit therefore verifies acquisition cost, payback period, pipeline contribution and channel attribution before it looks at engagement rate or share of voice, because the latter cannot be corrected if the former are wrong.
What is a reasonable payback benchmark to audit against?
Benchmarkit's CY-2025 SaaS benchmark data puts median customer acquisition cost payback at 16 months, improved from 18 months, with the top quartile at six months or better, the best-performing quartile of companies at 10 months and the weakest at 24 months. The fastest-growing companies recovered acquisition cost in 10 months against 18 for slower growers. Those numbers are the correct frame for judging whether a programme is inefficient or simply young.
How often do companies audit their marketing?
There is no single published cadence, but the governance data is a fair proxy. The Content Marketing Institute's 2026 research found 97% of B2B marketers have a content strategy, yet only 52% of the highest-performing group describe their governance as mature. The CMO Survey 2026 adds that 71% of leaders call agility a key capability while 70.6% report shifting toward short-term work under pressure - a combination that argues for a quarterly review of measurement and an annual full audit.
Can a marketing audit fix attribution?
It can expose the gap and specify the fix; it cannot create data that was never collected. The CMO Survey's 2026 self-ratings show marketing leaders rating their ability to demonstrate technology return at 4.2 out of 7 and their ability to generate it at 4.5, with no capability in the set scoring above 4.9. An audit that ends with a tracking specification, a single source of truth and named owners is doing the useful part of the job.
What separates high-growth companies on these KPIs?
Hinge's High Growth Study 2026 reports median growth of 9.9%, the lowest since 2018, with High Growth firms at 36.6% and No Growth firms at -11.4%. Profitability tracks the same line: 39.5% at High Growth firms against 20.3% at No Growth firms. High Growth firms also spend 12.0% of revenue on marketing against 5.0%, and 80% of firms conduct research, most often competitive research at 46.1%.
Sources
Content Marketing Institute - B2B Content Marketing Trends 2026
The CMO Survey - Highlights and Insights Report 2026
Benchmarkit - CY-2025 B2B SaaS Performance Metrics Benchmarks
Hinge Research Institute - High Growth Study 2026
HubSpot - State of Marketing


