



Table of contents

Marketing technology has fallen to 19.4% of marketing budgets, a five-year low, while generative AI use jumped 220% in a year. A 2026 tooling audit is therefore about consumption, ownership and integration - not about a shortlist. Here is the adoption data to audit against.
Key Takeaways
- Martech is 19.4% of marketing budgets, down from 26.6% in 2021.
- 62% of leaders still plan to invest more in technology.
- 56% have shifted to consumption-based pricing against 9% cutting.
- 41% have introduced real-time usage controls.
- 24% are overhauling their marketing systems.
- Only 9% call themselves fully AI-optimised; about 21% are mature.
- AI now touches 24.2% of marketing activities, up from 13.1%.
- Generative AI rose from 7.0% to 22.4%, a 220% increase.
- Teams project 55.9% of activities using AI within three years.
- 41.5% are already working on generative engine optimisation.
- Barriers: resourcing 22.3%, architecture 19.1%, bandwidth 14.1%.
- 35.7% name AI capability gaps specifically.
- Training is down to 3.8% of marketing spend from 5.8%.
Budgets are shrinking while ambition grows
Gartner's 2026 CMO Spend Survey findings put marketing technology at 19.4% of the marketing budget, a five-year low against 26.6% in 2021, while 62% of leaders intend to invest more. The reconciliation is pricing: 56% have moved to consumption-based models against 9% cutting spend, 41% have introduced real-time usage controls and 24% are overhauling their systems. Only 9% describe themselves as fully AI-optimised, with about 21% mature.
For an audit, consumption pricing changes the deliverable. A licence count is no longer the exposure - forecast usage is. Any tooling section written without a usage forecast and a cap is incomplete this year.
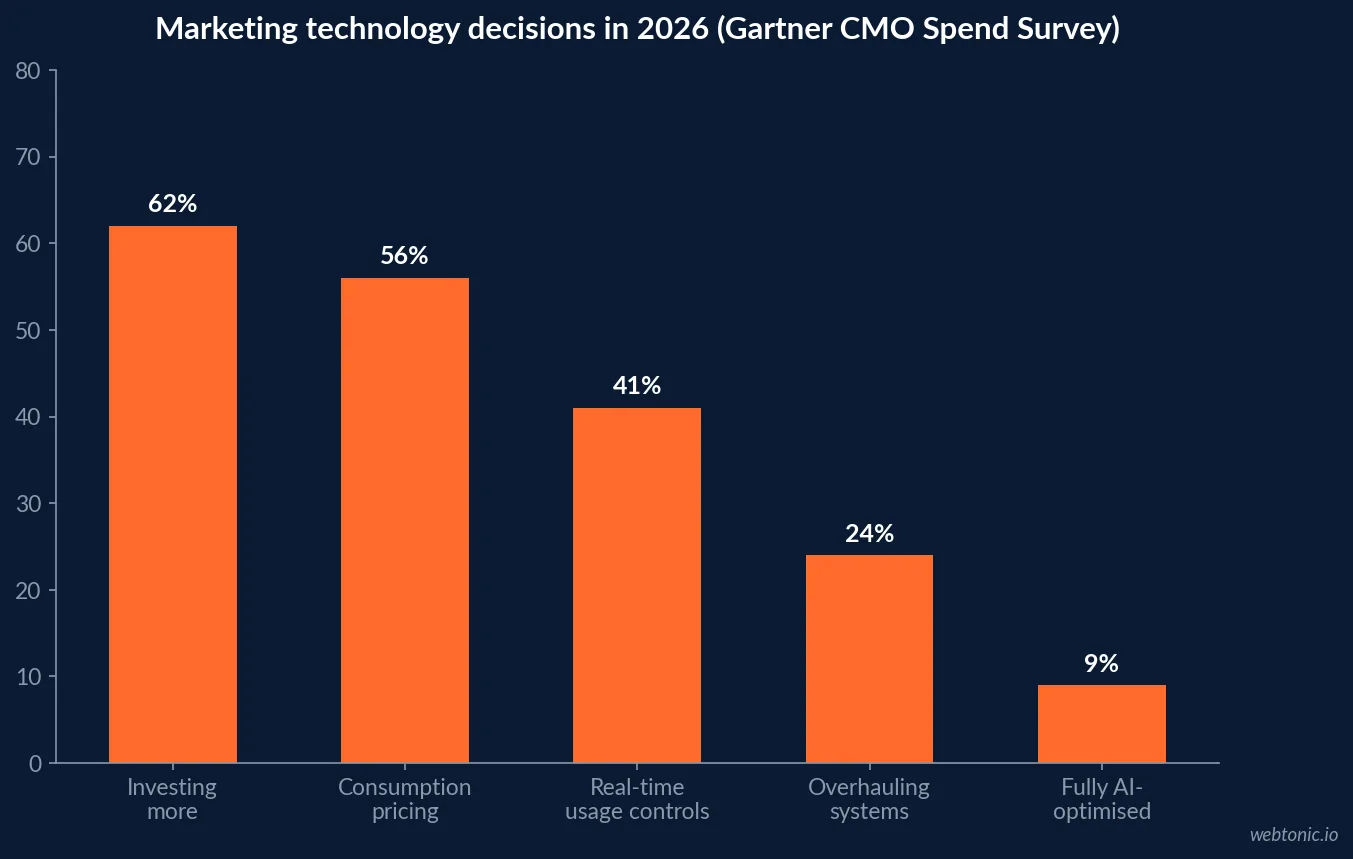
| Tooling signal | 2026 figure | Audit action it triggers |
|---|---|---|
| Martech share of budget | 19.4% | Compare against your own ratio |
| Peak martech share | 26.6% in 2021 | Consolidation is the trend, not growth |
| Planning to invest more | 62% | Expect renewal pressure |
| Consumption-based pricing | 56% | Forecast usage and set a cap |
| Real-time usage controls | 41% | Instrument usage before renewal |
| Fully AI-optimised | 9% | Treat maturity claims sceptically |
Capability, not licences, is the constraint
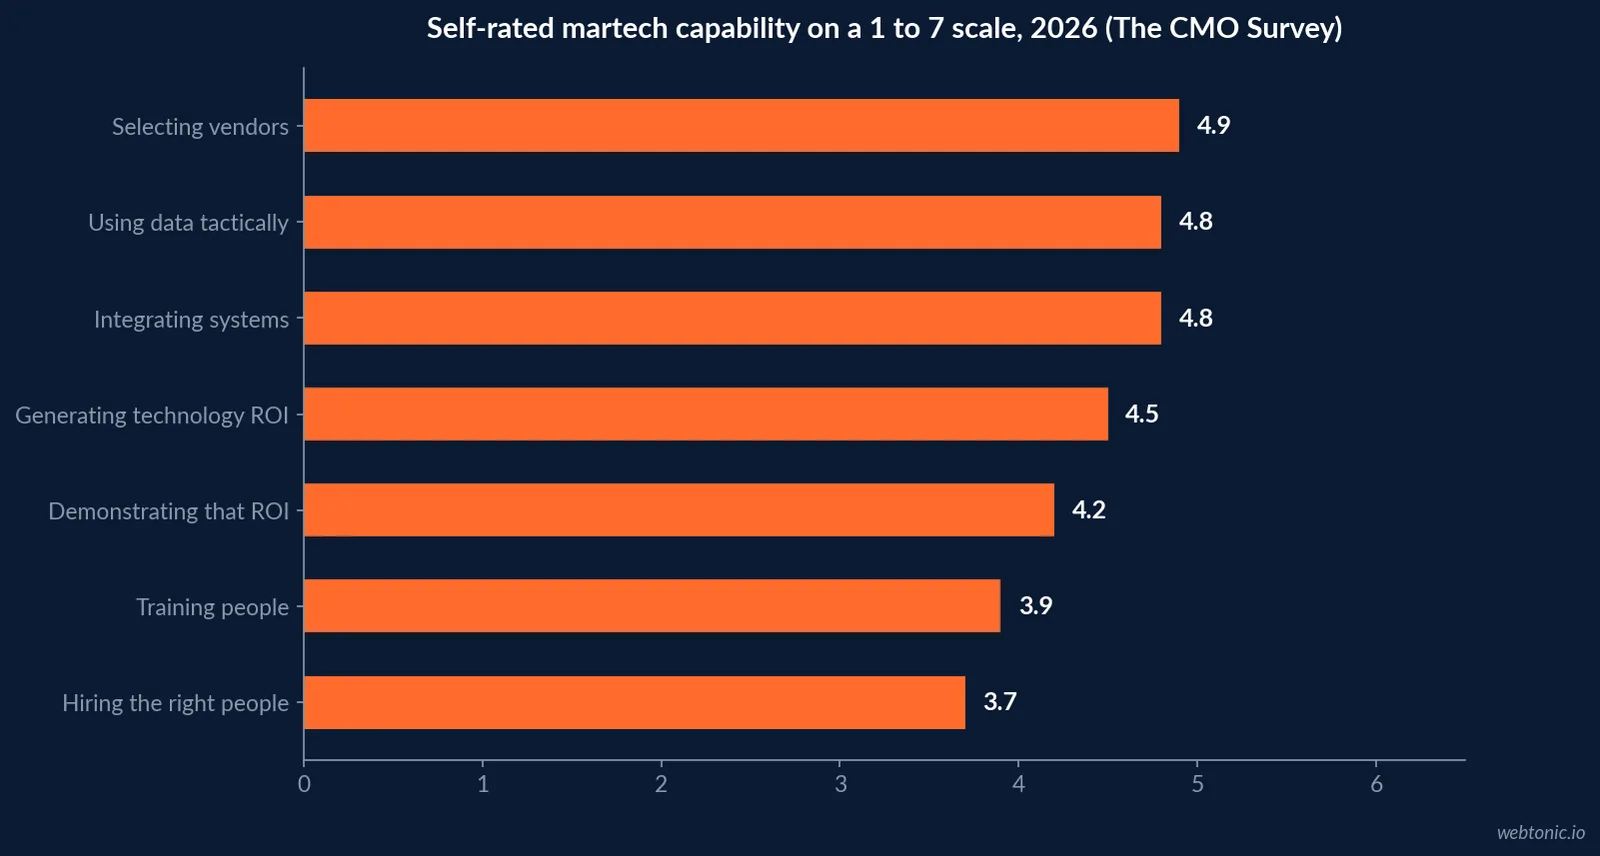
The CMO Survey 2026 asked marketing leaders to rate their own martech capabilities on a seven-point scale. The results: selecting vendors 4.9, using data tactically 4.8, integrating systems 4.8, generating technology ROI 4.5, demonstrating that ROI 4.2, training people 3.9 and hiring the right people 3.7. Nothing scores above 5 and the set has not moved since 2024.
The shape of that list is the finding. Buying is the strongest capability and proving value is among the weakest, which is a reliable recipe for stack sprawl. An audit that recommends purchases without addressing the bottom three ratings will reproduce the problem it was hired to fix. Our data intelligence work deliberately starts with the measurement layer for that reason.
| Capability | Self-rating out of 7 | Audit implication |
|---|---|---|
| Selecting vendors | 4.9 | Buying is not the weak link |
| Using data tactically | 4.8 | Real-time data outruns interpretation |
| Integrating systems | 4.8 | Document the integration path |
| Generating technology ROI | 4.5 | Tie tools to a funded outcome |
| Demonstrating that ROI | 4.2 | Fix measurement before renewal |
| Training people | 3.9 | Budget hours, not just licences |
| Hiring the right people | 3.7 | Assume no new specialist hires |
AI adoption, in numbers you can audit against
The CMO Survey 2026 puts AI use at 24.2% of marketing activities, up from 13.1%, and generative AI at 22.4%, up from 7.0% - a 220% increase, with a projection of 55.9% of activities within three years and 41.5% of teams already working on generative engine optimisation. Application splits content creation 73.9%, personalisation 65.4%, automation 48.9%, analysis 46.3% and targeting 45.2%. HubSpot's State of Marketing reports 61% calling this the biggest disruption in 20 years, with 80% using AI for content and 75% for media production.
The audit test is not adoption, it is attribution of benefit. Output volume rises first; cost per qualified outcome moves only if the measurement layer can see it. Ask for the before-and-after on cost per qualified lead, not on assets published.
| AI application | Share of teams | What to verify in an audit |
|---|---|---|
| Content creation | 73.9% | Quality control and review ownership |
| Personalisation | 65.4% | Consent basis and data source |
| Automation | 48.9% | Failure handling when a workflow breaks |
| Analysis | 46.3% | Whether outputs are reconciled |
| Targeting | 45.2% | Audience overlap and exclusions |
| Generative engine optimisation | 41.5% | Whether visibility is measured at all |
What actually blocks adoption
The CMO Survey 2026 ranks the barriers: resourcing 22.3%, systems architecture 19.1%, bandwidth 14.1% and talent management 13.1%, with 35.7% naming AI capability gaps specifically. Alongside that, training has fallen to 3.8% of marketing spend from a pre-pandemic 5.8% and headcount growth is down 50% year on year.
Three of the four barriers are resourcing in different clothing. That is why the most valuable output of a tooling audit is usually a shorter stack with named owners, not a better-specified purchase.
| Barrier | Share of marketers | Cheapest fix |
|---|---|---|
| Resourcing | 22.3% | Cut the stack to what is owned |
| Systems architecture | 19.1% | Document one integration path |
| Bandwidth | 14.1% | Sequence adoption, one tool a quarter |
| Talent management | 13.1% | Name an owner per system |
| AI capability gaps | 35.7% | Book training hours before licences |
Measurement is still the unresolved layer
The Content Marketing Institute's 2026 B2B research still finds 33% of marketers naming measurement as a challenge prompting action and 39% naming resources, with only 13% reporting significantly improved effectiveness and 52% of the highest performers describing governance as mature. That is the same story as the capability ratings, from a different sample.
A tooling audit that fixes measurement earns its fee twice: once by making the next purchase decision evidence-based, and once by making channel decisions - such as those in our Facebook Ads cost breakdown - defensible rather than anecdotal.
Consolidation is the default recommendation
With martech down to 19.4% of budget and 24% of organisations overhauling their systems, the realistic 2026 audit outcome is a shorter stack. The supporting numbers are unambiguous: marketing spend is growing at just 1.7%, budgets sit at 9.0% of company revenue and 9.6% of total company budgets, and headcount growth fell 50% year on year. Nothing in that picture funds parallel tools doing similar jobs.
Consolidation also improves the measurement layer for free. Every system removed is one less reconciliation problem, which matters when the ability to demonstrate technology return sits at 4.2 out of 7. The test we apply before keeping any platform in a growth marketing programme is whether a named person used it in the last 30 days to make a decision that changed spend.
| Consolidation test | Keep the tool if | Cut it if |
|---|---|---|
| Named owner | One person is accountable | Ownership is shared or vacant |
| Decision use | It changed a spend decision in 30 days | It only produces reports |
| Overlap | It does something nothing else does | Another system covers 80% of it |
| Integration | Data flows into the reporting layer | Numbers are exported by hand |
| Enablement | The team has been trained on it | Adoption sits with one person |
Small-business adoption looks different
Enterprise survey data over-represents large budgets, so it is worth stating the other end of the market. Constant Contact's Small Business Now report for Q1 2026 finds 68% of small businesses expecting marketing budgets to rise and 74% expecting to spend more time on marketing, with inflation the top concern at 41% against weak consumer spending at 19%.
For a smaller company the audit conclusion is usually the opposite of an enterprise one: fewer tools, one owner, and time protected rather than reallocated. Scope the review to the stack you actually operate rather than to a category map.
A five-layer adoption audit
The layers below are ordered by how expensive they are to fix later. Each is gated by a published figure rather than a preference, and each ends in a decision instead of an observation. Skipping a layer is how a stack review becomes a shopping list.
Used in this order, the review also produces the artefact a team can act on without the auditor present - which matters when the people who commissioned the audit change roles before the roadmap is finished.
| Layer | Gating 2026 statistic | Decision it forces |
|---|---|---|
| Consumption | 56% on consumption pricing | Forecast usage and cap it |
| Measurement | Demonstrating ROI rates 4.2 of 7 | Fix the baseline before buying |
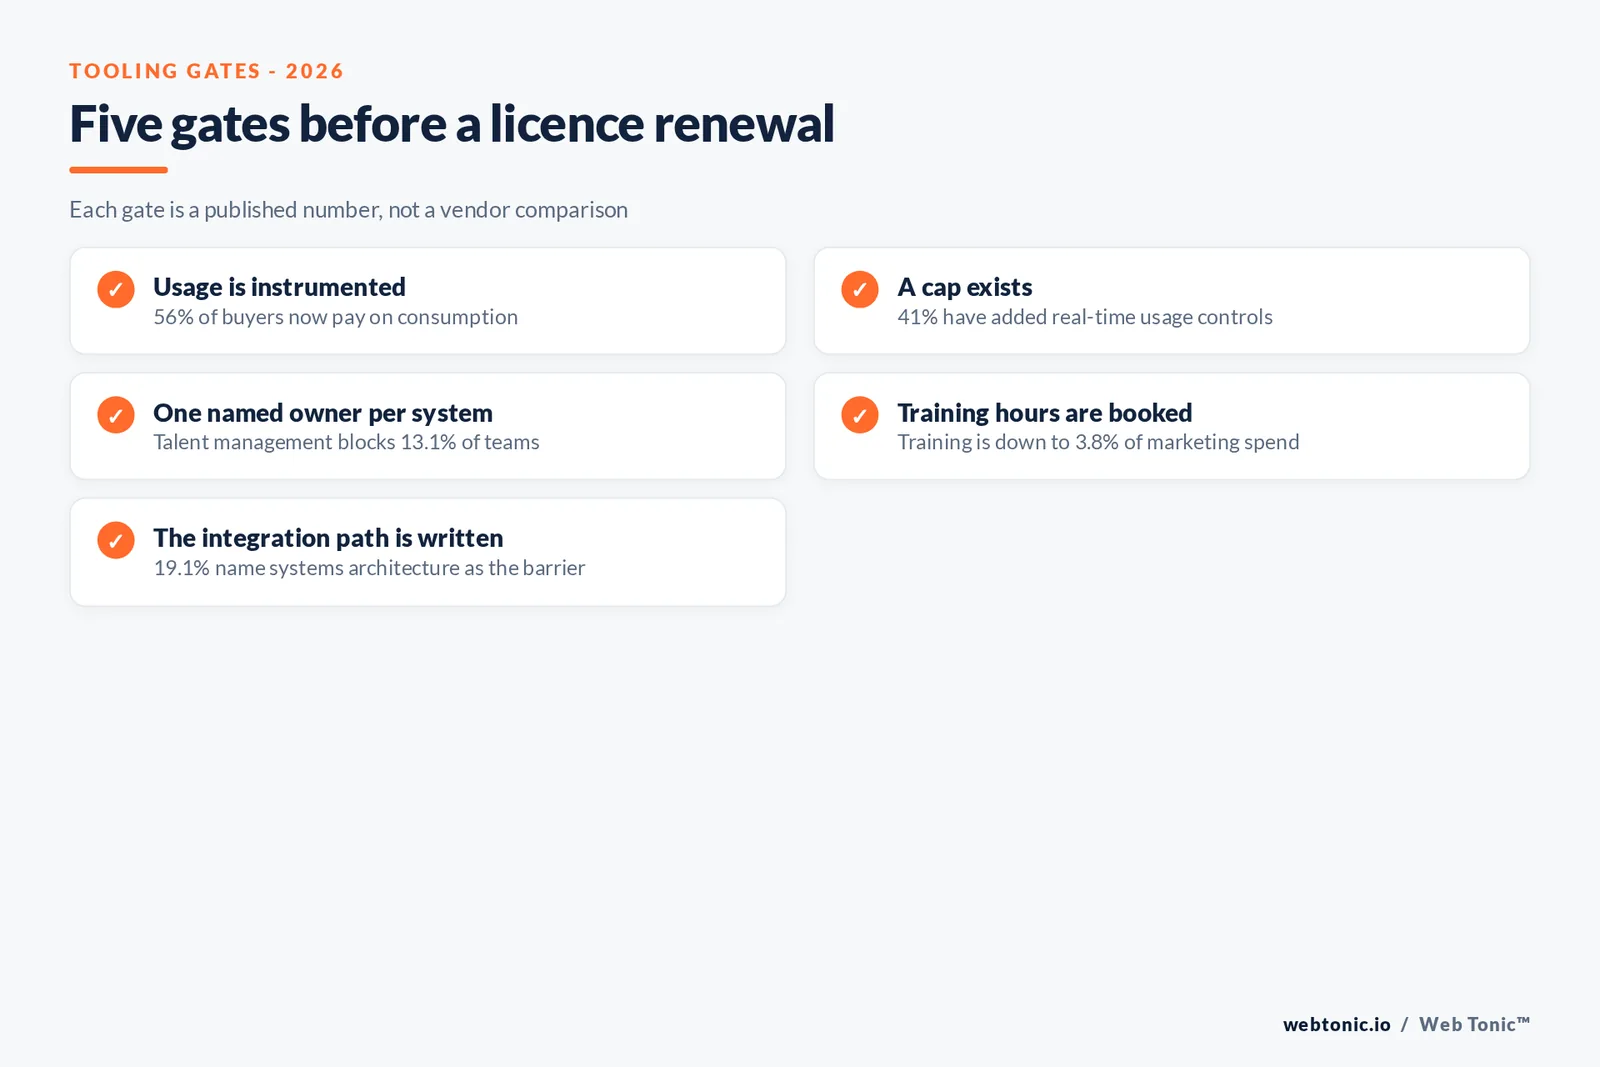
| Ownership | Talent management blocks 13.1% | Name one owner per system |
| Enablement | Training is 3.8% of spend | Book hours or cut scope |
| Architecture | 19.1% name systems architecture | Document the integration path |
Related reading
- Marketing Audit / Growth Audit — Tooling & Template Checklist
- Marketing Operations Consulting Statistics: Adoption and Tooling
- Marketing KPI Scorecard Statistics: Adoption and Tooling
- Marketing Strategy Consulting services at Web Tonic
Frequently Asked Questions
What should a tooling audit measure first?
Usage and ownership, not features. Gartner's 2026 CMO Spend Survey data shows martech down to 19.4% of marketing budgets - a five-year low against 26.6% in 2021 - while 62% of leaders plan to invest more and 56% have shifted to consumption-based pricing. With 41% introducing real-time usage controls, the audit question is which licences are being consumed and by whom, before any renewal or replacement decision.
How much of the stack is actually being used?
Utilisation is rarely published in a reliable form, so the audit has to measure it locally. The available capability data explains why it is usually low: The CMO Survey 2026 has marketing leaders rating integrating systems at 4.8 out of 7, generating technology ROI at 4.5, demonstrating that ROI at 4.2, training at 3.9 and hiring the right people at 3.7, with nothing above 4.9 and no improvement since 2024. Training has also been cut to 3.8% of marketing spend from 5.8% before the pandemic.
How fast is AI adoption changing the stack?
Quickly, in measurable steps. The CMO Survey 2026 reports AI applied to 24.2% of marketing activities, up from 13.1%, and generative AI at 22.4%, up from 7.0% - a 220% increase - with a projection of 55.9% within three years and 41.5% of teams already working on generative engine optimisation. Application splits content creation 73.9%, personalisation 65.4%, automation 48.9%, analysis 46.3% and targeting 45.2%.
What blocks adoption after purchase?
Resourcing rather than technology. The CMO Survey 2026 puts the barriers at 22.3% resourcing, 19.1% systems architecture, 14.1% bandwidth and 13.1% talent management, with 35.7% naming AI capability gaps specifically. Gartner's data adds the commercial dimension: only 9% of organisations describe themselves as fully AI-optimised and about 21% as mature, while 24% are overhauling their systems.
Does buying more tools improve measurement?
The evidence says no. Despite years of investment, the ability to demonstrate technology return still self-rates at 4.2 out of 7, unchanged since 2024, and 33% of B2B marketers still name measuring results as a challenge prompting action. A tooling audit that ends with fewer, better-owned systems and a documented integration path is more likely to move that number than an additional platform.
Sources
Chief Marketer - Gartner 2026 CMO Spend Survey findings
The CMO Survey - Highlights and Insights Report 2026
HubSpot - State of Marketing
Content Marketing Institute - B2B Content Marketing Trends 2026
Constant Contact - Small Business Now Report, Q1 2026


