



Table of contents

The market for buying market analysis is worth USD 87.6 billion globally in 2026, and inside it, the money has already moved from fieldwork to analytics - which means most budget conversations about "market analysis" are still pricing the wrong half of the category. This page sizes both halves so a budget owner can allocate against the real split.
Key Takeaways
- Global marketing research and analysis services reached USD 87.6 billion in 2026.
- That is up from USD 84.46 billion in 2025.
- The market is forecast to hit USD 105.31 billion by 2030.
- That is a 4.7% compound annual growth rate.
- The US insights and analytics industry hit USD 89.3 billion in 2025.
- That is 7.8% growth, twice the pace of the broader US economy.
- Digital data analytics is now 37% of US industry revenue, the largest segment.
- Research technology accounts for nearly half of all industry revenue.
- Overall marketing budgets sit at 9.0% of company revenue in 2026.
- Marketing budgets are 9.6% of overall company budgets.
- Marketing spend grew just 1.7% year over year, the smallest rise since 2021.
- High-growth professional services firms spend 12.0% of revenue on marketing.
- No-growth firms spend just 5.0%.
- B2B organizations report investing roughly 9% of revenue in marketing overall.
Sizing the market that sells market analysis
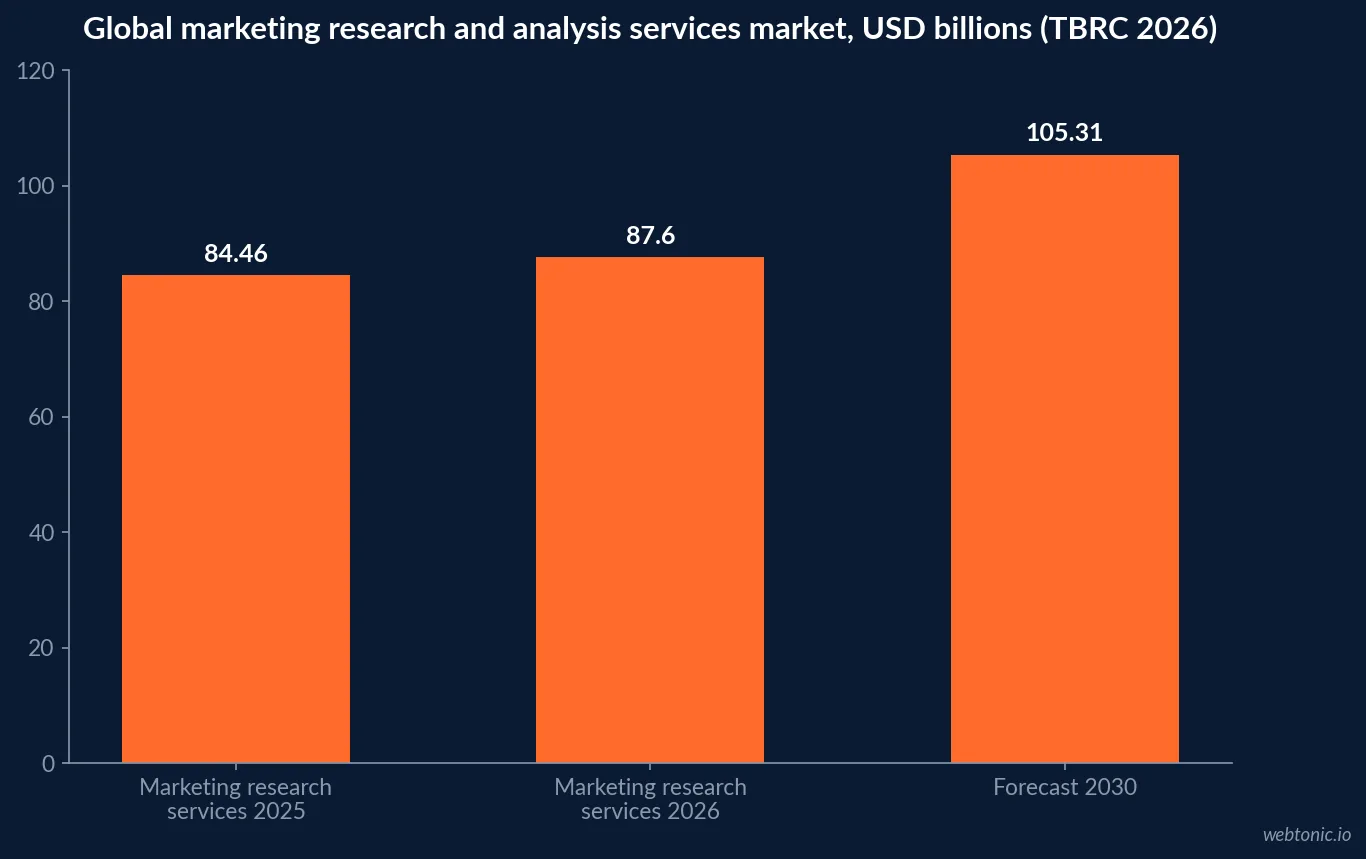
The Business Research Company's 2026 report puts the global marketing research and analysis services market at USD 87.6 billion in 2026, up from USD 84.46 billion in 2025, at a 4.7% compound annual growth rate that would carry it to USD 105.31 billion by 2030. North America was the largest region in 2025, with Western Europe growing fastest.
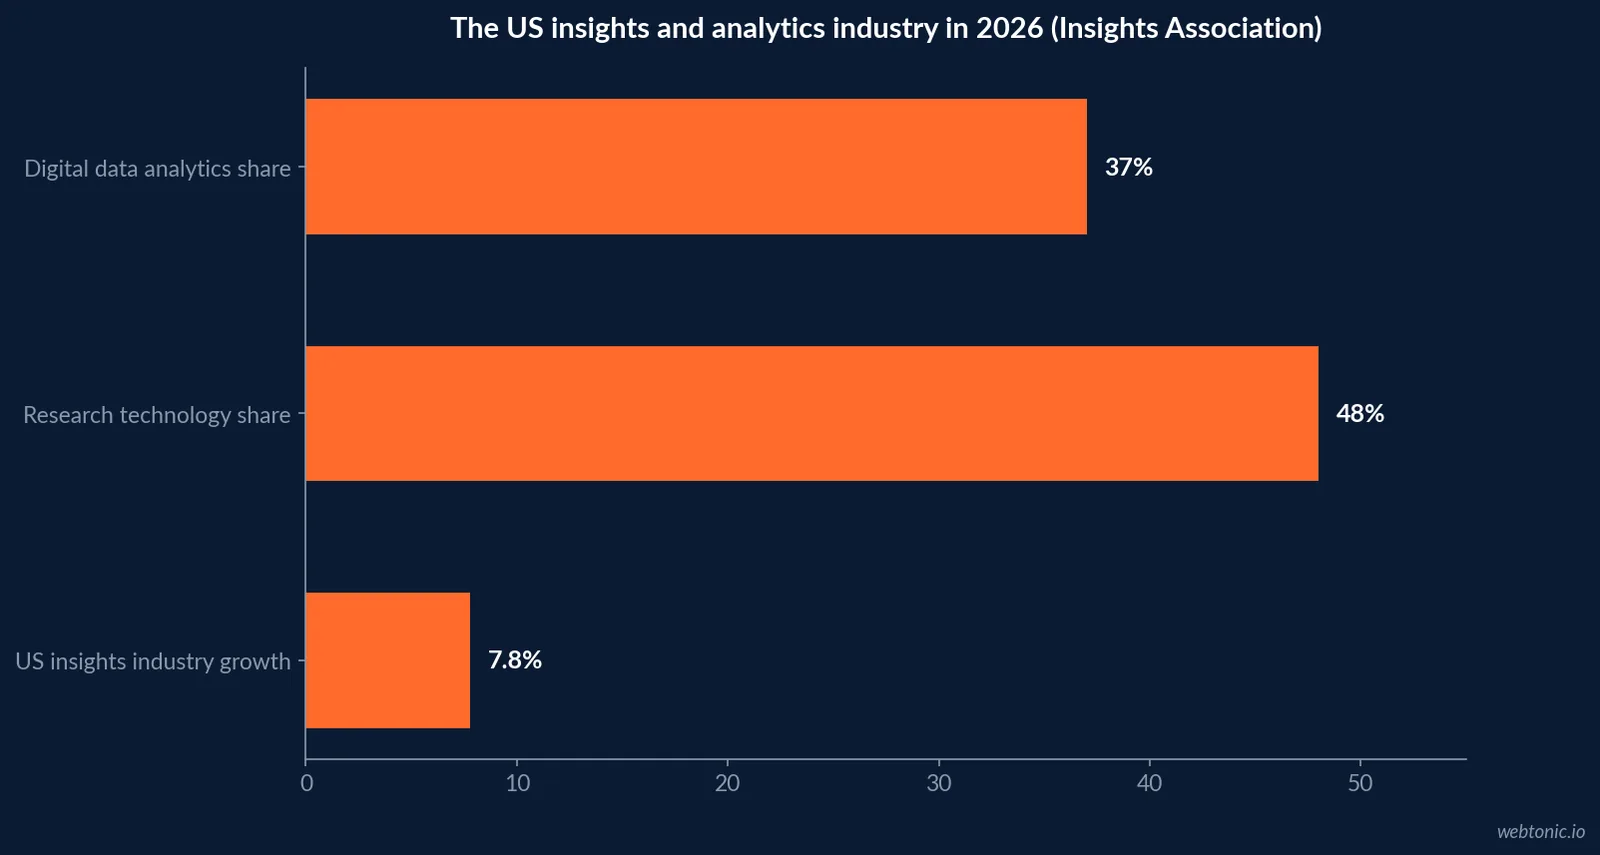
In the US specifically, the Insights Association's 2026 State of US Insights and Analytics Report found the industry grew 7.8% in 2025 to reach USD 89.3 billion - twice the growth rate of the broader US economy over the same period, according to Insights Association CEO Anita Watkins.
| Market-size fact (2026) | Figure | Source |
|---|---|---|
| Global marketing research services, 2025 | USD 84.46 billion | The Business Research Company |
| Global marketing research services, 2026 | USD 87.6 billion | The Business Research Company |
| Forecast, 2030 | USD 105.31 billion | The Business Research Company |
| Compound annual growth rate | 4.7% | The Business Research Company |
| US insights and analytics industry, 2025 | USD 89.3 billion | Insights Association |
| US industry growth rate, 2025 | 7.8% | Insights Association |
Where the money inside the category actually goes
The Insights Association's 2026 report finds digital data analytics has become the largest single segment of the US market research industry, accounting for 37% of total industry revenue. Research technology more broadly now accounts for nearly half of all industry revenue - meaning the category most people still picture as surveys and focus groups is now, by revenue, mostly a software and analytics business.
That split matters for a budget owner: a market-analysis line built around commissioning fieldwork reports is pricing a shrinking share of the category. The growing share is tooling, dashboards and continuous analytics - the part our own data and analytics practice is built to deliver in-house rather than re-buy every quarter.
| Segment (US industry, 2026) | Share of industry revenue | Source | Budget implication |
|---|---|---|---|
| Digital data analytics | 37% | Insights Association | Largest single segment; needs a dedicated tooling budget |
| Research technology overall | ~50% | Insights Association | Software now rivals fieldwork spend |
| Traditional fieldwork and reporting | Remaining share | Insights Association | Shrinking as a share of the category |
The marketing budget market analysis has to compete inside
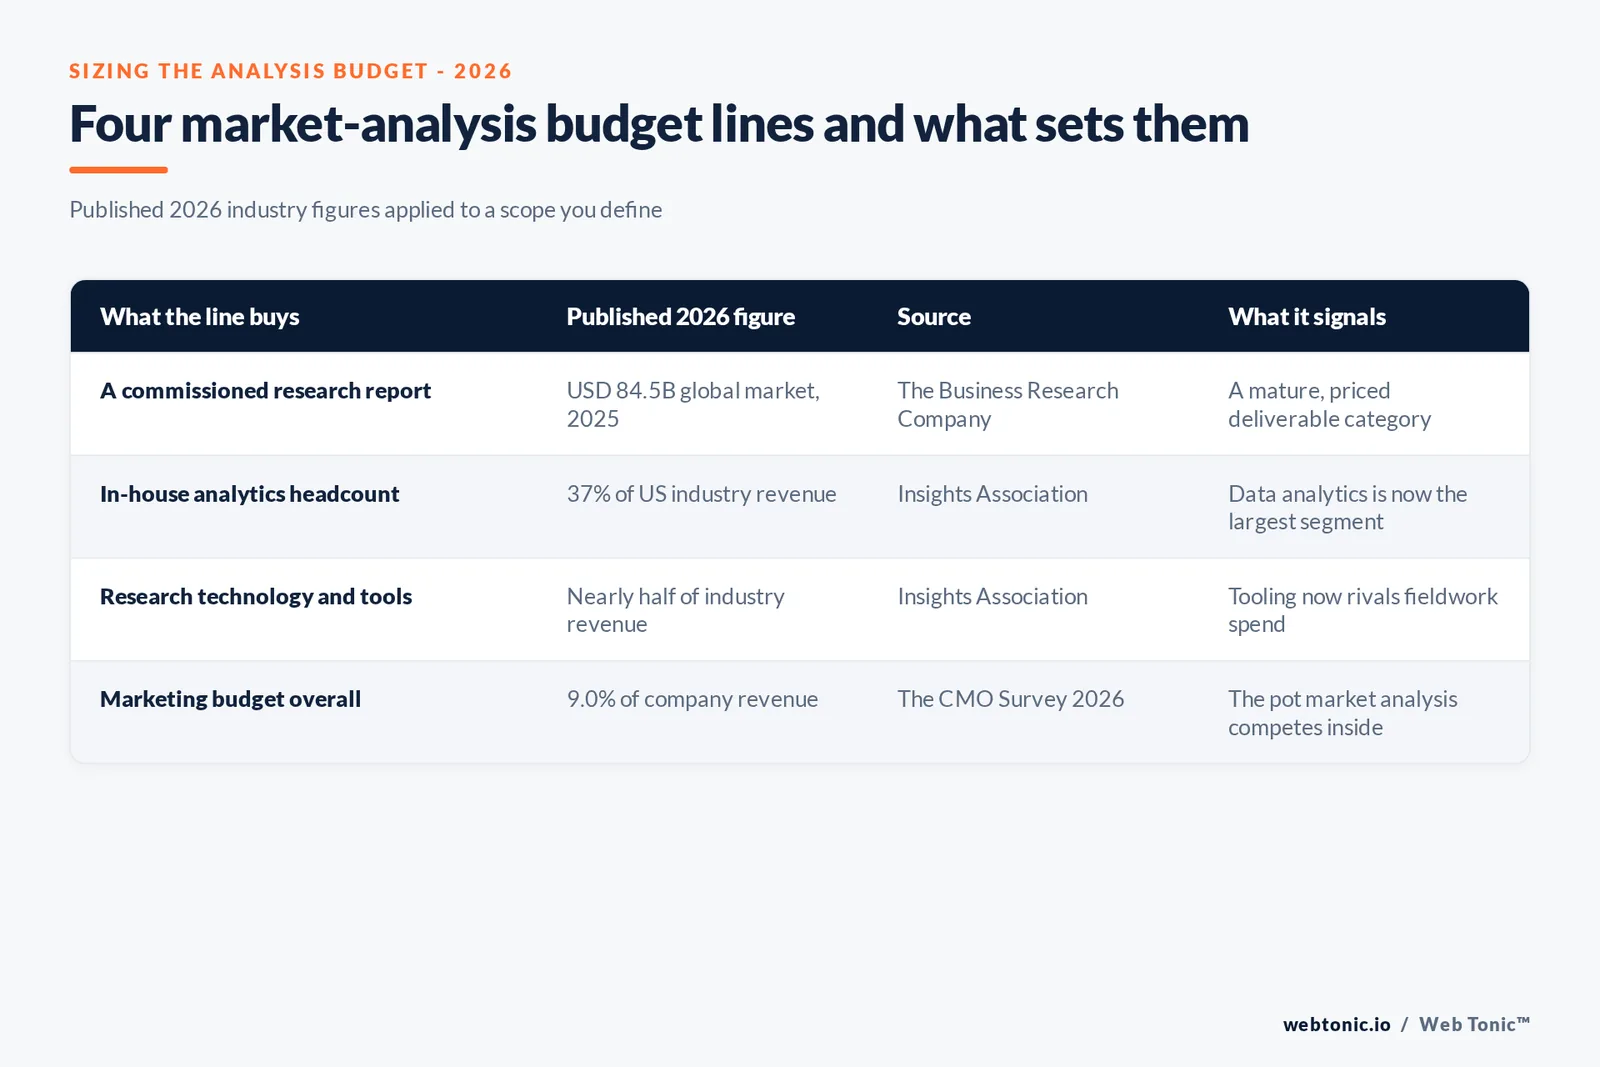
The CMO Survey's 2026 edition reports overall marketing spend at 9.0% of company revenues and 9.6% of overall company budgets, with total marketing spend growth of just 1.7% over the prior 12 months - the smallest increase since 2021. Forrester's 2026 B2B Marketing Budget Benchmarks similarly find B2B organizations investing roughly 9% of revenue in marketing, split across programs, personnel and technology, with technology allocations tracked as their own benchmark category.
Market analysis is almost never its own board-approved line; it draws from this pool. That is exactly why it gets cut first in a flat-budget year unless it is explicitly protected as a share of spend rather than left as a discretionary sub-line.
| Marketing budget fact (2026) | Figure | Source |
|---|---|---|
| Marketing spend, % of company revenue | 9.0% | The CMO Survey 2026 |
| Marketing spend, % of overall budgets | 9.6% | The CMO Survey 2026 |
| YoY marketing spend growth | 1.7% | The CMO Survey 2026 |
| B2B marketing investment, % of revenue | ~9% | Forrester 2026 B2B Benchmarks |
Why growth firms treat analysis as a standing line, not a project
Hinge's 2026 High Growth Study finds high-growth professional services firms spending 12.0% of revenue on marketing against just 5.0% for no-growth firms - a gap that shows up specifically in whether market and competitive analysis is funded continuously or only commissioned once before a launch decision. Firms treating it as a standing capability catch shifts - a competitor's repositioning, a channel's declining ROI - months before firms that only look when a decision forces them to.
| Growth cohort | Marketing spend, % of revenue | Source | Analysis posture typically observed |
|---|---|---|---|
| High-growth firms | 12.0% | Hinge 2026 High Growth Study | Continuous market monitoring |
| Average-growth firms | ~9% | The CMO Survey / Hinge composite | Periodic, project-based analysis |
| No-growth firms | 5.0% | Hinge 2026 High Growth Study | Analysis commissioned only when forced |
What "market analysis" covers in a modern budget
The term now spans at least three distinct spend categories that used to be one line: commissioned fieldwork reports priced by scope, standing analytics and dashboard tooling priced as software, and competitive-intelligence monitoring priced as a subscription. Treating all three as a single undifferentiated "research" line is exactly how budgets end up funding the shrinking category (fieldwork) while starving the growing ones (analytics and monitoring tooling).
Where the tooling budget is actually going
Inside the analytics share of the category, competitive intelligence software is one of the fastest-growing sub-lines. Precedence Research's 2026 market sizing puts the competitive intelligence tools market at USD 5.70 billion in 2025, growing to USD 6.44 billion in 2026 and projected to reach USD 19.18 billion by 2035 at a 12.9% compound annual growth rate - roughly triple the pace of the broader marketing research category. A market-analysis line that only budgets for commissioned reports and skips standing competitive-monitoring software is under-provisioned for where the fastest growth, and the fastest-moving competitive threats, are actually showing up.
| Competitive intelligence tooling fact (2026) | Figure | Source |
|---|---|---|
| Market size, 2025 | USD 5.70 billion | Precedence Research |
| Market size, 2026 | USD 6.44 billion | Precedence Research |
| Forecast, 2035 | USD 19.18 billion | Precedence Research |
| Compound annual growth rate | 12.9% | Precedence Research |
Whether synthetic respondents belong in the budget yet
AI is already inside the research workflow, but trust in AI-generated respondents has not caught up to usage. A 2026 study covered by Research Live found that only 7% of organizations currently use synthetic respondents within their insights function, and 47% of insights professionals say they are unwilling to use synthetic data for major decisions, compared with just 18% who reject AI support tools generally. A separate 2026 practitioner survey found 97% of researchers already use AI in some part of their workflow, yet only 8% trust AI-generated participants as a stand-in for real respondents.
The budget implication: fund AI for analysis speed and synthesis now, and treat synthetic-respondent panels as a pilot line rather than a fieldwork replacement until the trust gap closes.
| AI-in-research adoption fact (2026) | Figure | Source |
|---|---|---|
| Organizations using synthetic respondents | 7% | Research Live / Zappi study |
| Insights professionals unwilling to use synthetic data for major decisions | 47% | Research Live / Zappi |
| Researchers using AI in some part of workflow | 97% | Development Corporate 2026 survey |
| Researchers who trust AI-generated participants | 8% | Development Corporate 2026 survey |
How to allocate the line for next year
Name the analysis-and-analytics share of your marketing budget explicitly rather than letting it float as a discretionary sub-line inside a flat 9% pool - that is the single change most likely to protect it from being the first cut when growth of only 1.7% forces trade-offs elsewhere. Then weight new spend toward analytics and tooling rather than one-off fieldwork reports, since that is where 37% of industry revenue - and the category's actual growth - now sits.
Hold back a small, explicit slice for competitive-intelligence tooling given its 12.9% growth rate, and treat AI-assisted synthesis as a productivity upgrade to your existing analyst hours rather than a headcount replacement - the trust data above shows the market is not ready to substitute synthetic respondents for real fieldwork, no matter how fast the tooling itself is adopted.
If you need that capability built rather than re-bought every quarter, our data and analytics practice builds standing market and competitive monitoring into a client's own stack, and our growth marketing team can connect that analysis directly to channel budget decisions. You can talk to us about scoping it, or read our breakdown of how a strategy should translate market data into channel decisions before the next budget cycle locks in.
Frequently Asked Questions
Does a bigger market research budget guarantee better decisions?
No - allocation matters more than size. The Insights Association's finding that digital data analytics and research technology together account for nearly half of US industry revenue suggests the firms getting the most from their spend are the ones buying continuous analytical capability, not just a bigger one-off report. A large budget spent entirely on periodic fieldwork will still miss the shifts a smaller, continuously-monitored budget catches in real time.
How much should a company budget for market analysis?
There is no single published benchmark for the analysis line alone, because it is usually embedded inside the wider marketing budget rather than tracked separately. The CMO Survey's 2026 edition puts overall marketing spend at 9.0% of company revenue; market analysis and research typically draws from that pool rather than a dedicated line, so the honest starting point is to name the share of the 9.0% your organization intends to spend on research and analytics specifically, then hold that share fixed year over year so it isn't the first thing cut.
Is the market research industry growing or shrinking?
Growing, modestly. The Business Research Company's 2026 report puts the global marketing research and analysis services market at USD 87.6 billion in 2026, up from USD 84.46 billion in 2025, forecasting USD 105.31 billion by 2030 at a 4.7% CAGR. The US-specific insights and analytics industry grew 7.8% in 2025 to reach USD 89.3 billion, according to the Insights Association - faster than the broader economy.
What is actually driving spend inside the market research budget?
Digital data analytics, not traditional fieldwork. The Insights Association's 2026 State of US Insights and Analytics Report finds digital data analytics has become the largest single segment of the US market research industry at 37% of total industry revenue, with research technology broadly accounting for nearly half of all industry revenue. A budget still weighted toward survey fieldwork is funding a shrinking share of where the category's growth is happening.
How does a market analysis budget compare to the overall marketing budget?
It sits inside it. The CMO Survey 2026 reports marketing spend at 9.0% of revenue and 9.6% of overall company budgets, with total marketing spend growth of only 1.7% year over year - the smallest increase since 2021. Forrester's 2026 B2B benchmarks similarly find B2B organizations investing roughly 9% of revenue in marketing overall, with allocations split across programs, personnel and technology.
Should market analysis be treated as a one-time project or an ongoing line?
Ongoing, if the market itself is a target of continuous investment decisions. High-growth professional services firms spend 12.0% of revenue on marketing versus 5.0% for no-growth firms, per Hinge's 2026 High Growth Study - and growth firms are disproportionately the ones treating market and competitive analysis as a standing capability rather than a pre-launch project that gets shelved once a decision is made.
Sources
The Business Research Company - Marketing Research and Analysis Services Market Report 2026
Research Live (MRS) - US insights industry reaches USD 89.3bn
Insights Association - 2026 State of US Insights & Analytics Market Report
The CMO Survey - Highlights and Insights Report 2026
Forrester - 2026 B2B Marketing Budget Benchmarks: Overview
Hinge Marketing - 2026 High Growth Study
Precedence Research - Competitive Intelligence Tools Market 2026-2035
Research Live - Insight satisfaction drops, but AI boosts support, says Zappi study
Development Corporate - Synthetic Users in 2026 survey


