



Table of contents
For a manufacturer weighing TV, the 2026 contrast is clear: linear is cheaper per thousand viewers, at about USD 2.50 against USD 9.50 for streaming in Tatari's data, while streaming now holds 49.0% of US TV time. No study reports a manufacturing-specific CTV or linear benchmark; every figure below is cross-industry unless stated.
Key Takeaways
- Streaming held 49.0% of US TV time in July 2026; broadcast and cable together held 38.2%.
- Among adults 18+, streaming drops to 44.4% of ad-supported TV (Q2 2026).
- Linear CPMs averaged about USD 2.50 against USD 9.50 for streaming (Tatari, 2019-2023).
- Digital video reaches 61% of TV/video spend in 2026, up from 38% in 2021 (IAB).
- 54% of advertisers growing CTV fund it from linear TV.
- Interactive CTV completion reached 95% against 62% for PC and mobile (Innovid, 2021).
- 94% of technical buyers watch work-related video (TREW 2026).
- US manufacturing counts 239,265 firms, all but 4,177 of them small (NAM).
- 25% of US open programmatic CTV traffic was invalid in Q2 2026.
Linear versus CTV at a glance
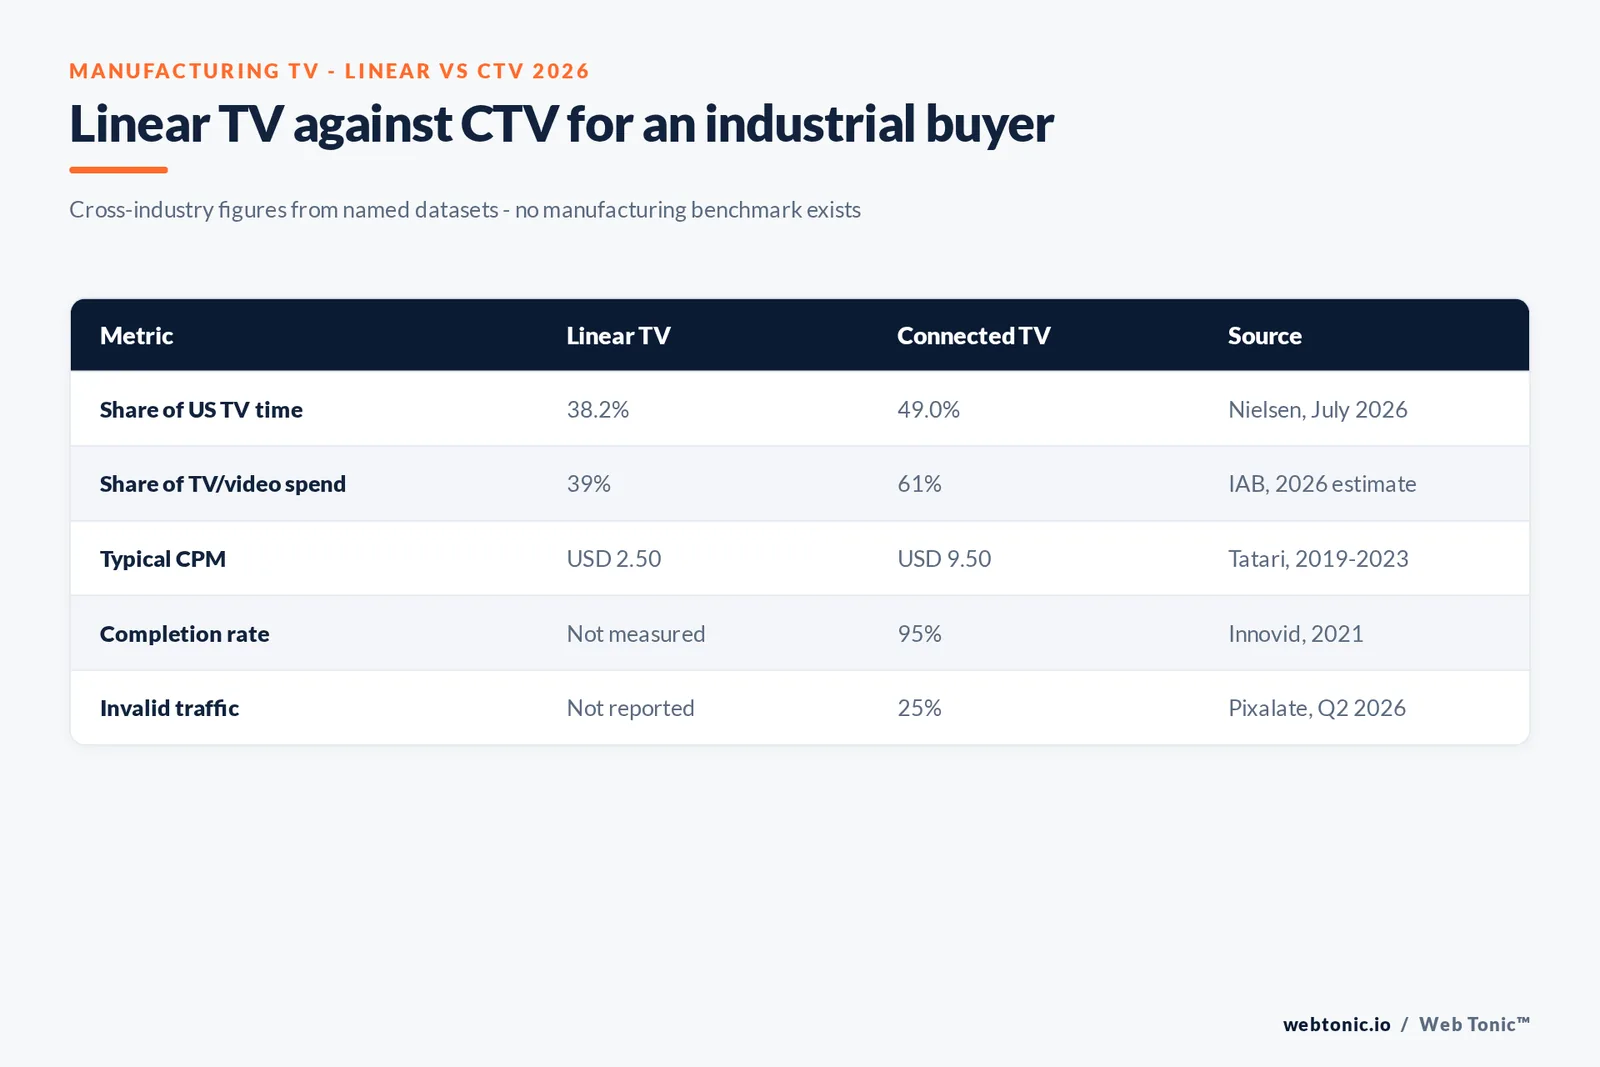
The table sets the two sides against each other on the metrics a manufacturer is quoted. Each cell names its source; where a metric does not exist for one side, the table says so instead of estimating it.
| Metric | Linear TV | Connected TV | Source and period |
|---|---|---|---|
| Share of US TV time | 38.2% (broadcast 19.5% + cable 18.7%) | 49.0% streaming | Nielsen Gauge, July 2026 |
| Share of TV/video ad spend | 39% | 61% digital video | IAB/Guideline, 2026 estimate |
| Typical CPM | About USD 2.50 | About USD 9.50 | Tatari client data, 2019-2023 |
| Completion rate | Not measured per impression | 95% interactive CTV | Innovid, 2021 impressions |
| Professional targeting | Network, daypart, market | Account/job data via LinkedIn CTV | LinkedIn, April 2024 |
| Invalid traffic rate | Not reported | 25% open programmatic | Pixalate, Q2 2026 |
Viewing share: where the screen time sits
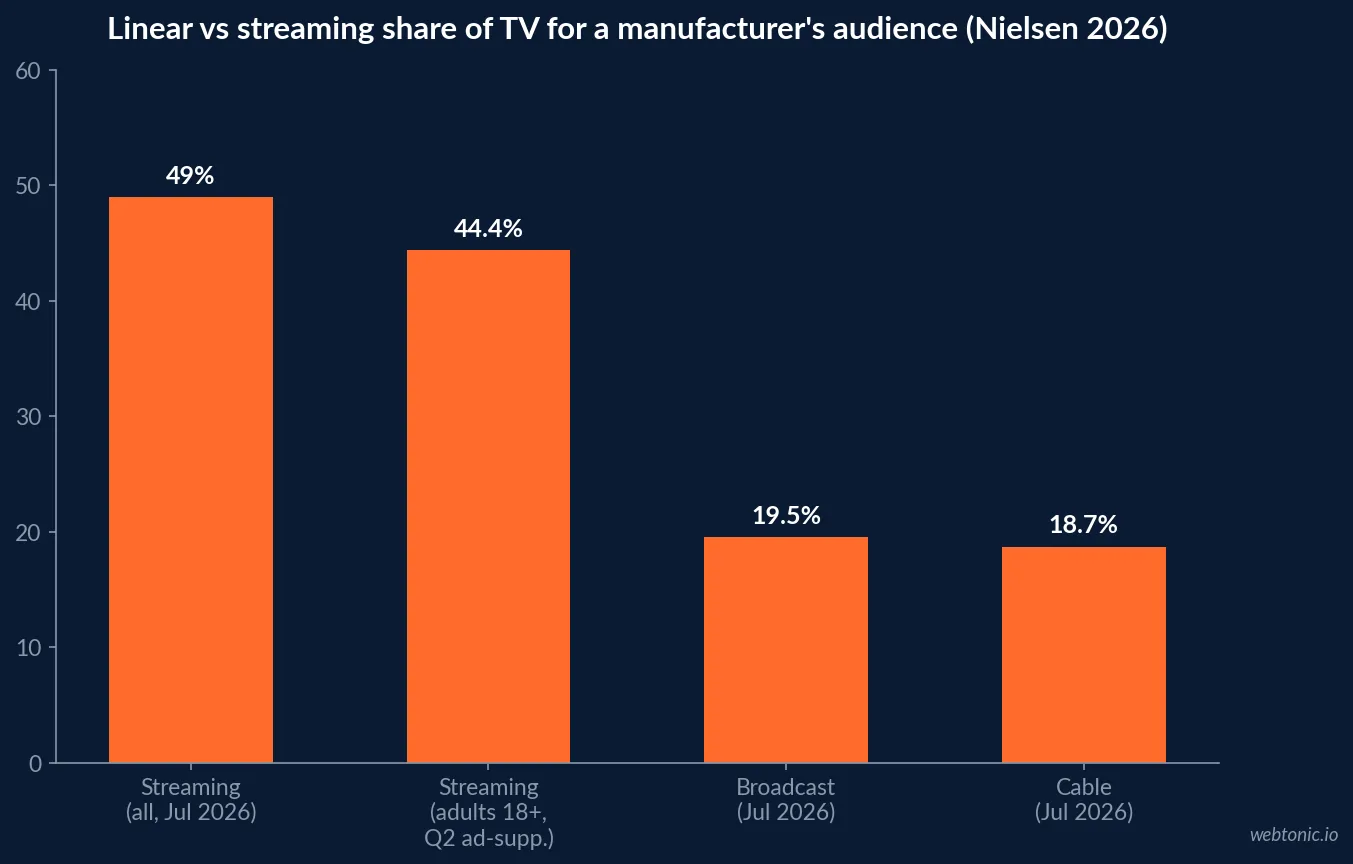
Nielsen's July 2026 Gauge put streaming at 49.0% of total US TV usage, with YouTube alone at 14.2%, broadcast at 19.5% and cable at 18.7%, even with World Cup coverage supporting broadcast. The linear half of the argument is still sizeable: nearly two in five TV minutes are broadcast or cable.
The age mix matters for industrial buyers, who skew toward experienced engineers and plant leaders. In Nielsen's Q2 2026 Ad Supported Gauge, ad-supported TV was 71.5% of viewing and streaming 48.2% of it; among persons 18+ streaming fell to 44.4% while broadcast rose to 28.6% and cable to 27.0%.
| Ad-supported TV, Q2 2026 (Nielsen) | Total audience | Persons 18+ |
|---|---|---|
| Streaming share of ad-supported TV | 48.2% | 44.4% |
| Broadcast share | Not restated in release | 28.6% |
| Cable share | 25.2% | 27.0% |
| Ad-supported TV as share of all viewing | 71.5% | Not restated |
Spend: money is moving from linear to streaming
The 2026 IAB Digital Video Ad Spend and Strategy report, built on Guideline billing estimates and a survey of 360 buyers, shows digital video taking 61% of total TV/video spend in 2026 against 39% for linear. In 2021 the split was the reverse, 62% linear and 38% digital. Among buyers increasing CTV spend, 54% fund it from linear TV, 40% from other traditional media such as print and radio and 38% from incremental budget.
Targeting capability is now the top criterion for choosing where TV and video money goes, cited by 49% of buyers and up 10 points year on year. For industrial advertisers whose buyers are a small professional audience, that criterion is the whole case for CTV.
| Year (IAB/Guideline) | Linear TV share | Digital video share |
|---|---|---|
| 2021 | 62% | 38% |
| 2023 | 52% | 48% |
| 2024 | 49% | 51% |
| 2025 | 42% | 58% |
| 2026 estimate | 39% | 61% |
Where the CTV money comes from
The same IAB survey asked buyers who are increasing CTV spend in 2026 how they will fund it. Linear TV is the single largest source at 54%, but it is far from the only one: 40% name other traditional media such as print and radio, 38% incremental budget and 36% online video outside YouTube. Display is named by 26%, digital audio and podcasts by 23%, out-of-home by 23% and paid search by 21%. Respondents could pick several sources, so the shares add to more than 100%.
For an industrial marketer the pattern suggests a practical order of questions. First, is there a linear or trade print line that already buys awareness and could be tested against CTV? Second, is the test incremental money that needs its own success metric? Moving budget out of paid search, the channel most manufacturers already tie to leads, is the least common source in the survey and the hardest to defend internally.
| Funding source for increased CTV spend (IAB 2026) | Share of buyers | Manufacturing reading |
|---|---|---|
| Linear TV | 54% | Direct swap test against existing TV |
| Other traditional (print, radio) | 40% | Trade print is the closest industrial analogue |
| Incremental ad budget | 38% | Needs its own success metric |
| Online video excluding YouTube | 36% | Video creative already exists |
| Display | 26% | Often paused by manufacturers already |
| Paid search | 21% | Least defensible source for lead-driven teams |
Price: linear is cheaper per thousand
Tatari's analysis of its client data from 2019 to 2023 found streaming CPMs typically three to four times higher than linear, about USD 9.50 against USD 2.50. Tatari adds that its streaming rates are already below market thanks to direct publisher deals, often 66% lower than programmatic buying. On pure cost per thousand households, linear wins.
The catch for a manufacturer is waste. A linear CPM buys everyone watching a network in a market; an industrial buyer might be a tiny fraction of that audience. The relevant comparison is cost per thousand qualified viewers, which no published dataset reports for manufacturing.
Completion: what CTV reports and linear cannot
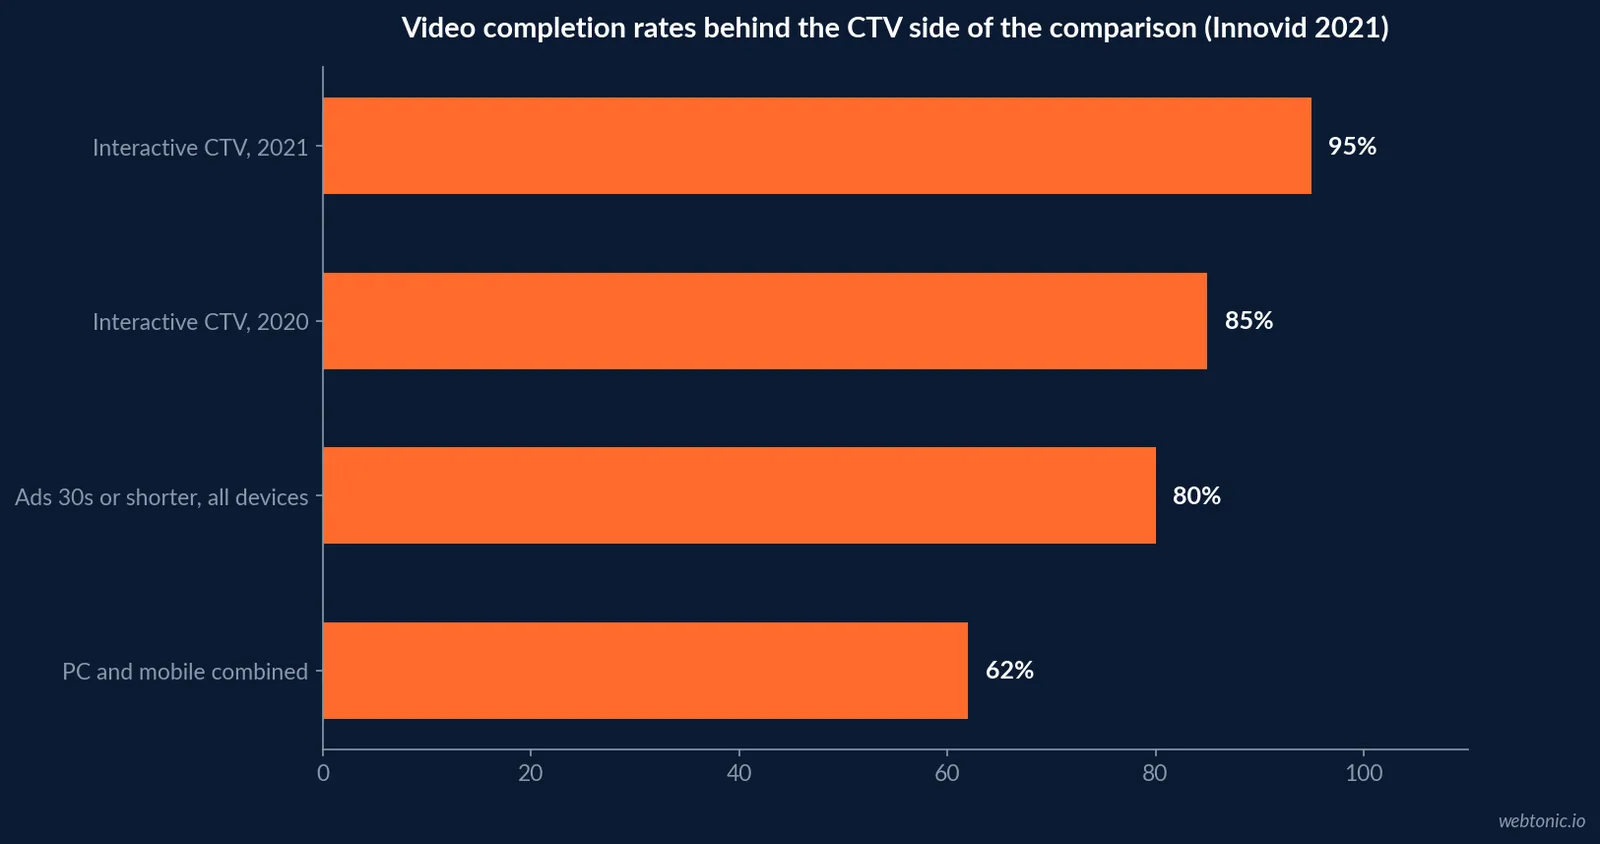
Innovid's CTV Takes Center Stage Global Benchmarks report, covering 286 billion impressions served in 2021, found interactive CTV completion rates rising from 85% to 95%, against 62% for PC and mobile combined. Ads of 30 seconds or less completed at 80% or more across devices, and longer ads at 67% to 77%.
Linear TV has no per-impression completion metric at all. That is an asymmetry in reporting, not proof that CTV performs better: a CTV completion rate in the 90s mostly reflects non-skippable inventory.
Targeting: the B2B case for streaming
LinkedIn introduced LinkedIn CTV ads in April 2024 for B2B marketers, running creative against streaming content on connected sets across publishers including Paramount, Roku and Samsung Ads, launched from Campaign Manager and drawing on a community of more than 1 billion members. A managed LinkedIn Premiere offer with NBCUniversal targets US decision makers on premium streaming content.
Linear buys a network and a daypart. For a manufacturer selling motion-control components or process equipment, professional targeting on CTV is the one capability linear cannot replicate at any CPM.
The industrial buyer: who is on the other side
The 2026 State of Marketing to Engineers report from TREW Marketing and GlobalSpec found 94% of technical buyers watch work-related videos and 68% listen to work podcasts. Buyers complete 62% of the buying journey before contacting a vendor, and 53% say brand familiarity influenced their most recent purchase.
That is the argument for any TV at all in manufacturing: familiarity is built before the sales conversation. It does not settle linear versus CTV, but it supports awareness spend aimed at a defined professional audience.
| Technical buyer signal (TREW/GlobalSpec 2026) | Share | Linear vs CTV reading |
|---|---|---|
| Watch work-related videos | 94% | Video creative is expected; both channels can carry it |
| Journey completed before vendor contact | 62% | Awareness has to land before the first call |
| Brand familiarity influenced last purchase | 53% | Supports awareness media in general |
| Listen to work podcasts | 68% | Audio competes with TV for the same budget |
The size of the market being targeted
NAM's Facts About Manufacturing counts 239,265 manufacturing firms in 2022, all but 4,177 of them small, with over 12.6 million manufacturing workers in August 2026 and value-added output of USD 3.0 trillion at an annual rate in Q1 2026. A buyer universe of that size is too small and too dispersed for mass linear reach to be efficient, and too large for one-to-one sales alone.
On the marketing side, Straight North's 2026 Manufacturing Marketing Survey of 245 marketers (agency data) found 60% work at firms under 100 employees and 48% run marketing teams of one or two people. Display advertising and paid social showed up more often among paused channels, a sign of scrutiny on paid media that a TV test will also face.
Fraud and measurement risk
Pixalate's Q2 2026 benchmarks put invalid traffic at 25% of US open programmatic CTV traffic and 26% globally, against 39% for US mobile apps. The figure covers open programmatic supply; direct and curated deals typically carry less exposure. Linear's risk is different: it is audience estimation from panels, not bots. A manufacturer comparing the two should ask each seller how impressions were verified.
How to split a manufacturing TV test
- Start from the buyer list. 239,265 firms is a targetable universe; define it first.
- Price qualified reach, not CPM. USD 2.50 linear is cheap only if the audience fits.
- Use professional targeting where it exists. LinkedIn CTV reaches B2B audiences on streaming.
- Discount completion. 95% CTV completion is the norm for non-skippable inventory.
- Buy direct where you can. 25% of open programmatic CTV was invalid in Q2 2026.
- Measure the pre-contact stage. Buyers finish 62% of the journey before calling.
Our data intelligence team builds TV measurement tied to site visits and pipeline, and our performance creative team produces spots from existing product video. For more context see the connected TV benchmarks hub, our manufacturing influencer and UGC data and the wider advertising statistics.
Frequently Asked Questions
Is linear TV or CTV better for a manufacturer?
Neither has a published manufacturing benchmark, so the comparison rests on cross-industry data. Linear is cheaper per thousand: Tatari's 2019-2023 client data put linear CPMs at about USD 2.50 against USD 9.50 for streaming. CTV reaches the larger share of viewing, 49.0% of US TV time in July 2026 per Nielsen, and can be targeted by account or job title through platforms such as LinkedIn CTV. For a narrow B2B buyer, targeting usually outweighs CPM.
What share of TV viewing is still linear?
In Nielsen's July 2026 Gauge, broadcast held 19.5% and cable 18.7% of total US TV time, 38.2% combined, against 49.0% for streaming. Among adults 18+ in the Q2 2026 Ad Supported Gauge, streaming fell to 44.4% while broadcast rose to 28.6% and cable to 27.0%, so linear is stronger among older adult viewers.
Can CTV target engineers or plant managers?
Some platforms offer professional targeting. LinkedIn launched LinkedIn CTV ads in April 2024, letting advertisers reach its audience on streaming TV across publishers including Paramount, Roku and Samsung Ads from Campaign Manager. Linear TV has no equivalent: it is bought by network, daypart and market.
Do technical buyers watch video at all?
Yes. TREW Marketing and GlobalSpec's 2026 State of Marketing to Engineers report found 94% of technical buyers watch work-related videos and 53% say brand familiarity influenced their most recent purchase. Buyers complete 62% of the journey before contacting a vendor, which is the stage TV-style awareness can reach.
How much of CTV traffic is fraudulent compared with linear?
Pixalate's Q2 2026 benchmarks put invalid traffic at 25% of US open programmatic CTV traffic. Linear TV is not measured with an equivalent invalid-traffic rate, because it is not bought impression by impression through programmatic exchanges; its risk is measurement accuracy rather than bots.
Sources
Nielsen - July 2026 The Gauge
Nielsen - Q2 2026 Ad Supported Gauge
IAB - 2026 Digital Video Ad Spend and Strategy Full Report
Tatari - What's driving down linear CPMs
Innovid - CTV Takes Center Stage Global Benchmarks (2021 data)
LinkedIn - Introducing LinkedIn CTV and Live Event Ads (2024)
TREW Marketing and GlobalSpec - 2026 State of Marketing to Engineers
National Association of Manufacturers - Facts About Manufacturing
Straight North - 2026 Manufacturing Marketing Survey (agency data)
Pixalate - Q2 2026 Ad Fraud Benchmarks, North America


