



Table of contents
Key Takeaways
The U.S. locksmith industry generates $2.6–$2.9 billion annually across approximately 26,000–29,000 establishments, while the global locksmith services market reached $31.2 billion in 2024 and is projected to hit $51.1 billion by 2033 at a 5.6% CAGR. Phone analytics reveal that locksmiths miss 23% of incoming calls on average, costing an estimated $1,665+ per week in lost revenue for a shop receiving 40 calls weekly. Meanwhile, AI receptionist adoption among 3+ truck shops has reached 15% in mid-2026, 3.7× the 2024 rate — the fastest-growing analytics and automation trend in the trade. Below are 45+ verified data points on locksmith market analytics, call tracking, and technology adoption for 2026.
Locksmith Market Size and Revenue Analytics
| Metric | Value | Source / Year |
|---|---|---|
| U.S. locksmith services revenue | $2.6–$2.9 billion | IBISWorld / US Census, 2026 |
| U.S. establishments | ~26,000–29,000 | US Census NAICS 561621 |
| U.S. market CAGR (2021–2026) | −1.1% | IBISWorld, 2026 |
| Global locksmith services market (2024) | $31.2 billion | Growth Market Reports |
| Global market forecast (2033) | $51.1 billion | Growth Market Reports |
| Global CAGR (2025–2033) | 5.6% | Growth Market Reports |
| Top 10 chains market share | <8% | TheKeyBot, 2026 |
The U.S. locksmith market has been declining at a CAGR of −1.1% from 2021 to 2026 (IBISWorld), reflecting consolidation pressures and smart lock displacement. However, the global market tells a different story: locksmith services are projected to grow at 5.6% CAGR to $51.1 billion by 2033 (Growth Market Reports), driven by rising security concerns, urbanization, and the growing complexity of modern lock systems. The industry remains highly fragmented — the ten largest national chains control under 8% of total revenue (TheKeyBot), meaning independent shops can compete effectively with strong analytics and local visibility.
Locksmith Phone Analytics: The Revenue Impact of Missed Calls
Phone calls remain the primary lead channel for locksmith businesses. The analytics around call handling reveal massive revenue opportunities:
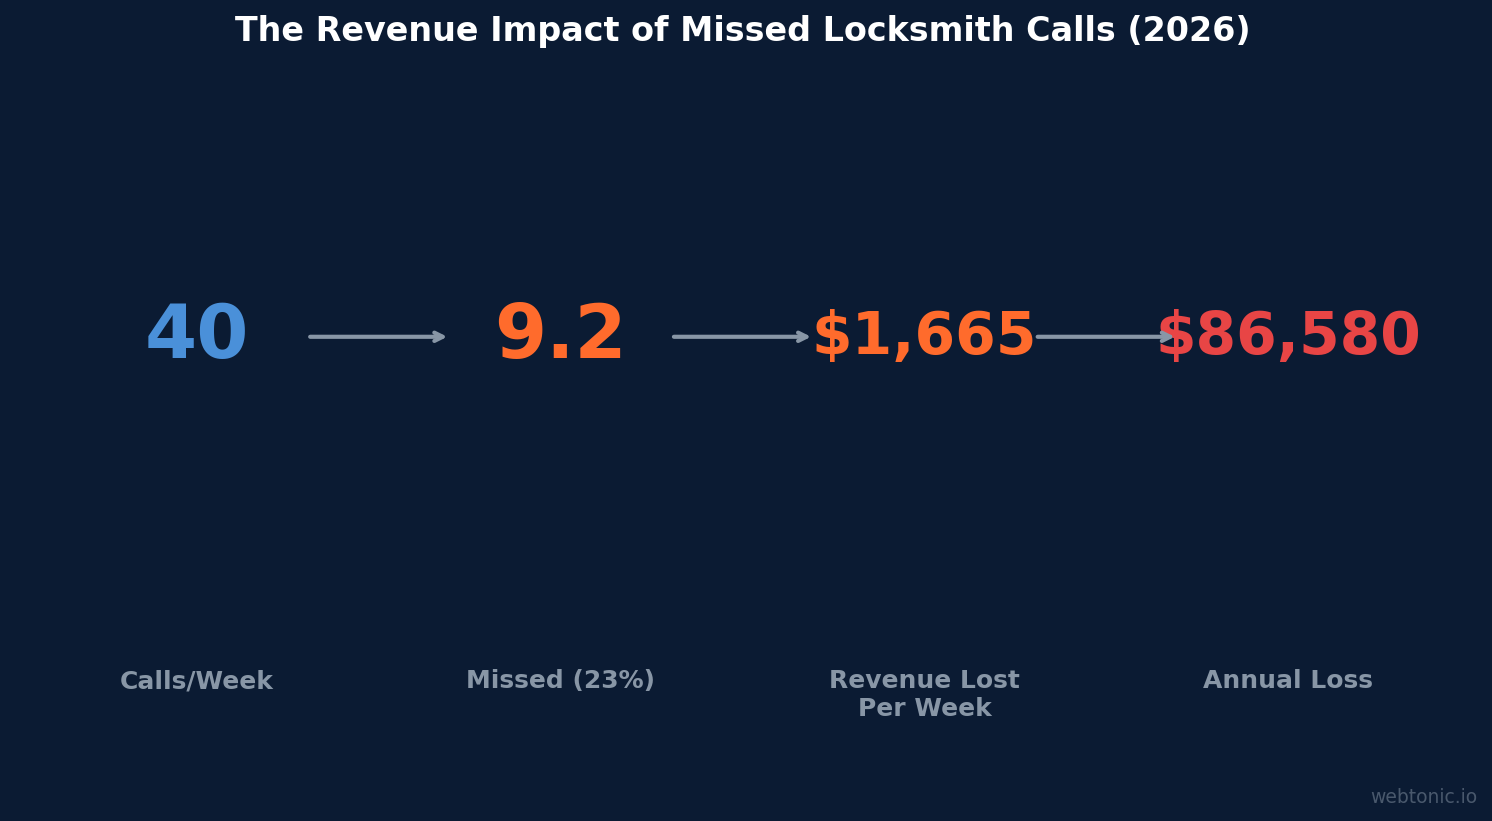
- Average locksmiths miss 23% of incoming calls — nearly one in four. For a shop receiving 40 calls per week, that is roughly 9 missed opportunities every single week (AgentZap, citing IBISWorld data).
- Average revenue lost per missed emergency call: $185+. When additional services like rekeying or security upgrades are factored in, the loss can exceed $300 per call.
- Customer callback rate after missed call: only 12%. In emergency situations, 88% of callers who reach voicemail will never call back — they move to the next search result.
- 67% of all locksmith calls come from mobile searches, reinforcing the urgency-driven nature of the business where response speed determines who wins the job.
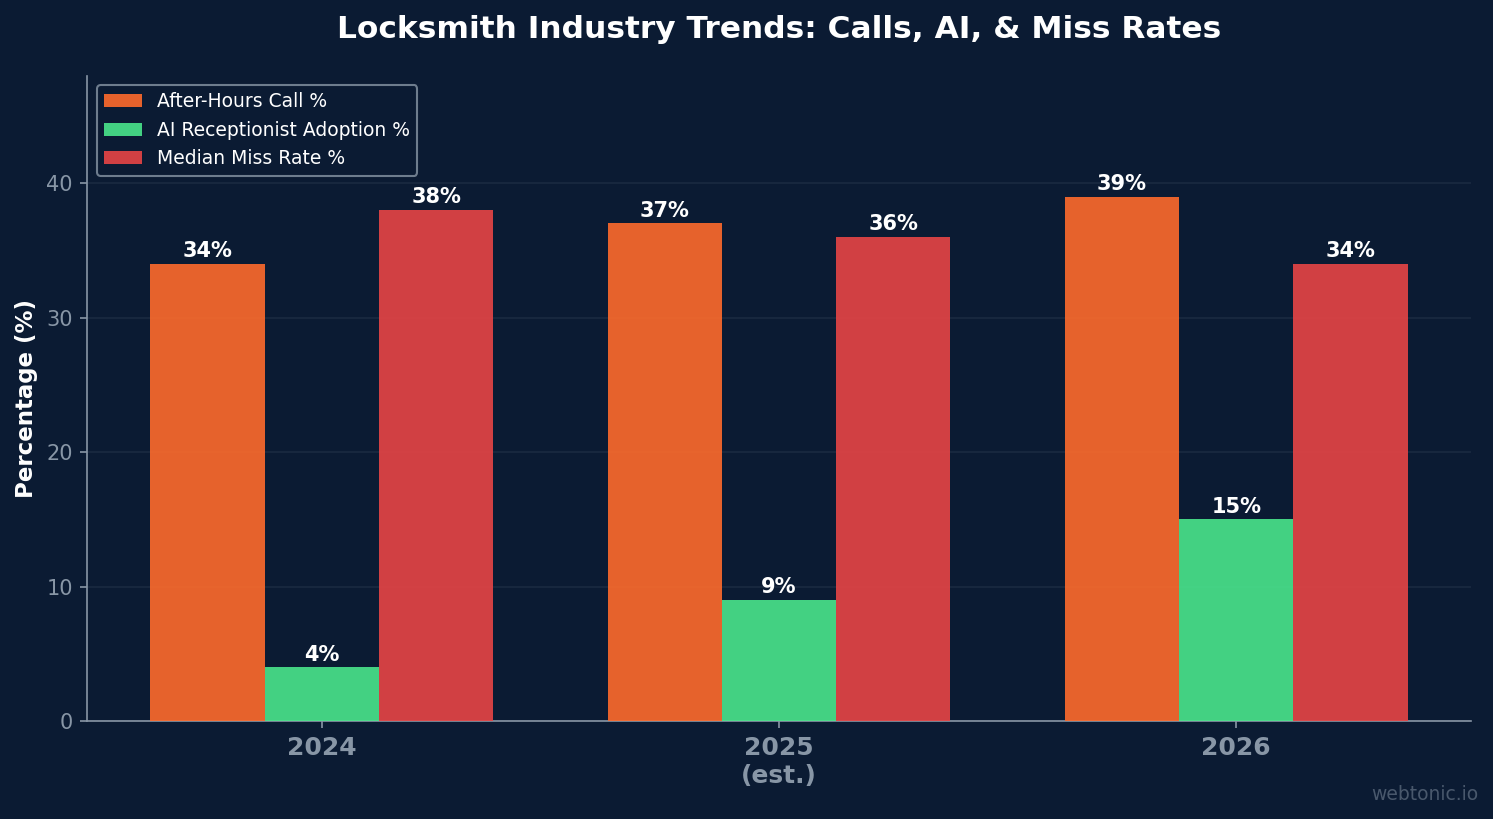
- Median shop miss rate has declined from 38% in 2024 to 34% in 2026, driven mostly by AI receptionist adoption among early-mover shops (TheKeyBot).
The math is stark: a locksmith missing 9 calls per week at $185 average per emergency job loses approximately $1,665 in revenue weekly — or $86,580 annually. This single metric makes call tracking and answering optimization the highest-ROI analytics investment a locksmith can make.
After-Hours and Emergency Call Patterns
| Metric | 2024 | 2026 | Change |
|---|---|---|---|
| After-hours call share | 34% | 39% | +5 pp |
| Avg automotive lockout ticket | $199 | $215 | +8.1% |
| Median shop miss rate | 38% | 34% | −4 pp |
| AI receptionist adoption (3+ truck) | ~4% | ~15% | 3.7× growth |
| Cost per lead (Google LSA) | $28 avg | $34 avg | +21% |
Source: TheKeyBot State of the Locksmith Industry 2026 (240+ active shops). The after-hours call share climbing to 39% means locksmith businesses that do not answer phones evenings and weekends are missing nearly four in ten potential customers. This trend, combined with rising automotive lockout tickets (now $215 average, up 8.1% YoY), makes after-hours coverage a revenue-critical analytics priority — not a convenience feature.
AI Receptionist and Automation Analytics
The most disruptive analytics trend in the locksmith industry is AI receptionist adoption, which is reshaping how shops capture and convert inbound leads:
- 15% of locksmith shops with 3+ trucks now use AI receptionists in mid-2026, up from approximately 4% in 2024 — a 3.7× increase in just two years (TheKeyBot).
- AI-equipped shops show measurably lower miss rates, contributing to the industry-wide decline from 38% to 34% median miss rate.
- The early-mover cohort is widening the gap: shops with AI answering capture after-hours calls that competitors lose to voicemail, converting $185+ emergency jobs that would otherwise go to the next search result.
- Solo operators are the slowest adopters: AI receptionist penetration among 1-truck shops remains under 5%, despite these operators being most vulnerable to missed calls while on jobs.
For locksmith businesses evaluating growth technology investments, AI receptionist analytics offer the clearest ROI signal: recovering even 3–4 of the 9 missed weekly calls at $185 per job generates $555–$740 per week — more than covering the cost of most AI answering solutions.
Smart Lock Market and Technology Disruption
The smart lock market is both a threat and an opportunity for locksmith analytics and service positioning:
- Smart lock market CAGR: 14.65% from 2026 to 2034 (IMARC Group), driven by smart home adoption, IoT connectivity expansion, and contactless access demand.
- Smart lock installations are the fastest-growing locksmith service segment, with call volume up an estimated 18–24% YoY from 2024 to 2026 (TheKeyBot).
- Automotive key complexity continues to rise: modern transponder and proximity keys require specialized programming that increases average ticket values but also requires ongoing training investment.
- Residential smart lock adoption creates new service categories: installation, programming, battery replacement, network troubleshooting, and integration with home security systems.
Locksmiths who track which services generate the highest revenue per hour — traditional mechanical lockwork versus smart lock and electronic security — can strategically shift marketing spend toward higher-margin segments. Analytics showing smart lock installation at $200–$500 per job versus $75–$150 for a standard lockout suggest the future revenue mix favors technology-forward shops.
CRM and Field Service Management Software Adoption
| Software Category | Market Penetration | Key Platforms |
|---|---|---|
| CRM / FSM software (any) | ~35–40% | Thryv, Housecall Pro, ServiceTitan |
| AI receptionist / virtual answering | ~15% (3+ truck shops) | TheKeyBot, Smith.ai, Ruby |
| Call tracking software | ~20–25% | CallRail, CallTrackingMetrics |
| Online booking / scheduling | ~30% | Housecall Pro, Jobber, ServiceM8 |
| GPS fleet tracking | ~25–30% | Verizon Connect, GPS Trackit |
CRM and FSM distribution data from Home Service Base (22,460 locksmith Google Business Profiles, 11,955 websites analyzed). The majority of locksmith businesses still operate without dedicated CRM software, relying on spreadsheets, paper tickets, or basic phone logs. This represents a significant analytics blind spot — shops without CRM cannot accurately track customer lifetime value, repeat service rates, or marketing attribution from ad spend to completed jobs.
Locksmith SEO and Digital Visibility Analytics
Digital visibility metrics are a critical analytics layer for locksmith businesses competing in local search:
- Time to local pack entry in a Tier 2 market: 3–6 months with consistent Google Business Profile optimization and review acquisition (Authority Specialist, 18 locksmith shops, July 2026).
- Organic search results below the local pack receive substantially fewer clicks for emergency-intent queries, making Map Pack presence the highest-priority visibility metric for locksmiths.
- 22,460 locksmith Google Business Profiles exist across 1,907 U.S. cities (Home Service Base), averaging approximately 12 profiles per city — a density that makes review count and response time the key differentiators.
- Google LSA cost per lead reached $34 in 2026, up 21% year-over-year, squeezing margins for shops that rely exclusively on paid lead channels without organic visibility.
- Shops investing in both paid and organic channels report 40–60% lower blended CPL compared to paid-only shops, because organic traffic offsets rising auction costs.
The analytics imperative is clear: locksmiths who track Google Business Profile insights (search queries, direction requests, call clicks), website traffic by source, and conversion rate by landing page can systematically reduce their dependence on expensive paid channels while building compounding organic visibility.
Key Performance Metrics Every Locksmith Should Track
- Call answer rate: target 90%+ (industry average is only 77%). Every 1% improvement in answer rate translates to approximately $960/year per weekly call at $185 average ticket.
- After-hours capture rate: with 39% of calls coming outside business hours, this metric directly measures revenue leakage.
- Cost per lead by channel: Google LSA averaging $34, Google Ads $180–$500, organic/SEO effectively $0 per marginal lead.
- Close rate by service type: emergency lockouts close at 75–88%, residential scheduled services at 20–35%, commercial at 20–30%.
- Average ticket by service: track changes over time to identify pricing power and service mix shifts.
- Customer acquisition cost (CAC): total marketing spend divided by new customers acquired — the single most important unit economics metric.
- Repeat customer rate: commercial and property management accounts generate recurring revenue that reduces dependence on one-time emergency calls.
Related reading
- 2026 Solar Energy Tracking & Analytics Report: Trends, Stats & Performance Data
- Surrogacy Analytics Statistics (2026)
- How accurate is B2B SaaS tech tracking data?
- Marketing Analytics services at Web Tonic
FAQ
How big is the U.S. locksmith market in 2026?
The U.S. locksmith industry generates $2.6–$2.9 billion in annual services revenue across approximately 26,000–29,000 establishments (IBISWorld, US Census). The market has been declining at a CAGR of −1.1% from 2021 to 2026 due to smart lock displacement and industry consolidation. Globally, the locksmith services market is growing at 5.6% CAGR, projected to reach $51.1 billion by 2033.
What percentage of calls do locksmiths miss?
The average locksmith misses 23% of incoming calls (IBISWorld data on small trade businesses). The median shop miss rate in 2026 is 34%, down from 38% in 2024, with the improvement driven by AI receptionist adoption among larger shops. Each missed emergency call represents approximately $185+ in lost revenue, and only 12% of callers who reach voicemail will call back.
How fast is the global locksmith market growing?
The global locksmith services market is growing at a CAGR of 5.6% from 2025 to 2033, projected to reach $51.1 billion from $31.2 billion in 2024 (Growth Market Reports). Growth is driven by rising security concerns, urbanization, smart lock complexity, and increasing adoption of advanced security technologies across residential, commercial, and automotive sectors.
What is the AI receptionist adoption rate among locksmiths?
Approximately 15% of locksmith shops with 3 or more trucks use AI receptionists in mid-2026, representing a 3.7× increase from approximately 4% in 2024 (TheKeyBot). Solo operators lag significantly at under 5% adoption. The early-adopter cohort shows measurably lower miss rates and captures after-hours emergency calls that competitors lose to voicemail.
What call tracking metrics matter most for locksmiths?
The three highest-impact call tracking metrics for locksmith businesses are: call answer rate (target 90%+, industry average 77%), after-hours capture rate (39% of calls come outside business hours), and cost per lead by channel (Google LSA averages $34, Google Ads $180–$500). Tracking these three metrics with dedicated call tracking software gives locksmiths the data needed to optimize staffing, ad spend, and marketing creative for maximum ROI.
Sources
IBISWorld — Locksmiths in the US Industry Analysis, 2026
TheKeyBot — State of the Locksmith Industry 2026
AgentZap — Locksmith Phone Statistics 2026
Growth Market Reports — Locksmith Services Market 2033
IMARC Group — Smart Lock Market Forecast 2034
Home Service Base — 2025 Locksmith Industry Statistics
Authority Specialist — Locksmith SEO Benchmarks 2026


