



Table of contents
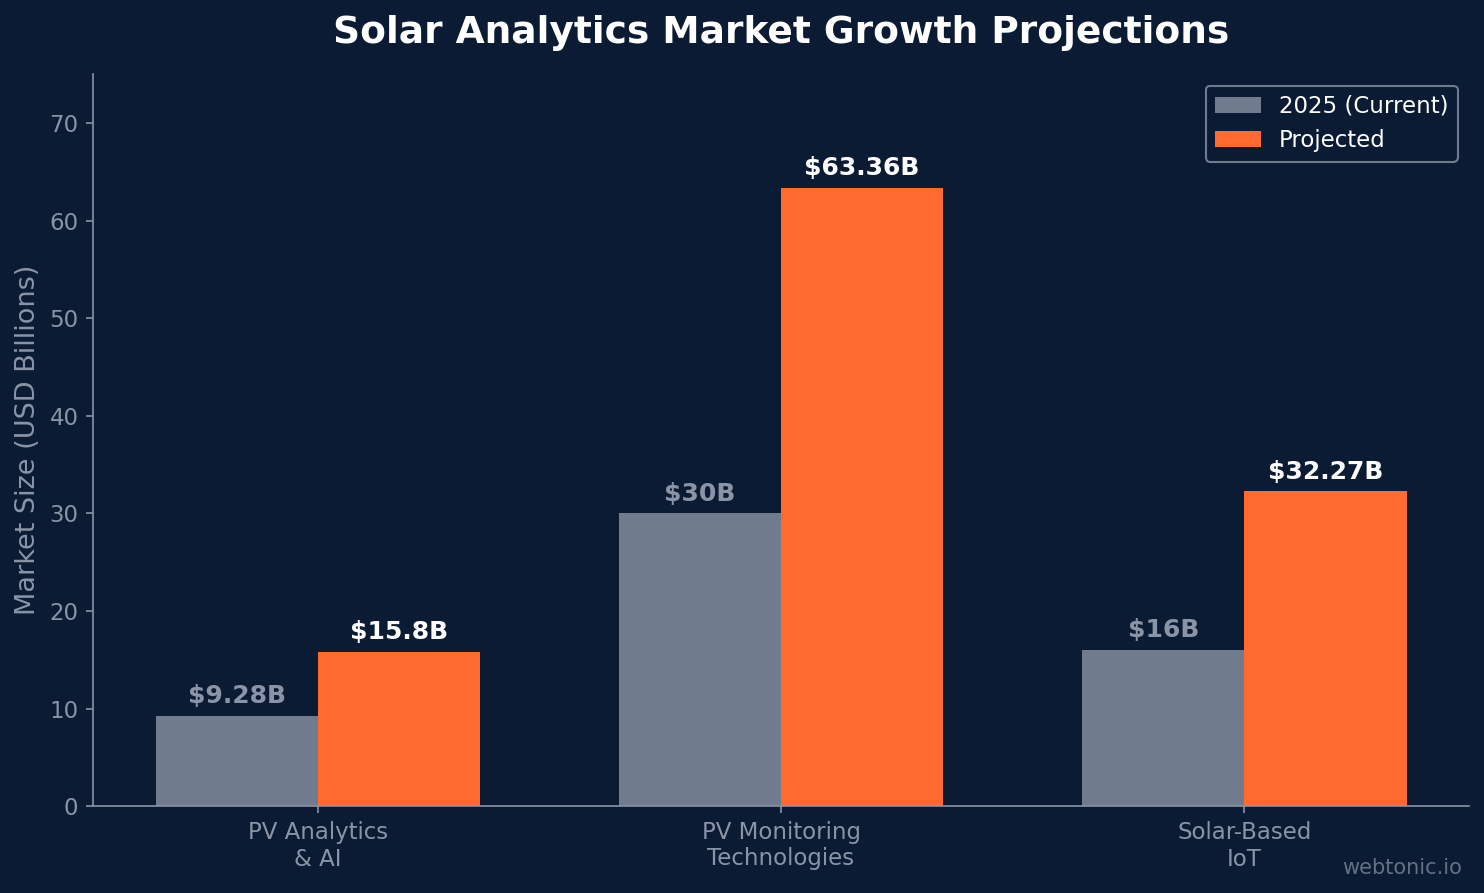
Solar energy analytics — from marketing attribution to IoT performance monitoring — now define which installers scale profitably and which plateau. The global solar PV analytics and AI market reached $9.28 billion in 2025 and is projected to hit $15.8 billion by 2034, while the broader PV monitoring technologies market is forecast to reach $63.36 billion by 2032. This article compiles the latest statistics on solar energy tracking, attribution, CRM analytics, and digital marketing measurement to help solar companies build data-driven growth systems.
Key Takeaways
- 89% of solar shoppers use search engines to research systems before contacting an installer (WifiTalents, 2026)
- Organic search drives 45% of high-quality leads for residential solar installers (WifiTalents, 2026)
- Solar-related searches in the U.S. grow more than 30% year over year (WifiTalents, 2026)
- The solar PV analytics and AI market is valued at $9.28 billion, projected to reach $15.8 billion by 2034 (MarketIntelo, 2025)
- PV monitoring technologies market is forecast to reach $63.36 billion by 2032 (OpenPR, 2026)
- Industry-wide lead-to-sale conversion rate sits at 8–12%, with top performers hitting 15%+ (BaaDigi, 2026)
- Speed-to-lead is the single biggest conversion differentiator — responding within 5 minutes converts at 3–5× the hourly response rate (Enervio, 2026)
- 68% of solar companies reported that SEO efforts led to a 45% increase in organic traffic (Gitnux, 2026)
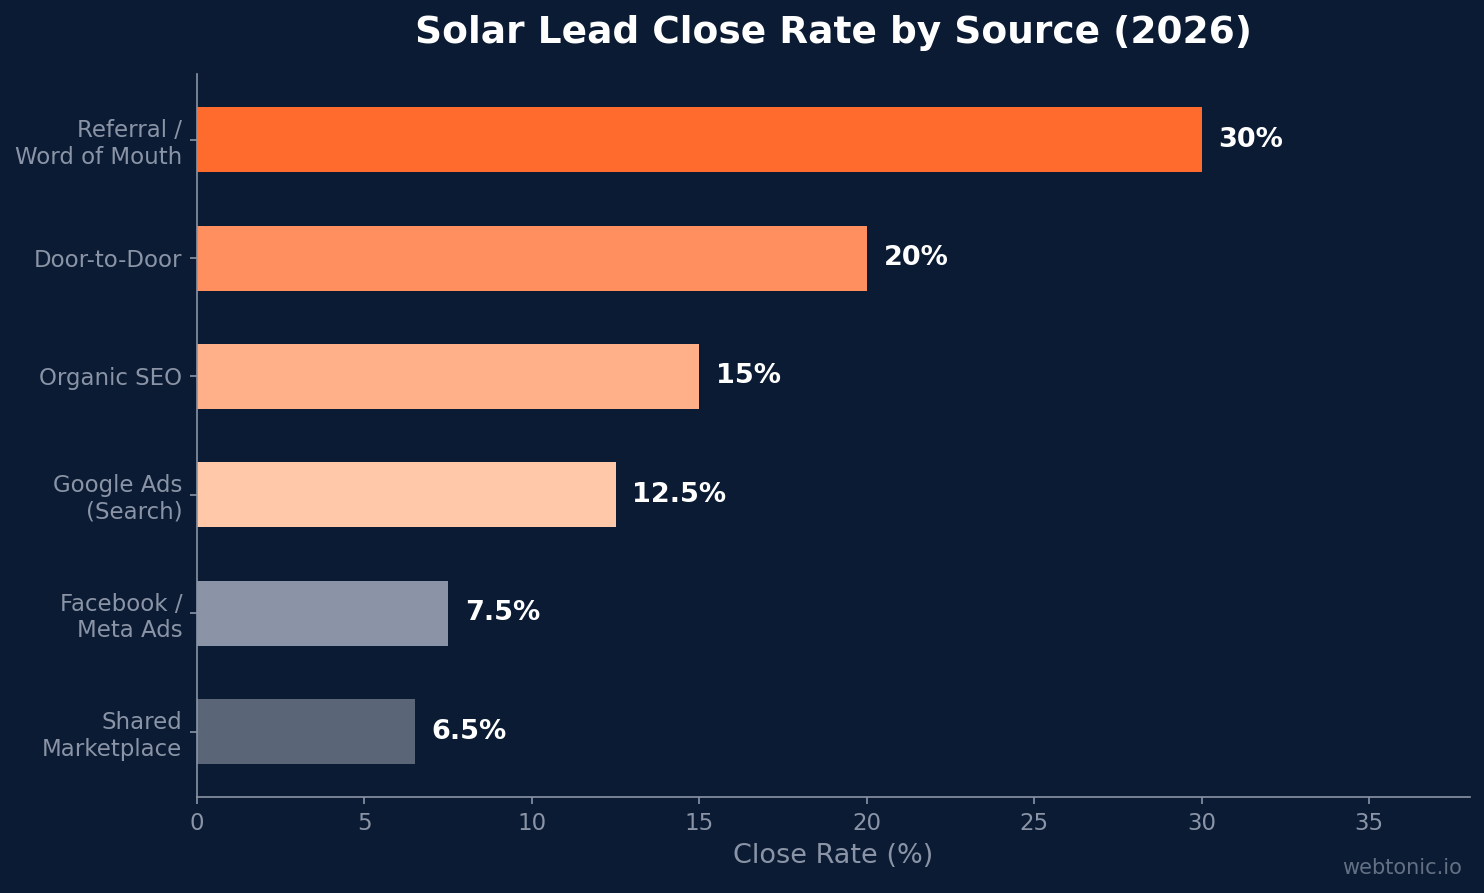
- Referral leads convert at ~30% compared to 5–8% for purchased/shared leads (BaaDigi, 2026)
- The U.S. residential solar market installed 6.2 GW in 2025 — a record (Daly Advertising, 2026)
Solar Energy Analytics Market at a Glance
| Segment | Market Size (2025) | Projected Size | CAGR |
|---|---|---|---|
| Solar PV Analytics & AI | $9.28 billion | $15.8B by 2034 | ~6.1% |
| PV Monitoring Technologies | ~$30 billion | $63.36B by 2032 | ~11.2% |
| Solar-Based IoT | ~$16 billion | $32.27B by 2031 | 10.04% |
| Global Solar Capacity (Installed) | ~1,900 GW | 3,100 GW by 2030 | ~10% |
| Analytics Spend Per MW | $1.50–$2.50/kW | $2.50–$4.00/kW | Growing with AI adoption |
Solar Marketing Attribution and Lead Tracking
Marketing attribution is the foundation of data-driven solar growth. Without proper tracking, solar companies cannot distinguish between channels that generate cheap leads and channels that generate profitable installations. The gap between cost per lead (CPL) and cost per acquired customer (CPAC) reveals which sources actually contribute revenue.
The best measurement systems track the full path from first click to closed deal: source, contact rate, appointment rate, show rate, proposal rate, close rate, cost per acquired customer, and source ROI. When a solar company measures only CPL, it misses what actually matters — whether its marketing creates qualified opportunities and profitable installs.
Multi-touch attribution is becoming essential for solar because the typical residential buyer goes through a 60- to 90-day research phase. They start with a Google search, read 3 to 5 articles, visit 2 to 3 installer websites, check reviews, and then request quotes from 2 to 4 companies. First-touch and last-touch attribution models each tell only part of the story. Solar companies that implement multi-touch attribution can accurately measure assisted conversions and allocate advertising budgets to the channels that actually influence purchasing decisions.
Solar Lead Funnel Analytics: Stage-by-Stage Benchmarks
Tracking the full conversion funnel — not just top-line lead volume — separates solar companies that scale from those that plateau. Each funnel stage has its own benchmark, and the bottleneck is rarely where companies assume it is.
| Funnel Stage | Benchmark | Top Performer | Diagnostic Signal |
|---|---|---|---|
| Lead Volume (Monthly) | 50–200 | 300+ | Channel mix & budget |
| Contact Rate | 60–70% | 85%+ | Speed-to-lead, call cadence |
| Appointment Set Rate | 30–40% | 50%+ | Lead quality, phone script |
| Show Rate | 70–80% | 90%+ | Confirmation cadence, pre-call |
| Proposal Rate | 60–75% | 85%+ | Property qualification |
| Close Rate | 8–12% | 15%+ | Pricing, financing, follow-up |
| Cost Per Acquired Customer | $1,500–$3,000 | Under $1,000 | Full funnel efficiency |
Speed-to-lead is the single biggest conversion differentiator in the solar funnel. Solar companies that respond to new leads within 5 minutes convert at 3× to 5× the rate of those responding within an hour. Yet many installers still take hours — or even a full business day — to make initial contact, leaving warm leads to cool and competitors to move in first.
Digital Marketing Analytics for Solar Companies
The digital analytics landscape for solar companies reveals a stark divide between companies that track everything and companies that track nothing meaningful. The data shows:
- 89% of solar shoppers use search engines to research systems before contacting a single installer
- Organic search drives 45% of high-quality leads for residential installers
- Solar-related search queries in the U.S. grow more than 30% year over year
- 68% of solar companies that invested in SEO reported a 45% increase in organic traffic from residential solar searches
- Content marketing focused on solar ROI achieves 2.5× higher engagement than general energy content
These statistics underscore why measuring channel ROI accurately matters more for solar than most verticals. The 60- to 90-day buying cycle means that last-click attribution dramatically undervalues awareness and research-phase touchpoints. Solar marketing teams that implement proper analytics see the real contribution of SEO content, educational videos, and retargeting campaigns that nurture prospects through the extended decision window.
Solar Performance Monitoring and IoT Analytics
Beyond marketing analytics, the solar industry's analytics ecosystem extends to operational performance monitoring — tracking the output, health, and financial performance of installed solar systems. This segment is growing rapidly as the installed base expands and data becomes central to business intelligence and customer retention.
The solar PV analytics and AI market reached $9.28 billion in 2025 and is projected to hit $15.8 billion by 2034. The growth drivers include:
- 3,100 GW of projected global solar capacity by 2030 — each megawatt requiring ongoing monitoring and optimization
- Average analytics spend of $1.50 to $2.50 per kilowatt for performance monitoring platforms
- AI-powered predictive maintenance reducing unplanned downtime by 20–35% and extending asset life
- Real-time KPI dashboards covering active power, energy generated, inverter status, and financial yield
The solar-based IoT market is growing at a CAGR of 10.04%, projected to reach $32.27 billion by 2031. PV monitoring technologies, which include inverter-level monitoring, string-level tracking, and AI-driven anomaly detection, represent an even larger opportunity at $63.36 billion by 2032.
Conversion Rate Analytics by Lead Source
| Lead Source | Avg. CPL | Close Rate | Cost Per Acquisition | Quality Rating |
|---|---|---|---|---|
| Google Ads (Search) | $80–$250 | 10–15% | $800–$1,700 | High intent |
| Facebook / Meta Ads | $22–$120 | 5–10% | $440–$1,200 | Volume, moderate intent |
| Organic SEO | $15–$50 | 12–18% | $125–$280 | High quality, slow |
| Referral / Word of Mouth | $0–$25 | ~30% | Under $100 | Highest quality |
| Shared Marketplace Leads | ~$110 | 5–8% | $1,375–$2,200 | Low — sold to 3–5 companies |
| Door-to-Door | $50–$150 | 15–25% | $333–$600 | High — in-person trust |
The analytics lesson from this data is clear: measuring only cost per lead systematically misallocates budget. A channel with $200 CPL and a 15% close rate delivers customers at $1,333 each, while a channel with $50 CPL and a 3% close rate delivers customers at $1,667 — despite appearing four times cheaper at the top of the funnel. Full-funnel analytics and attribution reverse these distortions.
Global Solar Energy Market: Key Data Points for Analytics Context
To contextualize the analytics landscape, it helps to understand the scale of the global solar energy market that generates this data. The United States installed 6.2 GW of residential solar in 2025 — a record — contributing to the country's total installed solar capacity of over 200 GW. Globally, solar power generation capacity surpassed 1,900 GW in 2025, with projections reaching 3,100 GW by 2030.
The growth in renewable energy analytics demand is driven by this expanding installed base. China leads global solar capacity with over 700 GW installed, followed by the United States, India, Germany, and the EU collectively. Europe continues to expand solar power generation, with Germany alone accounting for over 85 GW. Emerging markets in India and across Asia-Pacific are accelerating solar installations, creating demand for analytics platforms that can monitor distributed solar assets across diverse regulatory environments.
Energy storage integration is reshaping solar analytics requirements. As battery storage pairs with solar power generation systems, analytics platforms must track charge cycles, degradation rates, and grid arbitrage performance alongside traditional generation metrics. The global energy storage market reached $15.1 billion in 2025, and this convergence with solar data analytics is creating new demand for integrated monitoring platforms that cover the full generation-storage-consumption stack.
According to IRENA's Renewable Energy Statistics 2026 report, newly installed renewable power generation capacity in 2025 continued to accelerate, with solar representing the majority of new capacity additions globally. These statistics underscore the scale of the analytics opportunity: every GW of installed solar capacity requires ongoing performance monitoring, predictive maintenance, and financial reporting — creating a multi-billion-dollar recurring demand for data analytics solutions in the solar industry.
CRM and Pipeline Analytics Best Practices for Solar
Solar CRM analytics transform a single conversion metric into a diagnostic tool. The best solar companies track stage-level conversion rates on a rolling 30-day basis, identifying exactly where deals stall before revenue is lost. Key CRM analytics practices backed by data include:
- Track stage aging. Deals that sit in "proposal sent" for more than 14 days close at less than half the rate of deals that advance within 7 days. Stage aging alerts catch stalled deals before they go cold.
- Segment by lead source. Google Ads leads may close at 15% while shared marketplace leads close at 5% — but without source-level tracking, the blended 10% rate hides critical information about where to invest.
- Build a lead scorecard. Assign points based on property fit (roof age, orientation, shading), financing readiness, timeline urgency, and engagement signals (email opens, page visits). Prioritize high-scoring leads for immediate follow-up.
- Measure marketing efficiency ratio (MER). Total revenue divided by total marketing spend provides a holistic view of marketing productivity that complements channel-specific attribution.
- Review performance weekly. Monthly reviews are too infrequent for solar sales cycles. Weekly pipeline reviews catch declining contact rates, rising no-show rates, and channel shifts before they compound into quarterly losses.
Related reading
- Solar Marketing Attribution: The 2026 Numbers That Decide Budget
- Solar Energy Industry x Dashboards & Reporting: 2026 Statistics
- Solar Energy Email Marketing Statistics: 2026 Benchmarks, Open Rates & ROI Data
- Marketing Analytics services at Web Tonic
FAQ
What are the most important analytics KPIs for solar companies?
The most critical KPIs form a complete funnel: lead volume by source, contact rate, appointment set rate, show rate, proposal rate, close rate, cost per acquired customer, and source ROI. Tracking only cost per lead is insufficient because it does not capture lead quality or downstream conversion behavior.
How large is the solar analytics market?
The solar PV analytics and AI market reached $9.28 billion in 2025 and is projected to reach $15.8 billion by 2034. The broader PV monitoring technologies market is forecast to hit $63.36 billion by 2032, driven by expanding installed capacity and AI-powered optimization.
What is a good solar lead conversion rate?
The industry-wide lead-to-sale close rate is 8–12%, with top-performing solar companies achieving 15%+. Conversion rates vary significantly by source: referral leads close at approximately 30%, while purchased or shared marketplace leads convert at just 5–8%.
Why does speed-to-lead matter for solar analytics?
Solar companies that respond within 5 minutes convert at 3–5× the rate of those responding within an hour. Speed-to-lead is a measurable, trackable KPI that directly impacts close rates, making it one of the highest-leverage analytics metrics in the solar sales process.
How should solar companies measure marketing ROI?
Track the full path from click to closed deal using multi-touch attribution. Compare cost per acquired customer (not just CPL) across channels. Implement source-level CRM tracking and review pipeline analytics weekly to catch performance shifts early. The marketing efficiency ratio (total revenue ÷ total marketing spend) provides a holistic productivity metric.
Sources
baadigi.com/tools/benchmarks/solar
wifitalents.com/marketing-in-the-solar-industry-statistics
enervio.io/blog/how-to-measure-solar-lead-generation-success
gitnux.org/marketing-in-the-solar-industry-statistics
dalyadvertising.com/blog/solar-marketing
marketintelo.com/report/solar-pv-analytics-ai-market
transparencymarketresearch.com — solar IoT market
marketsandata.com/industry-reports/solar-based-iot-market


