



Table of contents

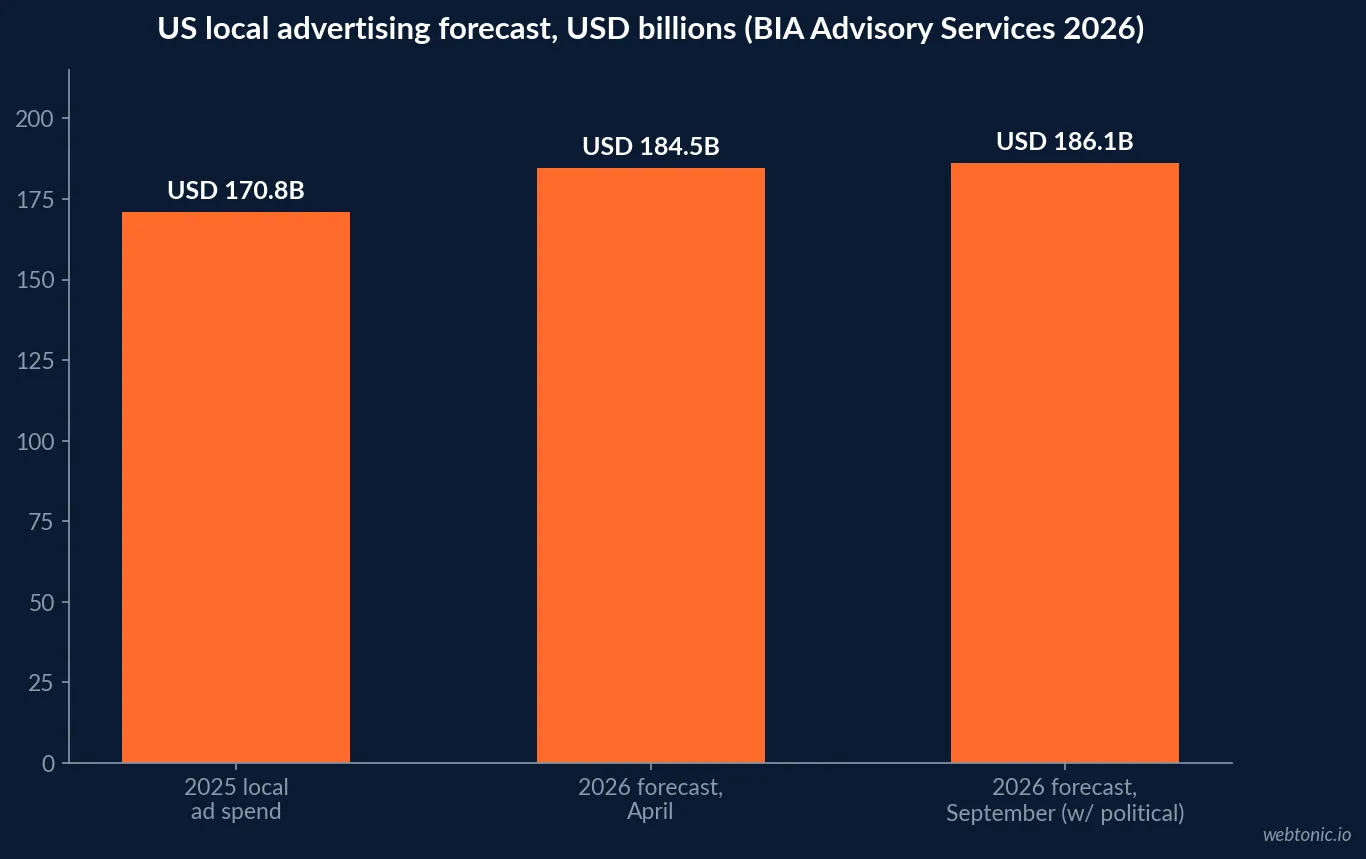
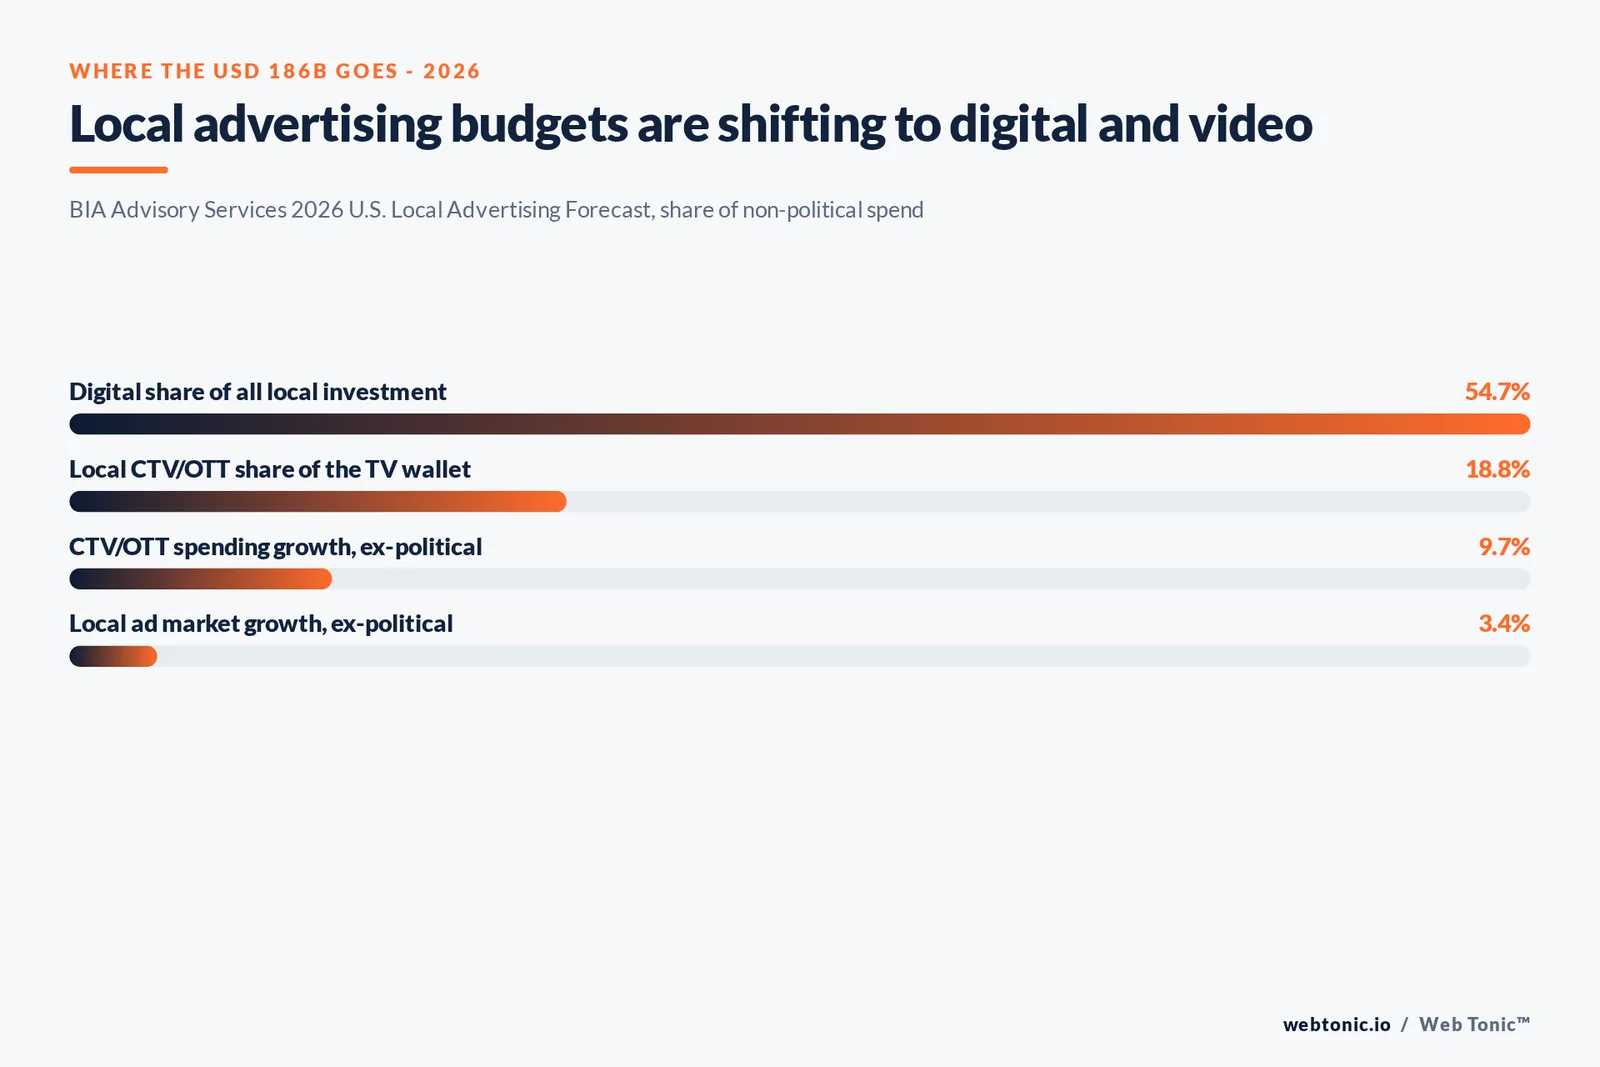
The 2026 local advertising headline number is inflated by an election cycle, and the real story is underneath it. BIA Advisory Services now forecasts total US local ad revenue at USD 186.1 billion for 2026, roughly 9% above 2025 - but its own 2026 Opportunities Report states that stripping out political spend, the underlying local ad market grew only 3.4%, with 54.7% of that non-political money already flowing to digital channels. This page separates the two numbers and tracks where the real budget shift is happening.
Key Takeaways
- US local ad revenue is forecast at USD 186.1 billion in 2026 (BIA Advisory Services, Sept. 2026).
- That is up from an April 2026 estimate of USD 184.5 billion.
- Headline growth is roughly 9% year over year, driven largely by political spend.
- Stripped of political spend, growth is only 3.4% (BIA 2026 Opportunities Report).
- Digital captures 54.7% of all non-political local ad investment.
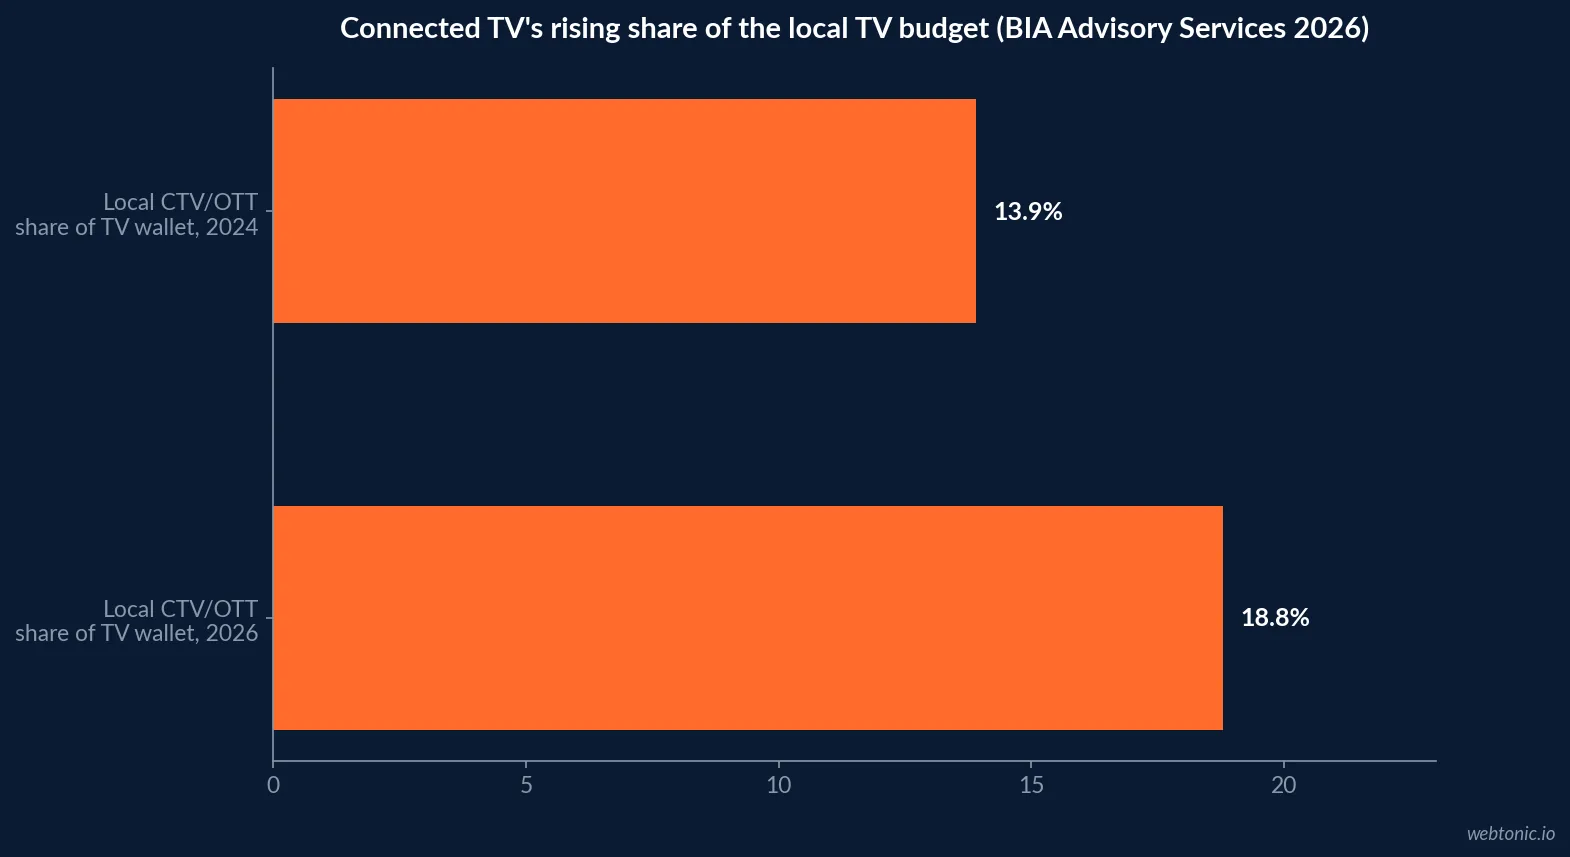
- Local CTV/OTT's share of the TV wallet climbs from 13.9% in 2024 to 18.8% in 2026.
- That is a 35.3% relative increase, excluding political money.
- Local CTV/OTT spending reaches USD 3.6 billion in 2026.
- CTV/OTT spending grows 9.7% ex-political, well above the market's overall 3.4%.
- Nearly 40% of small businesses plan to raise marketing budgets in 2026 (LocaliQ).
- 54% plan to hold spending flat rather than cut it.
- Almost 9 in 10 CTV advertisers say it improves omnichannel campaign performance (Premion).
- 70% of CTV advertisers plan to increase spending in 2026.
- TV over-the-air plus digital/OTT revenue is projected at USD 19.8 billion in 2026 (BIA).
The headline number, and the number underneath it
BIA Advisory Services' September 2026 update to its U.S. Local Advertising Forecast puts total local ad revenue at USD 186.1 billion, up USD 1.6 billion from its April estimate of USD 184.5 billion and roughly 9% above 2025. BIA is explicit that political spending tied to the 2026 election cycle is doing most of that lifting.
Its 2026 Opportunities Report gives the number that matters to a local advertiser without a campaign budget: stripped of political spend, local ad revenue is projected to grow just 3.4% this year.
| Local ad market fact (2026) | Figure | Source | Includes political spend? |
|---|---|---|---|
| Total local ad revenue, Sept. forecast | USD 186.1B | BIA Advisory Services | Yes |
| Total local ad revenue, April forecast | USD 184.5B | BIA Advisory Services | Yes |
| Year-over-year growth, headline | ~9% | BIA Advisory Services | Yes |
| Year-over-year growth, ex-political | 3.4% | BIA 2026 Opportunities Report | No |
| Digital share of non-political spend | 54.7% | BIA 2026 Opportunities Report | No |
Where the ex-political growth is concentrated
Connected TV is the standout inside BIA's non-political numbers. Local CTV/OTT's share of the local TV wallet climbs from 13.9% in 2024 to 18.8% by 2026, a 35.3% relative increase excluding political money, with local CTV/OTT spending reaching USD 3.6 billion this year. BIA separately projects CTV/OTT spending to grow 9.7% ex-political in 2026 - nearly triple the 3.4% rate for the local market as a whole - meaning CTV is absorbing a disproportionate share of every incremental non-political local dollar.
Advertiser confidence backs the CTV shift
The budget shift lines up with how advertisers say they feel about the channel. Premion's 2026 CTV/OTT Advertiser Survey, run with Advertiser Perceptions, found nearly nine in ten CTV advertisers agree that including CTV/streaming TV in an omnichannel campaign improves overall performance, and a related industry survey found 70% of CTV advertisers plan to increase spending in 2026. That confidence is a leading indicator for BIA's own CTV growth forecast, not a coincidence running parallel to it.
| CTV/local video fact (2026) | Figure | Source |
|---|---|---|
| Local CTV/OTT share of TV wallet, 2024 | 13.9% | BIA Advisory Services |
| Local CTV/OTT share of TV wallet, 2026 | 18.8% | BIA Advisory Services |
| Local CTV/OTT spending, 2026 | USD 3.6B | BIA Advisory Services |
| CTV/OTT growth rate, ex-political | 9.7% | BIA Advisory Services |
| CTV advertisers citing improved performance | ~90% | Premion / Advertiser Perceptions |
| CTV advertisers planning to increase spend | 70% | Advertiser Perceptions / Premion |
Why the economics still favor local digital spend
Google's Economic Impact report estimates that Google Search, Play, Cloud, YouTube and advertising tools helped generate USD 947 billion of economic activity for American businesses in 2025, and its published methodology attributes an average return of USD 8 in profit for every USD 1 a business spends on Google Ads. That return math is the backdrop for BIA's digital-share number: local advertisers are not moving toward digital because it is fashionable, they are moving toward it because the return-on-spend math for search and video keeps outperforming the return math for undifferentiated reach.
What small businesses actually say about next year's budget
Constant Contact's Q1 2026 Small Business Now report, surveying over 1,500 small business owners, found 68% plan to increase marketing budgets despite inflation ranking as their top concern at 41%, and only 14% expect budgets to decrease. 74% expect to spend more time on marketing this year, and the top anticipated barrier is customer engagement at 44%, which is pushing 50% of owners toward efficiency strategies and 33% toward testing new tools.
That mindset - spend more, but spend it more efficiently - is consistent with BIA's finding that digital and CTV, both more measurable than traditional local media, are absorbing a disproportionate share of the incremental budget.
| Small business budget signal (2026) | Figure | Source |
|---|---|---|
| SMBs planning to increase marketing budget | 68% | Constant Contact Q1 2026 |
| SMBs citing inflation as top concern | 41% | Constant Contact Q1 2026 |
| SMBs expecting budgets to decrease | 14% | Constant Contact Q1 2026 |
| SMBs planning to spend more time on marketing | 74% | Constant Contact Q1 2026 |
| SMBs planning to raise budgets (LocaliQ figure) | ~40% | LocaliQ 2026 |
| SMBs planning to hold budgets flat | 54% | LocaliQ 2026 |
Why review volume is becoming its own local ad line
Local advertising increasingly has to compete with, and route through, review visibility. BrightLocal's 2026 Local Consumer Review Survey finds 97% of consumers read reviews for local businesses, and 31% will only use a business with a rating of 4.5 stars or higher - up sharply from 17% the year before. Seven in ten consumers, 68%, will only use a business with four stars or more. A media plan that drives clicks to a listing with thin or aging reviews is spending against a conversion ceiling the ad itself cannot fix.
That is a reason to budget for review generation and response alongside paid local media, not after it - our growth marketing practice treats the two as one funnel rather than separate line items.
What small businesses are actually doing with their budgets
At the buyer level, LocaliQ's Big Small Business Marketing Trends Report for 2026 finds nearly 40% of small businesses plan to increase marketing budgets this year, building on almost half doing so in 2025, while a majority - 54% - plan to hold spending flat rather than cut it. That is a market expanding steadily rather than reallocating sharply, which fits the 3.4% ex-political growth BIA reports at the aggregate level.
Our growth marketing practice helps local and multi-location advertisers decide how much of that incremental budget should follow BIA's digital and CTV growth curve versus staying in channels that already work for their category.
Where hyperlocal platforms fit inside the budget
Below the BIA-tracked channel mix sits a growing hyperlocal layer. Nextdoor's own 2026 small business research finds 66% of SMB owners active on the platform are directly responsible for their business's purchasing decisions, and among advertisers already running campaigns there, 53% rate results on par with other platforms while one in five report results typically better than elsewhere. 51% of Nextdoor advertisers plan to maintain or increase that investment over the next six months - a small but telling signal that hyperlocal, trust-based platforms are holding their own budget share even as the bigger digital and CTV numbers dominate the aggregate forecast.
| Hyperlocal advertiser signal (2026) | Figure | Source |
|---|---|---|
| SMB owners who are the purchasing decision-maker | 66% | Nextdoor 2026 SMB research |
| Advertisers rating results on par with other platforms | 53% | Nextdoor 2026 SMB research |
| Advertisers rating Nextdoor results better | ~20% (1 in 5) | Nextdoor 2026 SMB research |
| Advertisers planning to maintain or increase spend | 51% | Nextdoor 2026 SMB research |
Digital out-of-home is pulling local budgets the same direction
The digital-over-traditional pattern BIA reports for local media broadly shows up again inside out-of-home specifically. Vistar Media's 2026 DOOH Momentum Report found 87% of surveyed brands and agencies increased their programmatic digital out-of-home investment over the past 12 months, and 90% expect to invest more in the year ahead - investment the report describes as planned and repeatable rather than opportunistic. That is the same pattern as BIA's local CTV growth: advertisers are not testing digital formats at the margin, they are committing budget to them on purpose.
| Digital-format local ad signal (2026) | Figure | Source | Channel |
|---|---|---|---|
| Brands/agencies increasing programmatic DOOH spend | 87% | Vistar Media 2026 DOOH Momentum Report | Digital out-of-home |
| Brands/agencies planning to invest more next year | 90% | Vistar Media 2026 DOOH Momentum Report | Digital out-of-home |
| Local CTV/OTT growth, ex-political | 9.7% | BIA Advisory Services | Connected TV |
| Overall local ad market growth, ex-political | 3.4% | BIA Advisory Services | All channels |
Reading a local ad budget request against these numbers
Any 2026 local ad plan should separate the political-inflated headline from the underlying trend the way BIA itself does. The market is not growing 9% for a typical local advertiser; it is growing roughly a third of that, with digital and connected TV absorbing most of the real increase. A budget built on the headline number risks overestimating how much organic lift is actually available outside an election cycle.
If you want your local media mix modeled against these forecasts, talk to us, or read our related breakdown of what local search advertising costs before setting next year's channel split.
Frequently Asked Questions
How big is the US local advertising market in 2026?
BIA Advisory Services' September 2026 update puts total local ad revenue at USD 186.1 billion, up USD 1.6 billion from its April estimate of USD 184.5 billion and roughly 9% higher than 2025. That growth is heavily political: BIA's own 2026 Opportunities Report states that stripping out political spend, local ad revenue is projected to grow only 3.4% for the year, with digital capturing 54.7% of all non-political local investment.
Where is the growth inside local advertising actually coming from?
Digital and connected TV. BIA's 2026 Opportunities Report shows local CTV/OTT's share of the local TV wallet climbing from 13.9% in 2024 to 18.8% by 2026, a 35.3% relative increase excluding political spend, with local CTV/OTT spending reaching USD 3.6 billion in 2026. That growth is running well ahead of the 3.4% ex-political rate for the local ad market overall.
How much are small businesses actually spending on local marketing?
Most spend modestly and plan to raise it slightly. LocaliQ's Big Small Business Marketing Trends Report for 2026 finds nearly 40% of small businesses plan to increase their marketing budgets this year, following almost half doing so in 2025, while a majority (54%) plan to hold spending flat rather than cut it - a sign of steady, not explosive, local budget growth heading into next year.
Are advertisers actually confident in connected TV as a local channel?
Yes, and increasingly so. Premion's 2026 CTV/OTT Advertiser Survey, run with Advertiser Perceptions, found nearly nine in ten CTV advertisers agree that including CTV/streaming TV in an omnichannel campaign improves overall performance, and a related survey found 70% of CTV advertisers plan to increase their spending in 2026 - consistent with BIA's own local CTV growth numbers.
Is political advertising skewing every local ad statistic this year?
For 2026, yes, materially. BIA's own reporting draws the distinction explicitly: the headline USD 186.1 billion figure and its roughly 9% year-over-year growth both include political spend tied to the 2026 election cycle, while the ex-political growth rate of 3.4% is the number that describes what a typical local advertiser without a campaign budget actually experienced.
Sources
BIA Advisory Services - 2026 Local Advertising Forecast update, September 2026
BIA Advisory Services - April 2026 forecast revision
BIA Advisory Services - 2026 Opportunities Report
LocaliQ - The Big Small Business Marketing Trends Report for 2026
Premion / Advertiser Perceptions - 2026 CTV/OTT Advertiser Survey
Google - Economic Impact report
Constant Contact - Q1 2026 Small Business Now report
BrightLocal - 2026 Local Consumer Review Survey
Nextdoor - Small Business Owners on Nextdoor, 2026
Vistar Media - 2026 DOOH Momentum Report


