



Table of contents
A 5% improvement in customer retention can lift profit by 25% to 95%, according to Bain & Company's original research - a decades-old finding that still sets the frame for every lifecycle and retention program built since. This page pulls together the cross-industry benchmarks - churn by business model, automation's share of revenue, and how personalization teams rate their own programs - that a marketing team can use before picking a single tactic.
Key Takeaways
- A 5% retention gain lifts profit by 25% to 95%, per Bain's original research.
- Median SaaS annual churn is 3.04% to 3.22% across the Recurly network in 2026.
- B2B professional services run 3.21% to 3.44% median annual churn.
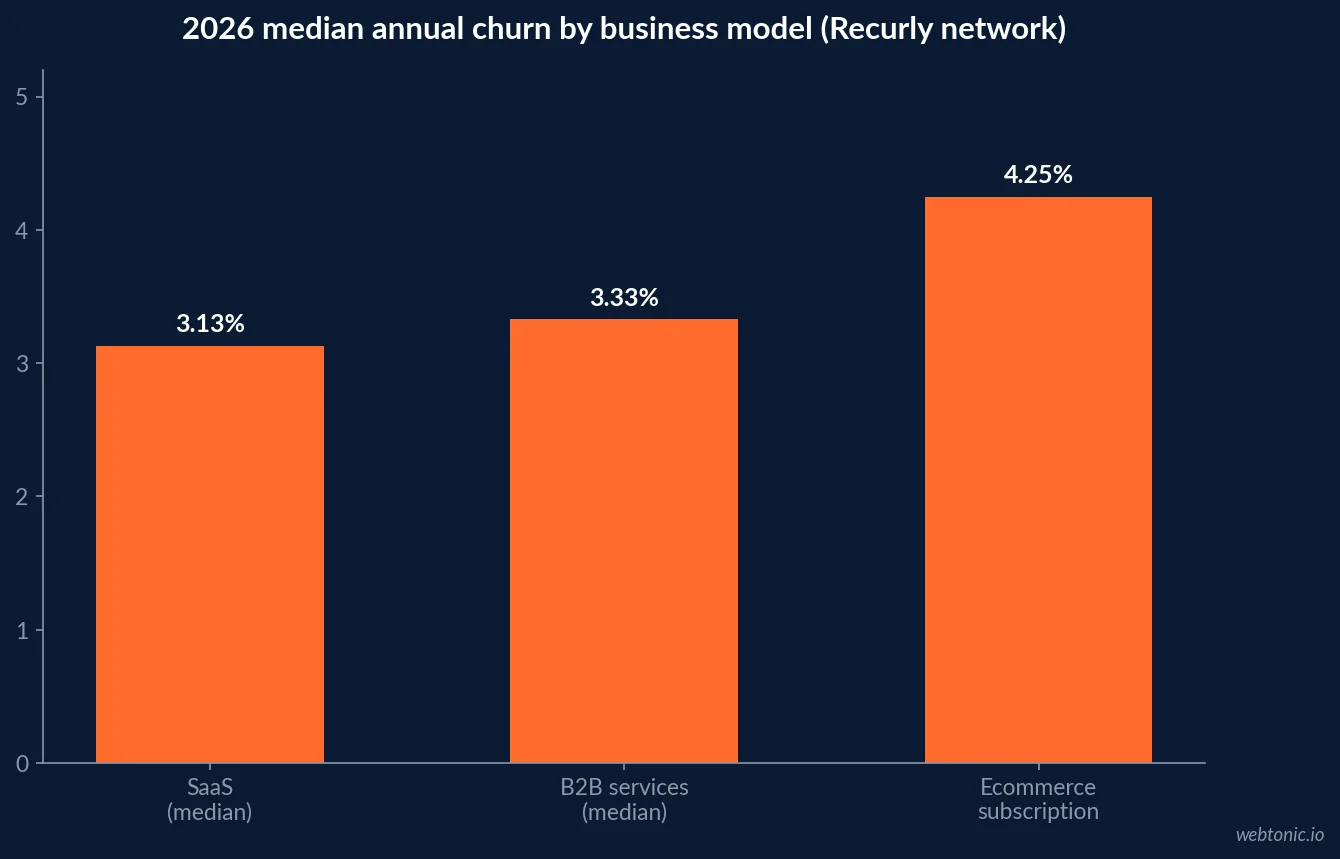
- Ecommerce subscription boxes run 4.25% median annual churn - nearly double SaaS.
- Enterprise SaaS above USD 250 ARPC churns at 3.54%, with involuntary churn of only 0.18%.
- Early-stage SaaS under USD 300k ARR churns at 6.5% a month, per ChartMogul.
- Mature SaaS over USD 8 million ARR churns at 3.1% a month.
- Top-decile SaaS companies post negative net churn (expansion exceeds losses).
- Email flows generate 41% of email revenue from 5.3% of sends, per Klaviyo 2026 data.
- Flow revenue per recipient runs about 18 times higher than campaign revenue per recipient.
- Nearly 48% of flow-driven revenue comes from new buyers, versus 16% for campaigns.
- Automations are 2% of sends but drive 30% of revenue, per Omnisend's 2026 report.
- Automated emails earn USD 2.87 per send versus USD 0.18 for campaigns - a 16x gap.
- Automated sends convert at 19 times the rate of scheduled campaigns, per Omnisend.
- 89% of business leaders call personalization crucial to growth, per Twilio Segment.
- Over 70% of brands expect AI to change personalization strategy fundamentally.
- 61% worry inaccurate data is undermining AI-driven personalization.
- Below 2% annual churn is strong performance in almost any vertical, per Recurly.
| Metric (2026 unless noted) | Figure | Source |
|---|---|---|
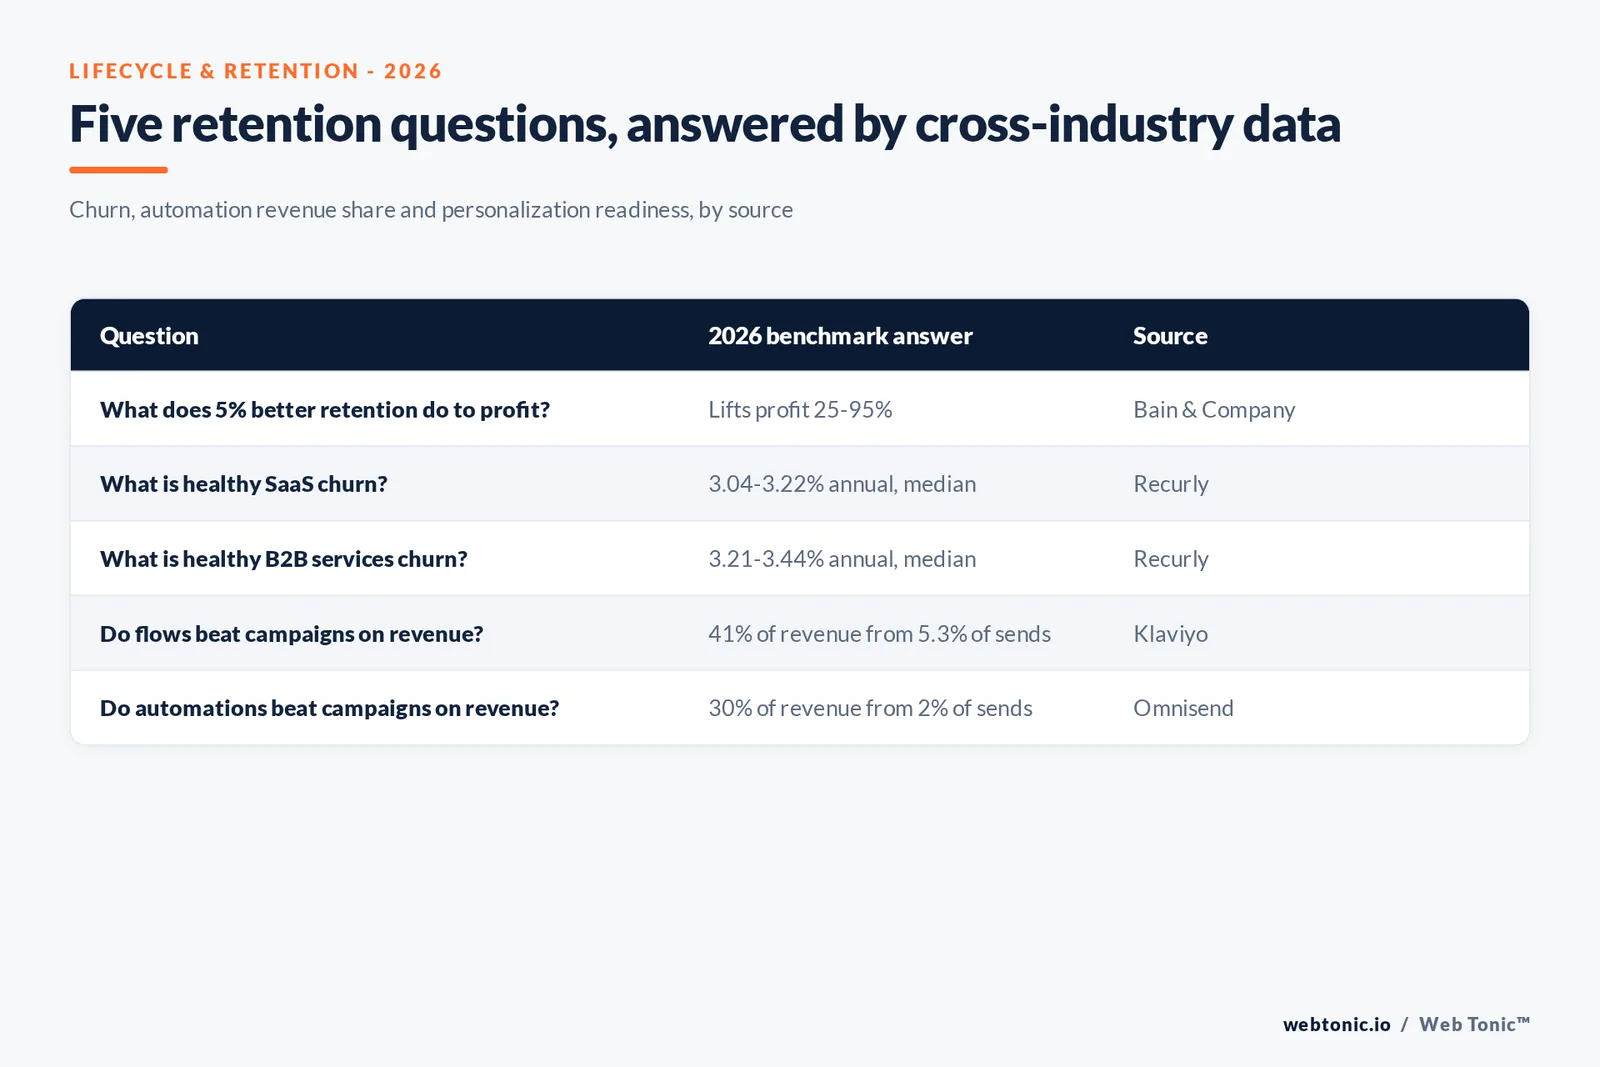
| Retention-to-profit multiplier | 5% retention gain -> 25-95% profit lift | Bain & Company (original research) |
| Median SaaS annual churn | 3.04%-3.22% | Recurly network, July 2026 |
| Median B2B services annual churn | 3.21%-3.44% | Recurly network, July 2026 |
| Median ecommerce subscription churn | 4.25% | Recurly network, July 2026 |
| Email flow share of revenue | ~41% of revenue from 5.3% of sends | Klaviyo 2026 Benchmarks |
| Automation share of email revenue | 30% of revenue from 2% of sends | Omnisend 2026 Ecommerce Report |
| Leaders who call personalization crucial | 89% | Twilio Segment, State of Personalization 2024 |
The finding that started retention economics
Bain & Company's Loyalty Rules research - the source most retention programs still cite - found that an increase in customer retention rates of 5 percent increases profits by 25 percent to 95 percent. The mechanism is life-cycle economics: early customer relationships are unprofitable because acquisition costs are front-loaded, and profit accelerates only in later years as service costs fall and purchase volume rises. Bain's own e-commerce analysis found this pattern exaggerated online, where new-customer costs run 20% to 40% higher than traditional retail.
That is the argument for treating retention as a profit lever, not a satisfaction score. Everything below is the current, dated evidence for how to measure it by business model.
Churn benchmarks differ sharply by business model
Recurly's churn-rate benchmarks, updated with July 2026 data across its subscription network, put median SaaS annual churn at 3.04% to 3.22% depending on segment definition, with top-quartile SaaS performers at 1.78% or below. Business and Professional Services run a 3.21% to 3.44% median, generally lower than consumer subscriptions because of longer contract cycles and higher switching costs. Ecommerce subscription boxes sit at a 4.25% median - lower price points and impulse-driven signups push voluntary churn higher. Enterprise SaaS above USD 250 average revenue per customer runs 3.54% median churn with involuntary churn of only 0.18%, because higher-value subscribers use better payment methods.
Recurly's own read: below 2% annual churn is strong performance almost anywhere, 2% to 4% is where most well-run subscription businesses operate, and above 5% is worth investigating regardless of vertical.
| Business model (2026) | Median annual churn | Top-quartile churn | Source |
|---|---|---|---|
| SaaS / software | 3.04%-3.22% | 1.78% or below | Recurly |
| B2B professional services | 3.21%-3.44% | 1.83% or below | Recurly |
| Ecommerce subscription box | 4.25% | Not broken out | Recurly |
| Enterprise SaaS (USD 250+ ARPC) | 3.54% | Involuntary churn 0.18% | Recurly |
Early-stage SaaS (| 6.5% monthly customer churn | Best-in-class 0.2% | ChartMogul | |
| Mature SaaS (USD 8M+ ARR) | 3.1% monthly customer churn | Best-in-class 1.3% | ChartMogul |
Churn also moves with company stage, not just vertical
ChartMogul's benchmark data, aggregated and anonymized from over 2,500 SaaS businesses, shows churn compressing as companies mature: a median early-stage company under USD 300k ARR runs a 6.5% monthly customer churn rate, a company between USD 1-3M ARR runs 3.7%, and a company above USD 8M ARR runs 3.1%. Gross MRR churn tells the harsher story: a bottom-quartile early-stage company loses 16.5% of recurring revenue a month to churn, against 2.5% for the best-in-class cohort at the same stage.
The gap between best-in-class and bottom-quartile at every single ARR band is the real lesson - stage explains some of the variance, but operating discipline explains most of it.
Automation is where lifecycle revenue actually lives
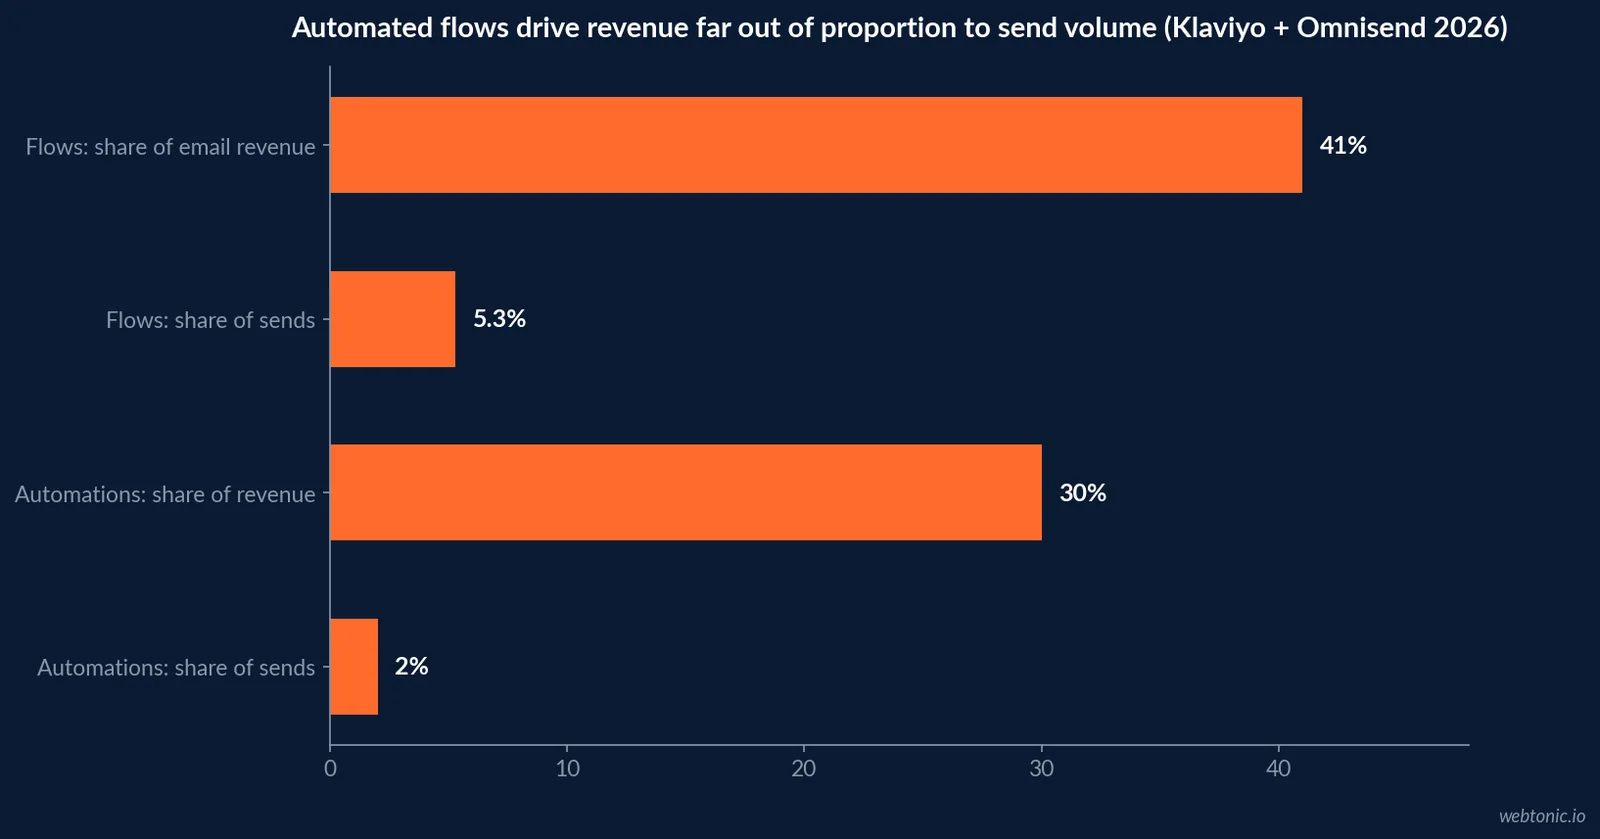
Klaviyo's 2026 email marketing benchmarks, based on more than 183,000 customers, found that flows drive the majority of send volume's opposite: campaigns are 94.7% of sends but flows generate nearly 41% of total email revenue from just 5.3% of sends, with average revenue per recipient roughly 18 times higher. Flows also convert new buyers at scale - nearly 48% of flow-driven revenue comes from new buyers, against 16% for campaigns - because welcome, browse and abandonment flows fire at the first-purchase moment.
Omnisend's 2026 ecommerce marketing report, drawn from 150,000 brands and 27 billion emails, finds the same pattern from a different data set: automations are just 2% of email sends but drive 30% of total email-driven revenue, earning USD 2.87 per send against USD 0.18 for scheduled campaigns - a 16x difference. Automated messages also post 24% higher open rates, 6 times the click engagement and 19 times the conversion rate of scheduled sends.
| Automation metric (2026) | Flows / automations | Campaigns | Source |
|---|---|---|---|
| Share of sends | 5.3% | 94.7% | Klaviyo |
| Share of email revenue | ~41% | ~59% | Klaviyo |
| Revenue per recipient, relative | ~18x | 1x (baseline) | Klaviyo |
| New-buyer share of revenue | ~48% | ~16% | Klaviyo |
| Share of sends (separate dataset) | 2% | 98% | Omnisend |
| Share of revenue (separate dataset) | 30% | 70% | Omnisend |
| Revenue per send | USD 2.87 | USD 0.18 | Omnisend |
Personalization is the layer teams say they cannot skip
Twilio Segment's State of Personalization Report (2024, its fifth annual edition) found that 89% of business leaders believe personalization is crucial to their business's success over the next three years, and over 70% of brands agree AI adoption will fundamentally change personalization and marketing strategy. The same report is candid about the dependency underneath that ambition: 61% of companies worry that inaccurate data is undermining their AI-driven personalization efforts - a data-quality problem, not a strategy problem.
That gap between ambition and data readiness is the practical argument for building the churn and flow-revenue measurement habits above before adding another personalization layer on top of them.
What a lifecycle-stage scorecard should track
Put a single number against each stage rather than one blended "retention rate." Recurly's segment data and Klaviyo/Omnisend's automation data answer different questions, and a scorecard should keep them separate: churn by cohort and ARR band for subscription revenue, and flow-versus-campaign revenue share for transactional or ecommerce revenue.
| Lifecycle stage | What to track | Benchmark to compare against | Source |
|---|---|---|---|
| First 90 days | New-buyer revenue share from flows | ~48% of flow revenue is new buyers | Klaviyo |
Early relationship (| Monthly customer churn | 6.5% median, 0.2% best-in-class | ChartMogul | |
| Steady state (subscription) | Annual churn by vertical | SaaS 3.04-3.22%, services 3.21-3.44% | Recurly |
| Steady state (ecommerce) | Automation revenue share | 30% of revenue from 2% of sends | Omnisend |
| Mature relationship (USD 8M+ ARR) | Monthly customer churn | 3.1% median, 1.3% best-in-class | ChartMogul |
| Every stage | Data quality behind personalization | 61% flag inaccurate data as a risk | Twilio Segment |
Where this differs by industry
The benchmarks above describe subscription, SaaS and ecommerce businesses because that is where churn and automation revenue are measured at scale. Local and trade businesses - pest control, tax and accounting, solar, HVAC, dental - run on a different lifecycle: service agreements, recall visits, referrals and reviews rather than monthly recurring revenue. See our companion pages on growth marketing strategy and data and analytics for how those measurement models differ by trade.
How to use these numbers without overclaiming
None of the figures above prove that flows or personalization cause the revenue attributed to them - they correlate with it inside the vendor's own reporting attribution, which favors the channel being measured. Treat every "X times more revenue" claim as a description of what a mature program looks like, not a guarantee of it. Talk to us if you want a lifecycle scorecard built around your own data instead of an industry benchmark.
How this compares with the retention-specific benchmarks
This page deliberately stays cross-industry - the churn, flow-revenue and personalization figures above apply broadly rather than to one vertical. For a deeper single-metric view, see our companion pages on customer retention statistics, customer lifetime value statistics and loyalty program statistics, which each isolate one part of the lifecycle in more depth than the summary view here.
What the classic 5% figure does and does not prove
The 25%-to-95% profit range is wide on purpose - it spans industries with very different cost structures, and Bain's own analysis notes the pattern is exaggerated in e-commerce, where new-customer acquisition runs 20% to 40% more expensive than in traditional retail. That means the lower end of the range is the safer planning assumption for a mature, low-margin subscription business, and the higher end is closer to what a high-CAC digital-first business should expect once a customer's early-relationship losses are recovered. Treat 25% as the floor to model against, not the number to promise a board.
Frequently Asked Questions
What is lifecycle and retention marketing?
It is the set of programs built around what a customer does after the first purchase - onboarding, repeat-purchase nudges, win-back flows, loyalty and referral programs - rather than the acquisition moment itself. Recurly's 2026 research frames it plainly: below 2% annual churn is strong performance in almost any subscription vertical, and the businesses that get there run active retention and recovery programs, not passive ones.
How much does a small retention gain actually change profit?
Bain & Company's original finding, republished in its Loyalty Rules research, is that an increase in customer retention rates of 5% increases profits by 25% to 95%, because early-relationship acquisition costs are recovered only as loyal customers buy more and cost less to serve over time. The finding is decades old and still the reason retention gets modeled in profit terms, not just in renewal-rate terms.
What counts as a healthy churn rate?
It depends entirely on the business model. Recurly's July 2026 network data puts median SaaS annual churn at 3.04% to 3.22% and B2B professional services at 3.21% to 3.44%, while ecommerce subscription boxes run a median 4.25% - roughly double the SaaS rate, reflecting lower price points and impulse signups. ChartMogul's benchmark set adds the stage dimension: a median early-stage SaaS company under USD 300k ARR carries a 6.5% customer churn rate, compared with 3.1% at USD 8 million-plus ARR.
Do automated flows really outperform one-off campaigns?
Yes, by a wide and consistent margin across two independent 2026 datasets. Klaviyo reports that flows generate nearly 41% of total email revenue from just 5.3% of sends, with revenue per recipient roughly 18 times higher than campaigns. Omnisend's 2026 data, from 150,000 brands, shows automations at just 2% of sends driving 30% of email-attributed revenue, earning 16 times more per send than scheduled campaigns.
How should teams measure retention across different business models?
Match the metric to the revenue shape. Subscription and SaaS businesses should track net and gross revenue churn by cohort and ARR band, the way Recurly and ChartMogul do; transactional and service businesses should track repeat-purchase rate and flow-versus-campaign revenue share, the way Klaviyo and Omnisend do. Twilio Segment's 2024 State of Personalization research found 89% of business leaders already call personalization crucial to growth over the next three years - the metric only works if someone owns it past the first sale.
Sources
Bain & Company - Loyalty Rules (original retention-to-profit research)
Recurly - Churn rate benchmarks across industries, July 2026
ChartMogul - Customer churn benchmarks by ARR stage
Klaviyo - 2026 Email Marketing Benchmarks by Industry
Omnisend - 2026 Ecommerce Marketing Report
Twilio Segment - State of Personalization Report, 2024


