



Table of contents
Three published formulas calculate customer lifetime value, and each one produces a different number from the same customer record. Benchmark data for 2026 exists for all three - the revenue-based baseline, the profit-margin adjustment, and the churn-driven subscription model - and the right comparison set depends entirely on which one a competitor quoted.
Key Takeaways
- Baseline CLV formula: Average Order Value × Purchase Frequency × Lifespan.
- Shopify's worked example reaches a revenue CLV of USD 910.
- Applying a 40% gross margin drops that to a profit CLV of USD 364.
- Median annual SaaS churn sits at 3.22% in 2026 (Recurly).
- That implies an average subscriber lifespan near 31 years at the margin.
- Ecommerce subscription churn runs higher, at 4.25% median.
- Voluntary SaaS churn is 2.16%; involuntary churn is 1.06%.
- Enterprise accounts over USD 250 ARPC churn at just 0.18% involuntary.
- Median LTV:CAC ratio across 342 SaaS companies is 4.1x (Benchmarkit).
- Median CAC payback period is 16 months.
- Median blended CAC ratio is USD 1.30 (Benchmarkit).
- Median net revenue retention across 105 public SaaS companies is 122% (Cust).
- Top-decile NRR clears 155%.
- 40% of SaaS companies between USD 15M-30M ARR post negative net churn (ChartMogul).
- Ecommerce CLV benchmarks range from about USD 100 to USD 300 by category (Shopify).
- Health and wellness ecommerce reaches USD 300 to USD 550-plus.
Why "what is your CLV" is an unanswerable question
Ask three finance teams for their customer lifetime value and, without agreeing on a formula first, you will get three numbers built on three different assumptions about revenue, cost and time horizon. Shopify's own guidance and Recurly's 2026 churn network converge on the same conclusion from opposite directions: the formula you choose determines the answer more than the customer does.
This page benchmarks each method on its own terms instead of blending them into one misleading average.
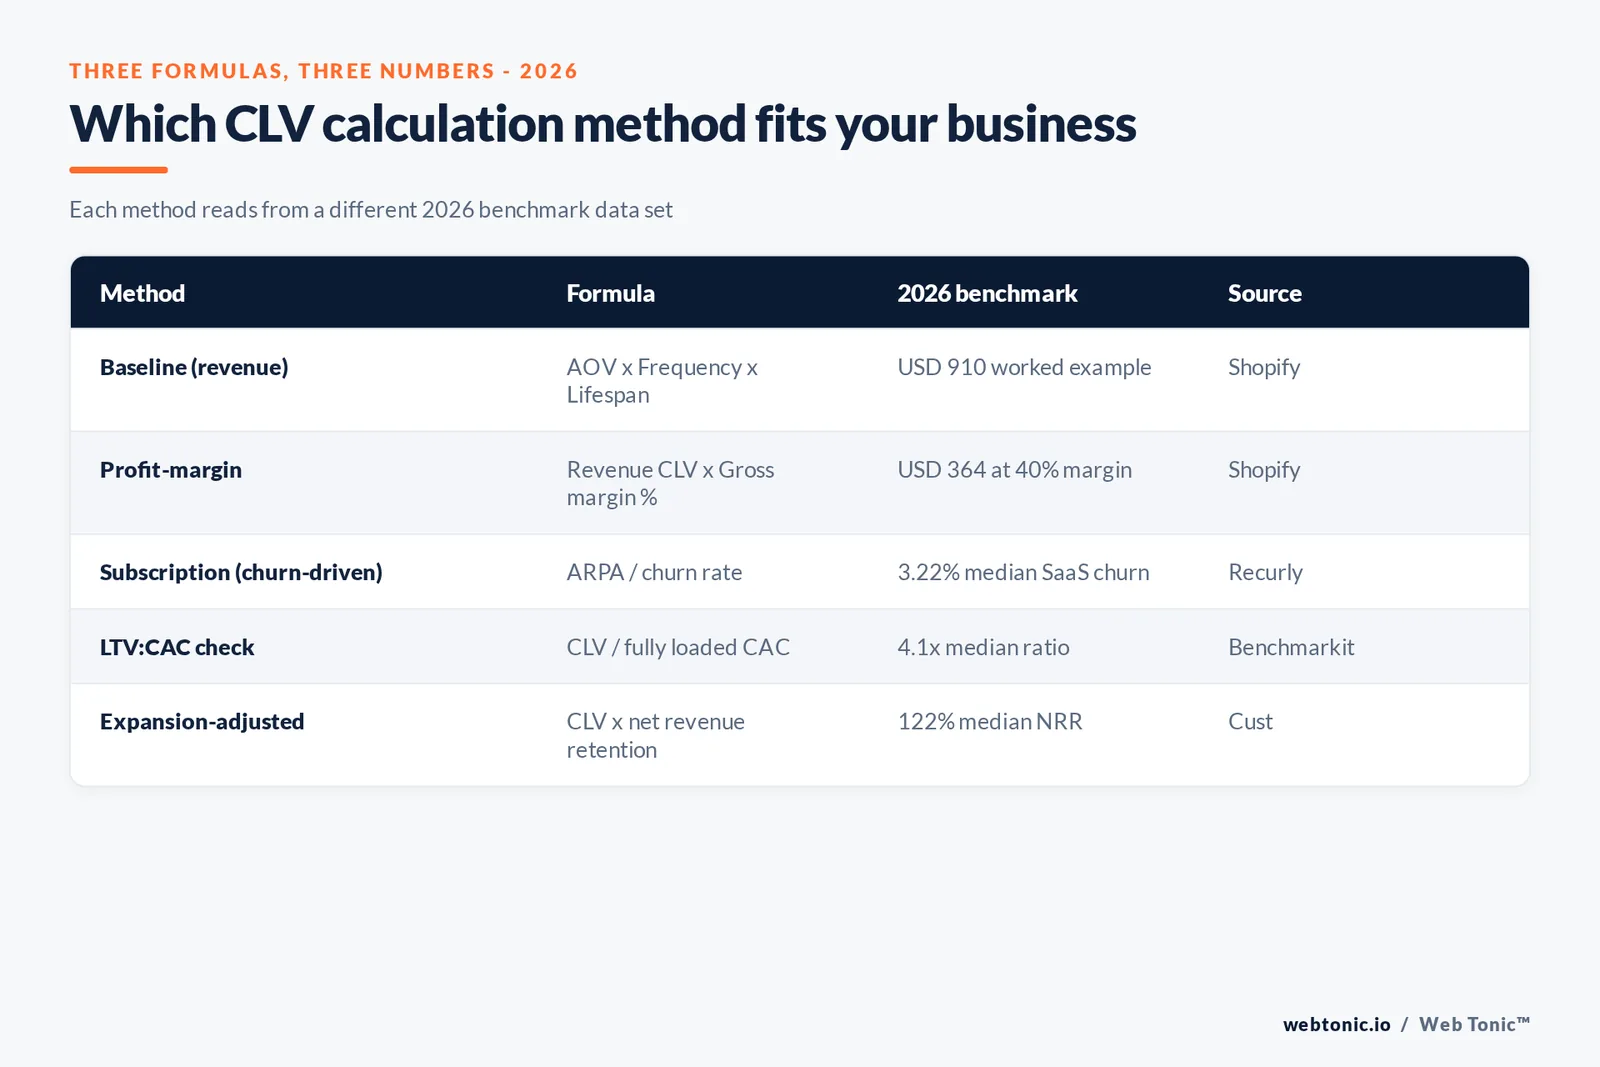
| Method | Formula | Best fit | What it hides |
|---|---|---|---|
| Baseline (revenue) | AOV × Frequency × Lifespan | One-time or repeat ecommerce | Cost to serve and margin |
| Profit-margin | Revenue CLV × Gross margin % | Any model needing true unit economics | Time value of money, expansion |
| Subscription (churn-driven) | ARPA ÷ Churn rate, or ARPA × (1÷churn) | Recurring revenue, SaaS | Expansion revenue if measured on logo churn alone |
Method 1: the baseline revenue formula
The baseline method is the one most CLV calculators default to because it needs only three inputs a retailer already tracks. Shopify's worked example: an online retailer with an average order value of USD 65, a purchase frequency of 3.5 orders a year and a customer lifespan of 4 years computes a revenue CLV of USD 910 - (USD 65 × 3.5) × 4.
It is fast, and it is also the number most likely to be quoted in a pitch deck without the margin adjustment that follows, which is why a revenue CLV is not comparable across categories with different cost structures.
| Ecommerce category (2026) | Reported average CLV | Horizon | Source |
|---|---|---|---|
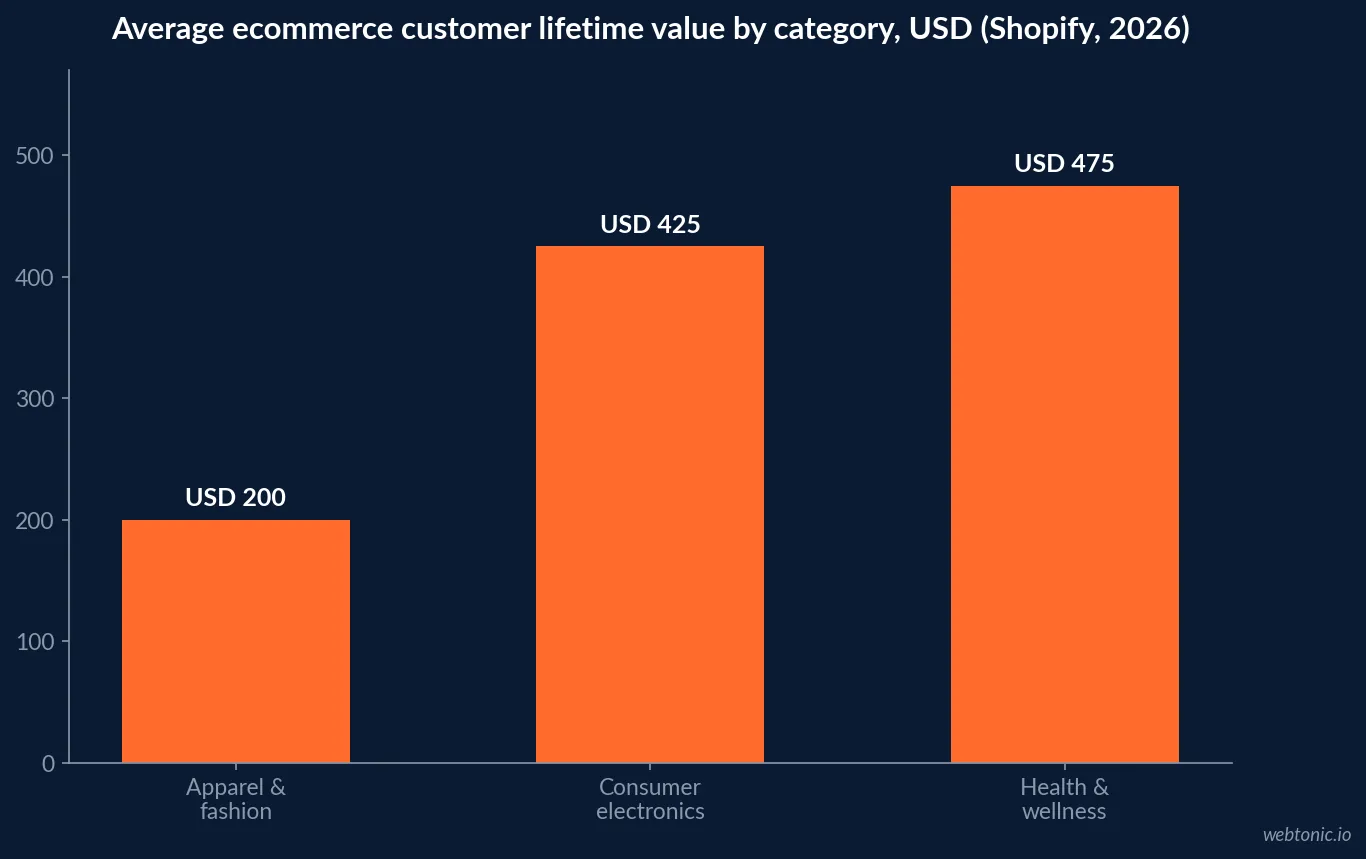
| Health and wellness | USD 300-550+ | Cumulative, multi-year | Shopify |
| Consumer electronics | USD 250-600 | Cumulative, multi-year | Shopify |
| Apparel and fashion | USD 100-300 (category range) | Cumulative, multi-year | Shopify |
| Blended ecommerce baseline example | USD 910 revenue / USD 364 profit | 4-year modeled lifespan | Shopify worked example |
Method 2: the profit-margin correction
Revenue CLV overstates value the moment two customers buy from categories with different margins. Shopify applies the correction directly to its own example: Profit CLV = Revenue CLV × Gross Margin %. At a 40% gross margin, the USD 910 revenue figure becomes a profit CLV of USD 364 - a 60% reduction from a single multiplication.
That correction is also what makes an LTV:CAC ratio defensible. Comparing an unadjusted revenue CLV against a fully loaded acquisition cost systematically flatters the ratio, sometimes by the same 2 to 3x factor the margin adjustment removes.
| Basis | Figure in Shopify's example | Change vs. revenue CLV | Use case |
|---|---|---|---|
| Revenue CLV | USD 910 | - | Top-line channel comparison |
| Gross margin applied | 40% | - | Category-specific cost of goods |
| Profit CLV | USD 364 | -60% | LTV:CAC ratio, budget planning |
Method 3: the churn-driven subscription model
Subscription and SaaS businesses rarely observe a customer's true lifespan directly - a customer who has not churned yet has an unknown remaining life. The standard workaround inverts the churn rate: modeled lifespan ≈ 1 ÷ churn rate. Small differences in the churn input therefore compound into large differences in the resulting CLV.
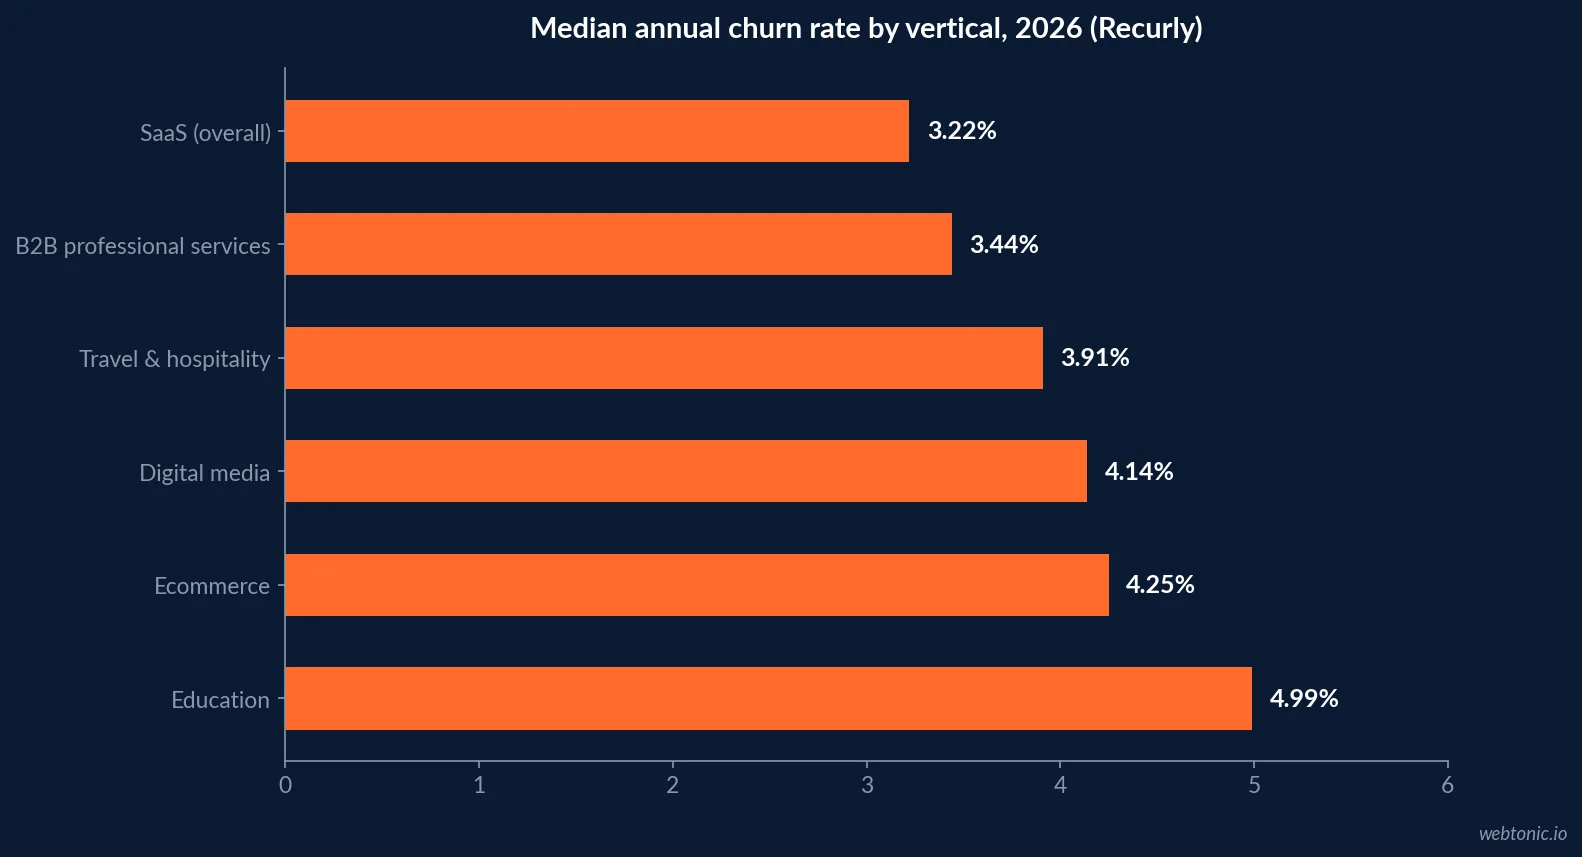
Recurly's July 2026 benchmark, drawn from its subscription-billing network, puts median annual SaaS churn at 3.22% (voluntary 2.16%, involuntary 1.06%), with top-quartile SaaS performers at 1.78% or below. Business and professional services churn slightly higher at 3.44%, while ecommerce subscriptions post 4.25% and education posts the highest voluntary rate in the dataset at 3.30%.
| Vertical (Recurly, 2026) | Total annual churn | Voluntary | Involuntary | Implied lifespan (1/churn) |
|---|---|---|---|---|
| SaaS (overall) | 3.22% | 2.16% | 1.06% | ≈31 years |
| Business & professional services | 3.44% | 2.27% | 1.18% | ≈29 years |
| Travel, hospitality & entertainment | 3.91% | 2.63% | 1.28% | ≈26 years |
| Digital media & entertainment | 4.14% | 2.55% | 1.59% | ≈24 years |
| Ecommerce | 4.25% | 2.87% | 1.38% | ≈23.5 years |
| Education | 4.99% | 3.30% | 1.69% | ≈20 years |
Enterprise accounts break the model in a useful way
Recurly's data on higher-value subscribers shows why blended averages hide the number that matters most for account-based planning. Within the USD 250-plus average revenue per customer cohort, median annual churn is 3.54%, but involuntary churn drops to just 0.18% - enterprise buyers use better payment methods and resolve failed charges proactively, so almost all of their churn is a genuine decision to leave, not a billing failure. A CLV model for an enterprise segment should treat involuntary churn as close to zero and focus entirely on the voluntary rate.
What Benchmarkit's SaaS data adds to the churn model
Churn alone answers "how long." Benchmarkit's CY-2025 report, covering 342 B2B SaaS and AI-native companies, answers "was it worth acquiring": the median LTV:CAC ratio is 4.1x, the median CAC payback period is 16 months, and the median blended CAC ratio is USD 1.30 of spend per dollar of new revenue. Median revenue per employee in the same dataset is USD 175,000.
A CLV number that clears 3x its CAC on paper but takes 24 months to pay back is a different bet than one that clears the same ratio in 10 months - the ratio alone does not capture financing risk.
| Benchmarkit metric (CY-2025, 342 companies) | Median | What it tests against CLV |
|---|---|---|
| LTV:CAC ratio | 4.1x | Whether the model clears the 3x sustainability floor |
| CAC payback period | 16 months | How long the cash is tied up before profit starts |
| Blended CAC ratio | USD 1.30 | Spend efficiency per dollar of new revenue |
| Revenue per employee | USD 175,000 | Whether growth is capital- or labor-intensive |
Net revenue retention: the multiplier every method under-counts
All three formulas above assume a customer's spend stays flat or only shrinks through churn. Expansion revenue breaks that assumption, and 2026 data shows it is now the norm, not the exception. Cust's dataset of 105 public B2B SaaS companies, built from SEC filings, puts median net revenue retention at 122%, with the top decile clearing 155%. ChartMogul's SaaS Benchmarks Report finds that 40% of SaaS businesses in the USD 15-30M ARR range post negative net MRR churn - the point at which expansion revenue exceeds churned and contracted revenue, so the existing base becomes more valuable every month it stays.
| Retention signal (2026) | Figure | Source | Effect on CLV |
|---|---|---|---|
| Median net revenue retention | 122% | Cust (105 public SaaS companies) | Existing base grows even with zero new logos |
| Top-decile net revenue retention | 155% | Cust | Best-run accounts compound value yearly |
| SaaS companies with negative net churn (USD 15-30M ARR) | 40% | ChartMogul | Expansion revenue exceeds all losses |
Loyalty is the leading indicator behind every method
Every CLV formula is a lagging measurement of a decision customers already made. Bain & Company's NPS Prism benchmarking service surveys more than 20,000 consumers per industry across 10-plus industries to separate relationship, episode and channel loyalty scores from a single blended satisfaction number. Businesses that track loyalty at that resolution catch a lifespan problem months before it shows up as churn in any of the three formulas above.
Why the inputs are often wrong before the math starts
Every formula above is only as good as the customer record it reads from, and 2026 data on that record is not encouraging. Validity's survey of 602 CRM users and administrators found 76% saying less than half of their organization's CRM data is accurate and complete, and 37% reported losing revenue directly because of poor data quality. A CLV model built on purchase frequency and lifespan fields that are half wrong will not be rescued by picking the "correct" formula.
The experience layer compounds it. Zendesk's 2026 CX Trends research reports 83% of consumers still believe service experiences should be better than they are today, and 76% would choose a company that lets them move between text, image and video in one support thread without restarting - friction that shows up later as a churn event no formula predicted from transaction data alone.
Common CLV calculation mistakes
- Quoting revenue CLV as if it were profit CLV when comparing acquisition channels with different margin profiles.
- Using a blended churn rate across enterprise and SMB tiers that have a 3.54% versus a much higher self-serve rate hiding inside one average.
- Ignoring expansion revenue in a churn-only model when net revenue retention is already above 100%.
- Treating a 3-year CLV and a lifetime CLV as comparable - they use different horizons and are not interchangeable in a board deck.
How to choose the right method for your business
Use the baseline formula for a fast first pass on repeat-purchase ecommerce, apply the margin correction before comparing it to acquisition cost, and switch to the churn-driven model the moment revenue is recurring. Whichever method wins, publish the formula and its inputs next to the number - an unlabeled CLV figure is not benchmarkable against anything on this page. If you want the acquisition side of that ratio modeled properly, our data and analytics practice builds the CAC and cohort tracking a CLV model actually needs, and our growth marketing practice works the channel mix once the ratio is trustworthy. For the spend side of the same equation, see our breakdown of what paid search costs in 2026, or talk to us about building the model.
Frequently Asked Questions
What is the simplest way to calculate customer lifetime value?
The baseline formula is Average Order Value multiplied by Purchase Frequency, multiplied by Customer Lifespan. Shopify's own worked example uses an AOV of USD 65, 3.5 orders a year and a 4-year lifespan to reach a revenue CLV of USD 910. It is the easiest number to produce and the easiest to misuse, because it ignores what the order actually cost to deliver.
Why does profit-margin CLV give a smaller number than revenue CLV?
Because it strips out cost of goods sold before the multiplication finishes. Shopify's example applies a 40% gross margin to the USD 910 revenue figure and gets a profit CLV of USD 364 - 60% smaller. Two customers with identical revenue CLV can carry very different profit CLV if one buys high-margin goods and the other buys low-margin goods, which is exactly why revenue-only CLV misleads channel comparisons.
How does churn rate change the CLV calculation?
For subscription and recurring-revenue businesses, lifespan is not observed directly - it is inferred from churn, typically as 1 divided by the churn rate. Recurly's 2026 network data puts median annual SaaS churn at 3.22%, which implies an average lifespan near 31 years at that rate, while ecommerce subscriptions churning at 4.25% imply a much shorter lifespan near 23.5 years. Small differences in churn compound into large differences in modeled CLV.
What is a good LTV to CAC ratio in 2026?
Benchmarkit's CY-2025 data across 342 B2B SaaS and AI-native companies puts the median LTV:CAC ratio at 4.1x, with a median CAC payback period of 16 months. A ratio above 3x is the commonly cited floor for a sustainable model, so a 4.1x median means most tracked SaaS companies clear that floor, but the spread between the weak and strong quartiles is wide enough that the median alone is not a target.
Does net revenue retention change which CLV method to trust?
Yes. Cust's 2026 dataset of 105 public B2B SaaS companies, built from SEC filings, puts median net revenue retention at 122%, meaning the average tracked company is growing revenue from its existing customer base even before counting new logos. Any CLV model built only on churn and ignores expansion revenue will understate true lifetime value for a business with net revenue retention above 100%.
Sources
Shopify - Average customer lifetime value by industry, 2026
Recurly - Churn rate benchmarks by industry, 2026
Benchmarkit - CY-2025 B2B SaaS performance metrics benchmarks
Cust - 2026 State of Customer Success, SaaS retention benchmarks
ChartMogul - SaaS Benchmarks Report
Bain & Company - NPS Prism benchmarking
Validity - The State of CRM Data Management in 2025
Zendesk - CX Trends 2026 report


