



Table of contents
Global advertising spend is forecast to reach USD 1.06 trillion in 2026, yet 76% of online shoppers still say they will only buy from a site in their own language. That gap between total ad dollars and localized experience is where an international marketing budget is won or wasted. This page benchmarks both sides: regional ad-spend growth and the localization line that decides whether that spend converts.
Key Takeaways
- Global ad spend reaches USD 1.06 trillion in 2026, crossing the trillion mark a year early.
- 2026 growth is forecast at 5.0%, down from 5.8% in 2025.
- That still outpaces the IMF's 3.1% global GDP growth forecast.
- Latin America is the fastest-growing ad region in 2026.
- Brazil and Mexico capture over 70% of Latin American ad revenue between them.
- Brazil's retail media spend is up 55.4% in 2026.
- Sub-Saharan Africa growth is projected at 15.6% for Nigeria, Kenya and South Africa combined.
- China's ad market is forecast to grow 6.7% in 2026.
- Middle East and Africa growth was compressed from 8.0% to 5.6% due to regional conflict.
- 76% of online shoppers prefer buying in their native language.
- 40% will never buy from a website in another language.
- Fortune 500 firms that grew their translation budget were 1.5x more likely to report revenue growth.
- Gartner's 2026 CMO survey reports marketing spend at 7.8% of company revenue.
- The CMO Survey's Spring 2026 edition reports 9.0% of revenue.
- US ad spend growth was revised up to 12.3% for 2026, per IAB.
Start from the world total, then split it by region
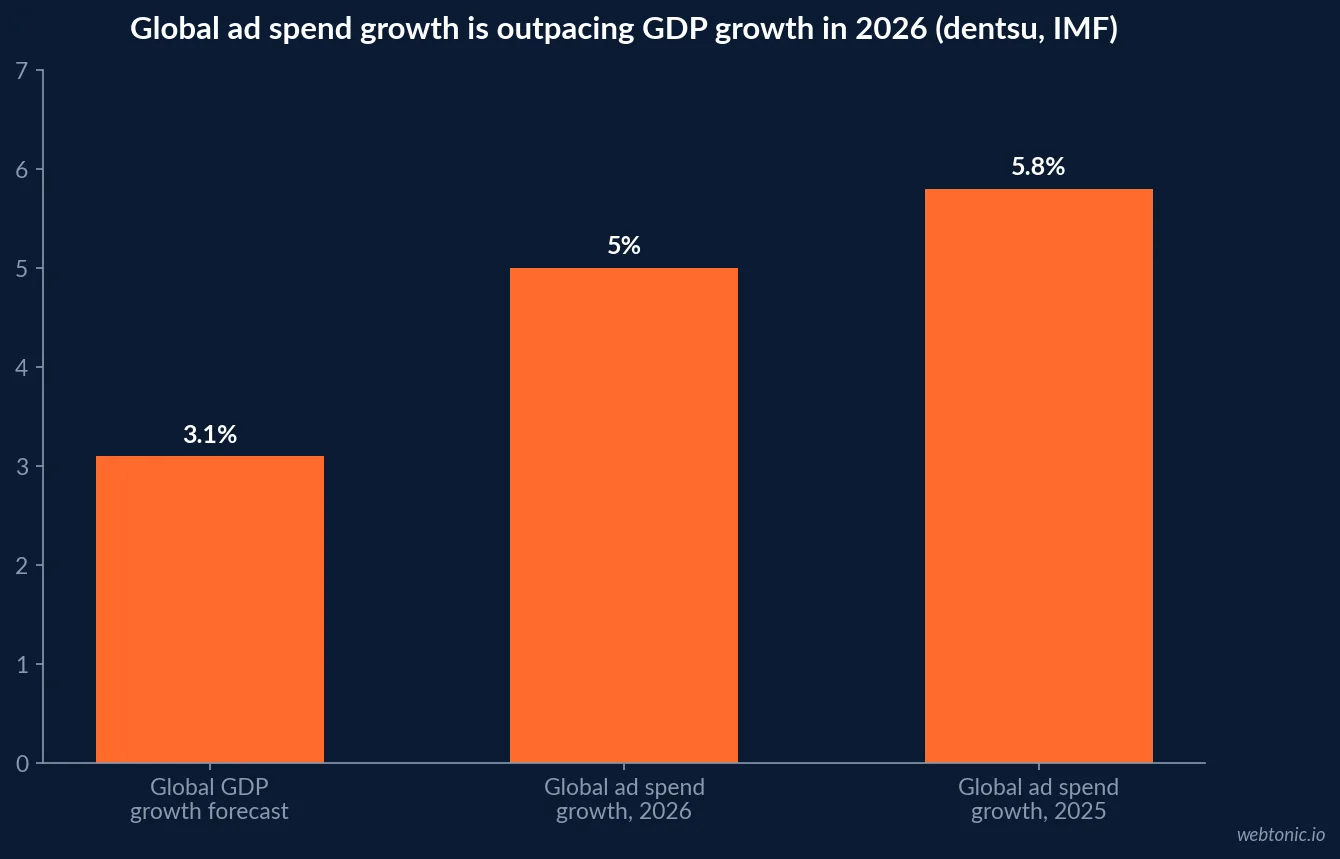
dentsu's mid-year 2026 Global Ad Spend Forecast puts worldwide advertising spend at USD 1.06 trillion for the year, having crossed the USD 1 trillion mark in 2025 - a year faster than previously predicted. Growth is projected at 5.0% in 2026, a slowdown from 5.8% in 2025, but still ahead of the International Monetary Fund's 3.1% global GDP growth forecast for the year. That gap between ad-spend growth and GDP growth is the case for treating marketing as a growth investment rather than a cost to trim first when budgets tighten.
| Global ad spend metric (2026) | Figure | Source |
|---|---|---|
| Worldwide ad spend, 2026 | USD 1.06 trillion | dentsu Global Ad Spend Forecasts, May 2026 |
| Global ad spend growth, 2026 | 5.0% | dentsu Global Ad Spend Forecasts, May 2026 |
| Global ad spend growth, 2025 | 5.8% | dentsu Global Ad Spend Forecasts, May 2026 |
| IMF global GDP growth forecast, 2026 | 3.1% | IMF, cited in dentsu forecast |
| US ad spend growth, revised 2026 forecast | +12.3% | IAB 2026 Ad Spend Outlook, September Update |
Where the budget should follow growth
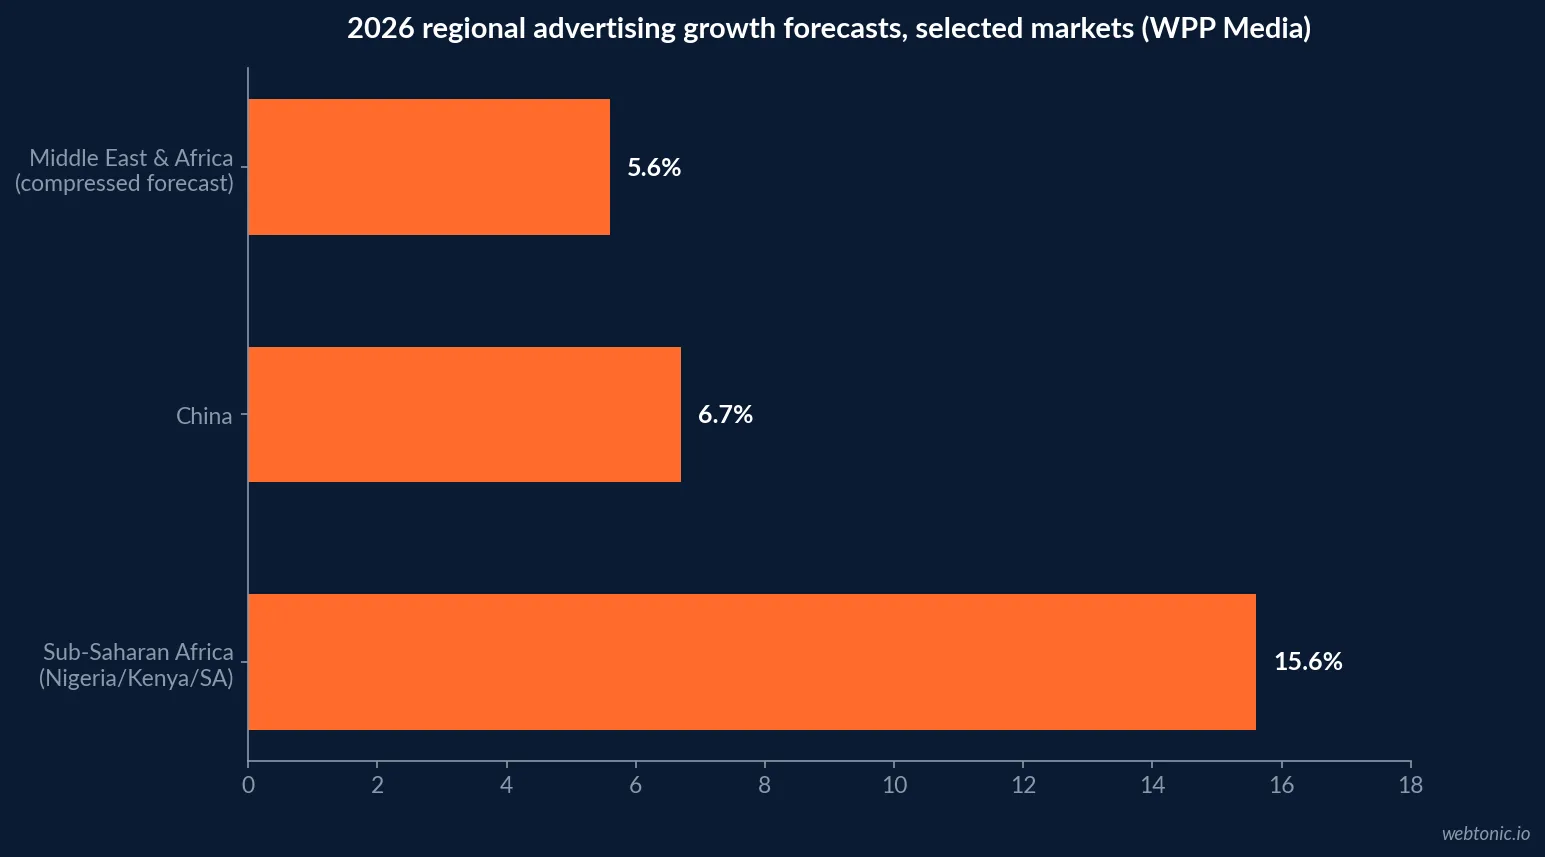
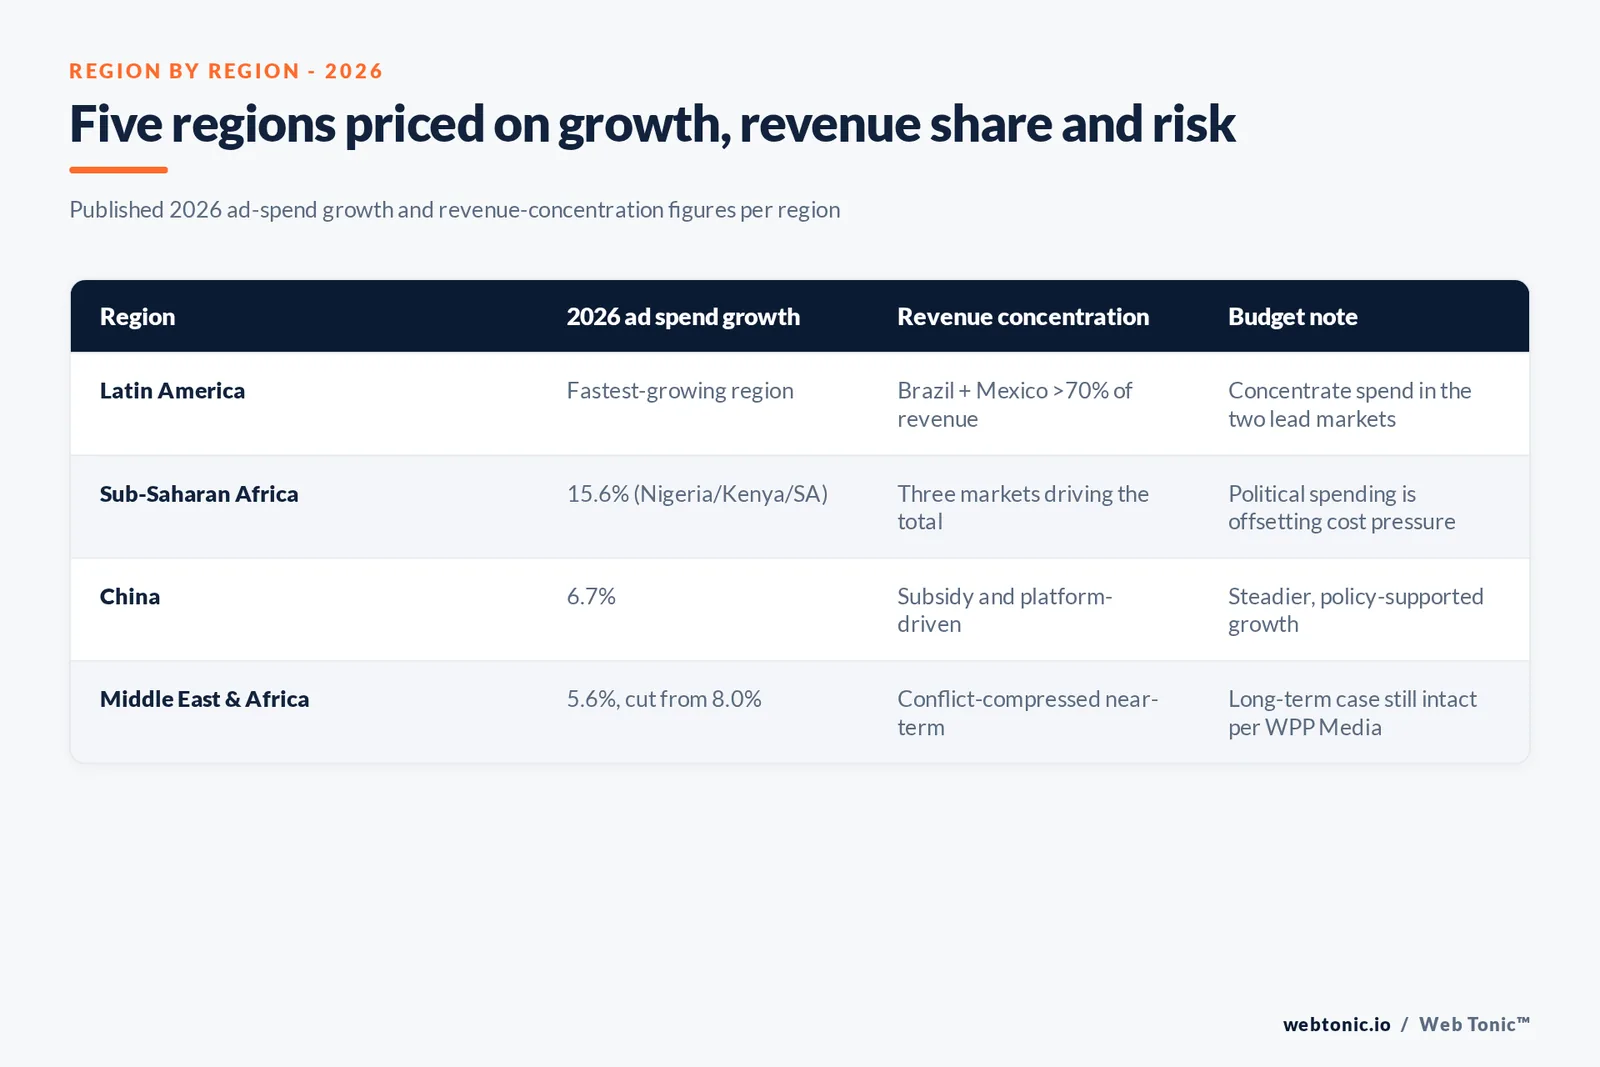
WPP Media's Global Midyear Ad Forecast 2026 names Latin America the fastest-growing advertising region for the year, with Brazil and Mexico together capturing over 70% of regional ad revenue. Brazil's own retail media spend is up 55.4% in 2026, driven by commodity-exporter dynamics and World Cup-related demand. Sub-Saharan Africa is not far behind, with Nigeria, Kenya and South Africa together projected to expand 15.6%, offsetting energy and food cost pressure with political spending growth. China's ad market grows a steadier 6.7%, supported by government subsidies and platform innovation.
Growth is not risk-free everywhere: the same forecast compressed its Middle East and Africa estimate from 8.0% to 5.6% after regional conflict, while still describing the long-term opportunity from demographics and sovereign capital as structurally intact.
| Region | 2026 ad spend growth | Notable driver | Source |
|---|---|---|---|
| Latin America | Fastest-growing region | Brazil + Mexico >70% of regional revenue | WPP Media Midyear 2026 |
| Sub-Saharan Africa (Nigeria, Kenya, South Africa) | 15.6% | Political spending offsetting cost pressure | WPP Media Midyear 2026 |
| China | 6.7% | Government subsidies, platform innovation | WPP Media Midyear 2026 |
| Middle East and Africa | 5.6%, down from 8.0% forecast | Regional conflict compressed the forecast | WPP Media Midyear 2026 |
| Brazil retail media specifically | 55.4% | Commodity-exporter dynamics, World Cup demand | WPP Media Midyear 2026 |
The line most global budgets underfund: localization
Regional ad spend only converts if the audience can act on it in their own language. CSA Research's 29-country consumer survey, fielded with Kantar across 8,709 verified respondents, found 76% of online shoppers prefer to buy products described in their native language, and 40% say they will never buy from a website in another language at all. That is a hard ceiling on addressable market for any brand running English-only creative into a non-English-speaking region.
The revenue case is not just theoretical. CSA Research's Fortune 500 study found companies that increased their translation budgets were 1.5 times more likely than peers to report an increase in total revenue - and customer service, branding and market share, not revenue growth itself, were the top reasons those companies gave for funding translation in the first place.
| Localization benchmark | Figure | Source |
|---|---|---|
| Shoppers preferring native-language product info | 76% | CSA Research, 29-country survey, 8,709 respondents |
| Shoppers who will never buy in another language | 40% | CSA Research, 29-country survey |
| Fortune 500 firms growing translation budgets | More likely to report revenue growth (1.5x) | CSA Research, Fortune 500 translation study |
| Top reasons Fortune 500 firms fund translation | Customer service, branding, market share | CSA Research, Fortune 500 translation study |
What localization failure actually costs at checkout
The localization case is not only about preference, it shows up directly in cart abandonment. Baymard Institute's cart abandonment benchmark puts the average global online cart abandonment rate at 70.22%, and a currency, language or payment-method mismatch at checkout is a documented contributor to that figure alongside cost and account-creation friction. Separately, industry reporting on translation-automation programs cites a 345% three-year ROI from Forrester's analysis of DeepL-driven localization workflows, and a 13% relative conversion lift from switching a storefront to native-language display in Shopify's own merchant data.
None of these figures replace a market-specific test, but together they argue for treating checkout localization as a conversion-rate line item, not a brand-polish afterthought, when phasing a new region's budget.
| Checkout localization signal | Figure | Source |
|---|---|---|
| Average global cart abandonment rate | 70.22% | Baymard Institute |
| Conversion lift from native-language display | 13% relative uplift | Shopify merchant data |
| 3-year ROI from translation-automation workflows | 345% | Forrester analysis of DeepL |
Setting the overall marketing-to-revenue ratio
Two large 2026 surveys give different totals because their samples differ. Gartner's 2026 CMO Spend Survey, covering 401 CMOs mostly from companies above USD 1 billion in revenue, reports average marketing spend at 7.8% of company revenue. The CMO Survey's Spring 2026 edition, drawing on a broader US sample of for-profit marketing leaders, reports 9.0% of revenue and 9.6% of total company budget. Neither is a target - align the sample to your company's size and geography mix before treating either as a benchmark, and build the international allocation as a share of that total rather than a separate pool.
| Marketing budget survey (2026) | Reported average | Sample |
|---|---|---|
| Gartner CMO Spend Survey | 7.8% of company revenue | 401 CMOs, mostly $1bn+ revenue, NA/UK/Europe |
| The CMO Survey, Spring 2026 | 9.0% of revenue, 9.6% of budget | US for-profit marketing leaders |
How to phase an international budget
Sequence spend by the region's growth rate and localization gap together, not growth alone. A region growing fast but under-localized is the highest-leverage place to add a translation and cultural-review line before scaling media spend; a region already well-served in-language just needs its media budget to track the regional growth forecast. Re-check region-specific risk (currency, regulatory, geopolitical) at least at the mid-year forecast cadence, since the same report that named Latin America the fastest-growing region also cut its Middle East and Africa estimate by more than two points within a single year.
Our growth marketing practice phases regional media spend against localization readiness rather than funding both on the same timeline. For the channel-level detail behind a specific region's budget, see our guide to what Google Ads actually costs before setting a per-market paid search allocation, or talk to us about sequencing a multi-region rollout.
A phasing checklist before the budget is finalized
Pull the pieces above into a single pass before locking a regional split: confirm the region's ad spend growth rate against the WPP Media and dentsu figures, check whether the target market sits above or below the 76% native-language preference threshold for the vertical in question, price a checkout localization pass against the 70.22% average cart abandonment benchmark if the region sells direct to consumers, and re-confirm the region-specific risk line - currency, regulatory, geopolitical - at the same cadence as the mid-year global forecast, not just once a year at annual planning.
The pattern across every source on this page is the same: global marketing budgets fail less often from being too small and more often from being allocated by total market size alone, with localization and region-specific risk treated as an afterthought rather than a line item with its own published benchmark.
Frequently Asked Questions
What is the global advertising market worth in 2026?
Worldwide advertising spend is forecast to reach USD 1.06 trillion in 2026, having crossed the USD 1 trillion mark in 2025, a year earlier than previously predicted, according to dentsu's Global Ad Spend Forecasts. Growth is projected at 5.0% for the year, slowing from 5.8% in 2025 but still outpacing the IMF's 3.1% global GDP growth forecast.
Which region is growing fastest for international marketing budgets?
Latin America is projected to be the fastest-growing advertising region in 2026, with Brazil and Mexico together capturing over 70% of regional ad revenue, per WPP Media's Global Midyear Ad Forecast. Sub-Saharan Africa follows closely, with Nigeria, Kenya and South Africa together projected to expand 15.6% in 2026.
How much should a global budget set aside for localization?
There is no single verified benchmark, but the case for a real line item is strong: CSA Research found 76% of online shoppers across 29 countries prefer to buy products described in their native language, and 40% will never buy from a website in another language. Separately, Fortune 500 companies that increased their translation budgets were 1.5 times more likely to report revenue growth than peers that did not.
Does a bigger international marketing budget guarantee bigger returns?
No - regional risk changes the return on the same dollar. WPP Media's midyear forecast compressed its Middle East and Africa growth estimate from 8.0% to 5.6% due to regional conflict, while flagging that the long-term opportunity from demographics and digital transformation remains intact. Budget by region-specific risk and payback horizon, not a single global multiplier.
What percentage of revenue do global brands spend on marketing overall?
Two large 2026 surveys give different averages because their samples differ: Gartner's 2026 CMO Spend Survey reports 7.8% of company revenue among mostly enterprise respondents above USD 1 billion in revenue, while The CMO Survey's Spring 2026 edition reports 9.0% of revenue and 9.6% of total company budget across a broader US sample. Neither figure is a prescription; match the sample to your company size before using either as a benchmark.
Sources
dentsu - Global Ad Spend Forecasts, Mid Year 2026
dentsu - Ad spend growth projected to slow to 5.0% in 2026, news release
WPP Media - Global Midyear Ad Forecast 2026
CSA Research - Consumers Prefer Their Own Language, 29-country survey
CSA Research - Fortune 500 Companies That Invest in Translation Report Higher Revenue
IAB - 2026 Ad Spend Outlook Study, September Update
Baymard Institute - Cart Abandonment Rate Statistics


