



Table of contents

Rewarded video inside mobile games now clears USD 15 to 40 eCPM in tier-1 markets at 95%-plus completion, which is a better cost-per-completed-view than most open-web video buys. That is the honest headline. Static banners and interstitials inside the same games are a weaker case, priced closer to ordinary mobile display. This page separates the two before you move a paid-media dollar.
Key Takeaways
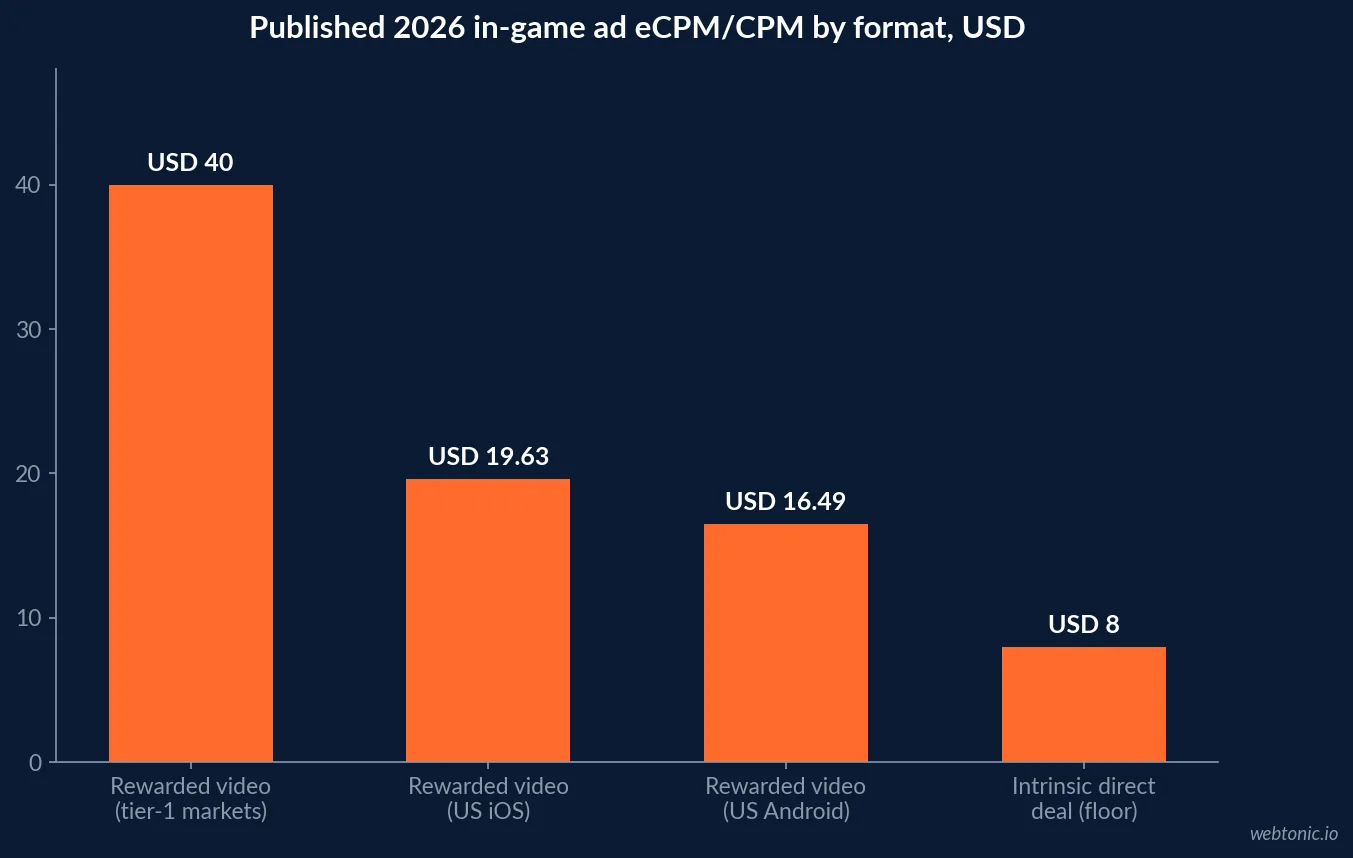
- Rewarded video eCPM runs USD 15 to 40 in tier-1 markets.
- US iOS rewarded eCPM sits near USD 19.63, Android near USD 16.49.
- Rewarded completion rate exceeds 95%, versus 60-70% for non-rewarded video.
- Intrinsic direct deals clear USD 8 to 25 CPM against a minimum spend commitment.
- 9 in 10 players interact with rewarded ads across 500-plus games analyzed.
- 85% of players say they enjoy the reward-for-ad exchange.
- 75% of gamers are positive or neutral toward in-game advertising overall.
- 46% of players report purchase intent from in-game ads, up from 40% a year earlier.
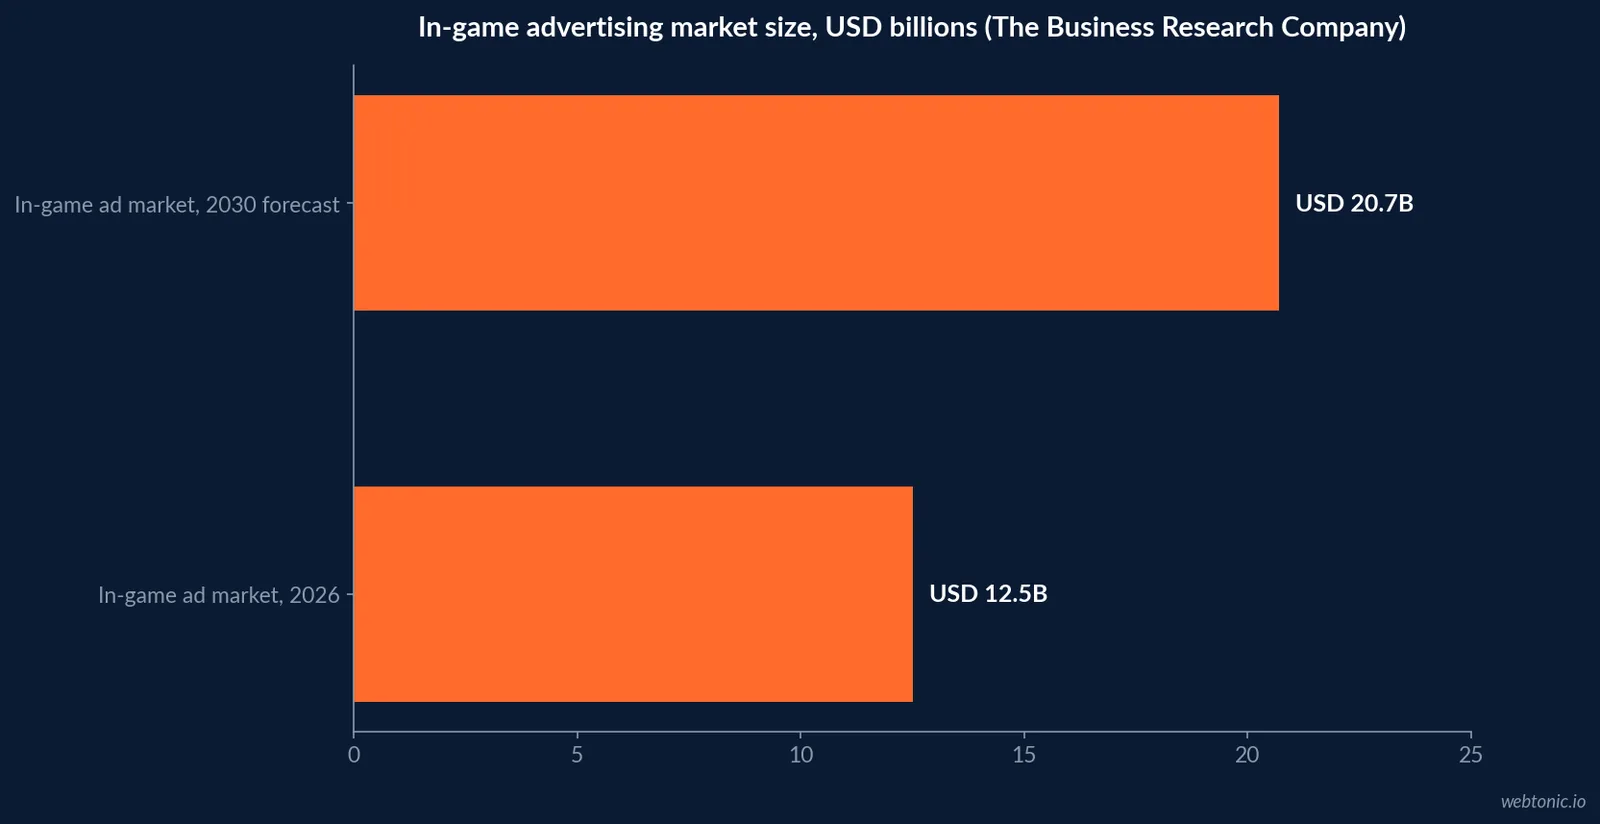
- The in-game ad market is sized at USD 12.5 billion in 2026, one credible estimate among several.
- It is forecast to reach USD 20.7 billion by 2030 at a 13.5% CAGR.
- Gaming digital ad spend hit USD 7 billion in H1 2026 alone, up 8% period on period.
- Gaming ad impressions hit 1.4 trillion in H1 2026, up 14% period on period.
- Offerwall eCPM averages USD 530, the richest single in-game ad unit measured.
- Average monthly mobile game advertisers exceeded 84,000 in 2025, up 21.9% year on year.
- A 60-second creative can cost 10 to 20 completion points against a 15- or 30-second cut.
- US ad spend growth was revised up to 12.3% for 2026 across all formats, IAB reports.
The verdict up front: which format earns its budget
In-game advertising is not one product. Rewarded video, where a player opts in for a reward, behaves nothing like a static banner squeezed into a loading screen. The rewarded format is the one with a defensible ROI case in 2026: high completion, opt-in attention and a price that reflects both. Banner and interstitial placements inside games compete on the same terms as any other mobile display inventory, without the attention premium.
Treat this page as a format-by-format underwriting exercise, not a single yes-or-no on "in-game ads."
| In-game ad format | Published 2026 eCPM/CPM | Completion or view rate | Source |
|---|---|---|---|
| Rewarded video, tier-1 markets | USD 15-40 | 95%+ | AppLovin publisher benchmarks (via Game Growth Advisor) |
| Rewarded video, US iOS | USD 19.63 | 95%+ | Industry ad-network tracking, late 2026 |
| Rewarded video, US Android | USD 16.49 | 95%+ | Industry ad-network tracking, late 2026 |
| Intrinsic direct deal, minimum spend | USD 8-25 CPM | 100% viewability claimed | Game Growth Advisor 2026 revenue guide |
| Offerwall | USD 530 average eCPM | N/A (task completion) | MAF rewarded-ad analysis, 500+ games |
| Non-rewarded video (interstitial) | Below rewarded tier | 60-70% | Game Growth Advisor 2026 revenue guide |
Why rewarded video prices so much higher
The gap is attention, not novelty. A player who opts into a rewarded video has already decided the exchange is worth their time before the creative starts, which is why completion clears 95% against 60-70% for placements a player did not choose. Advertisers pay for a near-guaranteed finish, and the price reflects it.
MAF's analysis of more than 500 mobile games found 9 in 10 players interact with rewarded ads and 85% say they enjoy the in-game rewards those ads unlock. That is a rare case of an ad format the audience reports liking rather than tolerating.
| Player sentiment metric (2026) | Figure | Source |
|---|---|---|
| Players who interact with rewarded ads | 9 in 10 | MAF, 500+ games analyzed |
| Players who enjoy the reward exchange | 85% | MAF, 500+ games analyzed |
| Gamers positive or neutral on in-game ads generally | 75% | Anzu player research |
| Players finding rewarded ads the most engaging format | 62% | IAB player survey |
| Players reporting purchase intent from in-game ads | 46%, up from 40% | Industry tracker, year-on-year |
What the market actually spends
Market-size figures for in-game advertising vary by scope, and quoting only the largest number is how this category gets oversold. The Business Research Company's 2026 report sizes in-game advertising at USD 12.5 billion in 2026, up from USD 11.03 billion in 2025, growing at a 13.3% CAGR and reaching USD 20.7 billion by 2030 at a 13.5% CAGR. That is a narrower, format-specific figure than broader "gaming ad spend" totals that include user-acquisition and non-in-game placements.
Sensor Tower's H1 2026 Gaming Digital Market Index reports gaming digital ad spend at USD 7 billion across 41 markets for the half-year, up 8% period on period, with ad impressions reaching 1.4 trillion, up 14%. That is the broader gaming-app ad economy, not the in-game-format slice alone, and it moved up even as mobile in-app-purchase revenue slipped 2% over the same period.
| Market metric (2026) | Figure | Source |
|---|---|---|
| In-game advertising market size, 2026 | USD 12.5 billion | The Business Research Company |
| In-game advertising market size, 2030 forecast | USD 20.7 billion | The Business Research Company |
| Gaming digital ad spend, H1 2026 | USD 7 billion | Sensor Tower H1 2026 Gaming Digital Market Index |
| Gaming digital ad impressions, H1 2026 | 1.4 trillion | Sensor Tower H1 2026 Gaming Digital Market Index |
| Mobile game IAP revenue, H1 2026 | USD 40 billion, down 2% period on period | Sensor Tower H1 2026 Gaming Digital Market Index |
| Average monthly mobile game advertisers, 2025 | 84,000+, up 21.9% year on year | SocialPeta x Singular x Aarki 2026 white paper |
Where the money is going instead of user acquisition
The Sensor Tower data points at a structural shift worth underwriting against: as in-app-purchase revenue softens, gaming digital ad spend and impressions both climbed in the first half of 2026. That is studios monetizing attention they already have rather than paying more to acquire new players, and it is the same dynamic that makes ad inventory inside games increasingly available to outside brands, not just other game studios buying installs.
Read against the IAB's September 2026 Ad Spend Outlook, which revised the full-year US ad spend forecast up to +12.3% and named in-game ads among the formats widening alongside social and CTV, this is not a niche line item anymore.
The buying models available in 2026
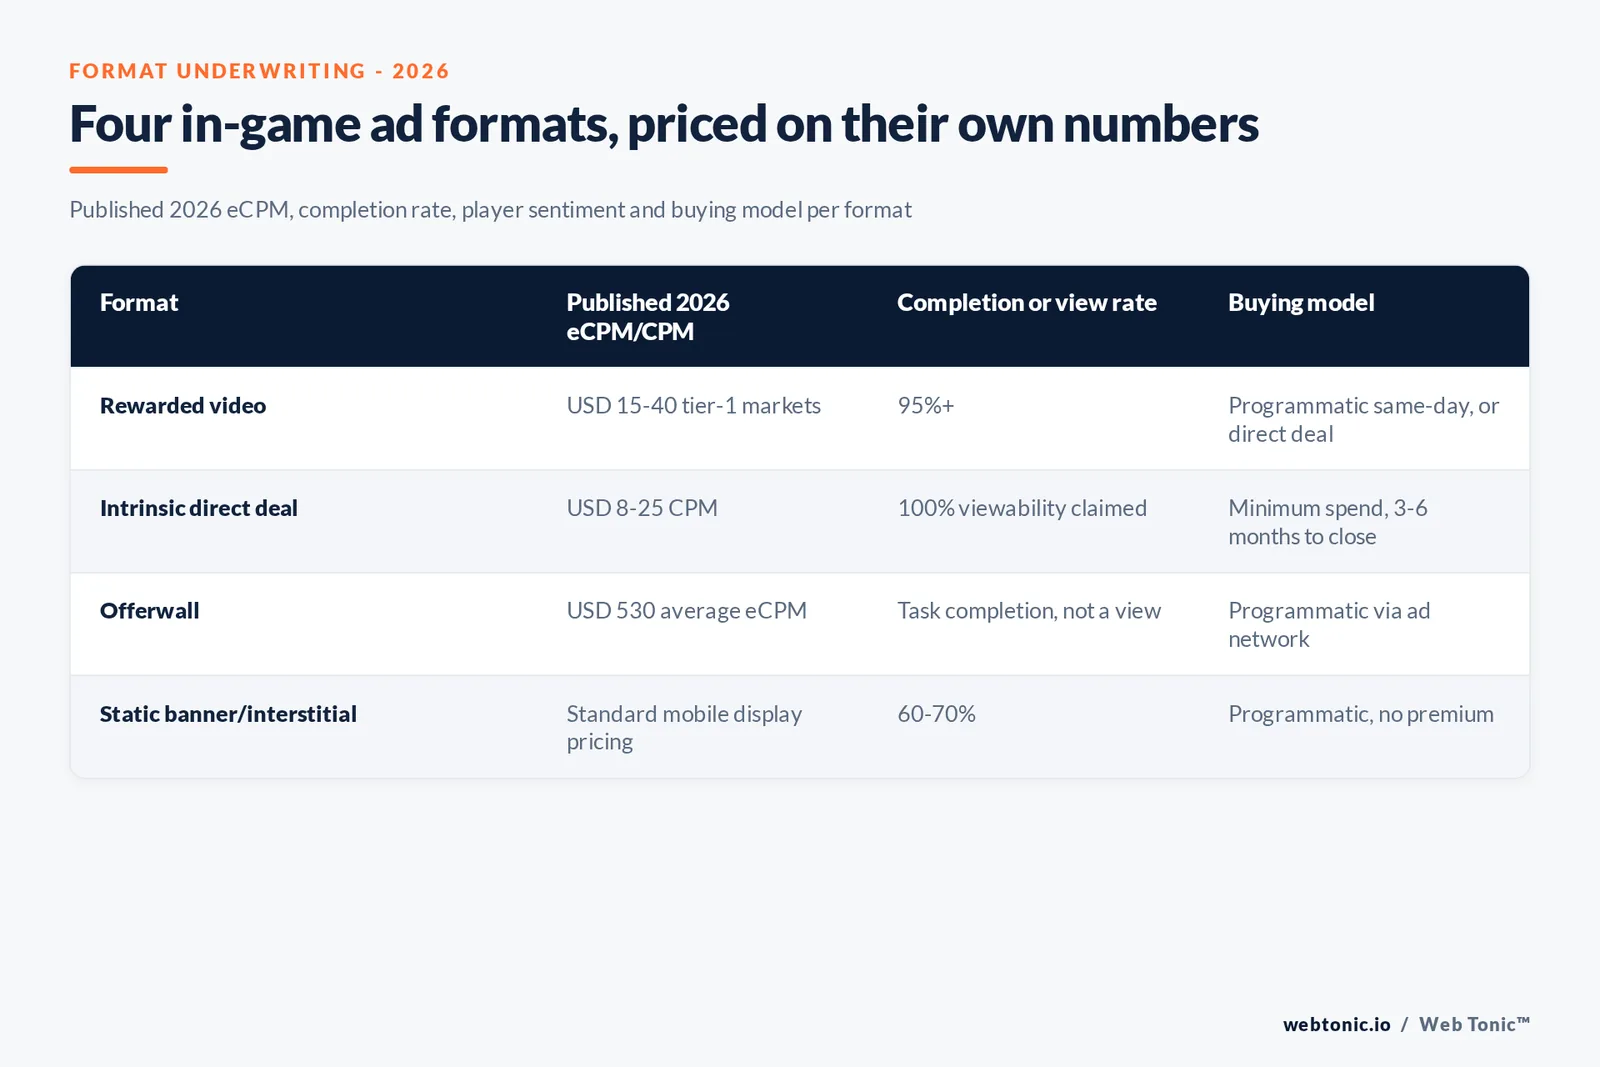
Two ways to buy in-game inventory exist side by side. A direct deal with a game studio guarantees a minimum spend at an agreed CPM, typically USD 8-25 for intrinsic placements or USD 15-40 for rewarded, with the studio guaranteeing a minimum impression volume and any overage flowing to the open programmatic market. Programmatic buying through platforms built for the format, rather than one-off studio relationships, starts revenue on day one instead of the 3-6 months a direct deal typically takes to close.
The practical sequence: establish a baseline eCPM and fill rate programmatically first, then use that data as leverage in direct conversations once volume justifies a guaranteed deal.
| Buying model | Time to launch | Typical rate structure | Best fit |
|---|---|---|---|
| Programmatic, rewarded | Same day | USD 15-40 eCPM, market-set | Testing the format before committing |
| Programmatic, intrinsic | Same day | USD 8-25 eCPM, market-set | Ambient brand presence at scale |
| Direct deal, minimum spend | 3-6 months to close | Agreed CPM plus guaranteed impressions | Sustained spend once volume is proven |
| Offerwall placement | Varies by network | USD 530 average eCPM | High-intent, task-completion audiences |
What would make this a bad buy
The same completion-rate research that makes rewarded video look strong also flags the failure mode: loading latency is the dominant factor degrading completion on the open web, and every second of pre-roll delay costs finish rate because the player assumes the ad failed to load. Creative length compounds it - 15- and 30-second cuts complete reliably, while a 60-second spot in a casual game can lose 10 to 20 completion points against a shorter cut.
Buy the format on its own terms: short creative, verified completion signal before the reward fires, and a network with low latency, not a repurposed 30-second TV spot dropped into a mobile SDK.
Setting the budget line
Treat rewarded video as a performance-adjacent line inside a broader paid social and video budget, not a separate experimental category. At USD 15-40 eCPM with 95%-plus completion, the effective cost per completed view is competitive with premium video inventory elsewhere, and the opt-in mechanic removes the skip-rate variable that erodes video ROI on open platforms. Static in-game placements should be budgeted and measured like any other mobile display line, since the data does not support paying a premium for them.
If in-game inventory is one line in a wider paid-social plan, our performance creative practice can help brief rewarded-video creative to the completion-rate variables above before the first dollar goes out.
How to pilot it without overcommitting
Start programmatic, cap the pilot to rewarded and offerwall formats only, hold creative to 15-30 seconds, and measure completion rate and eCPM against the benchmarks in the first table before deciding whether a direct studio deal is worth the 3-6 month close time. If completion tracks below 90%, the problem is almost always latency or creative length, not the format itself.
For a broader read on how this format fits against other paid-media lines, see our breakdown of what paid social actually costs, or talk to us about where in-game inventory fits your channel mix.
What the advertiser side of the deal actually needs
None of the eCPM or completion data above matters if the creative itself does not fit the format. Rewarded video and offerwall placements are opt-in - the player has already decided the exchange is worth their attention - which means a repurposed 30-second broadcast spot underperforms a creative built for a 15-second, verified-completion moment. Brief the creative to the format's own attention pattern, not to the channel's largest available unit length.
| Creative brief input | What the data says | Why it matters |
|---|---|---|
| Length | 15-30 seconds completes reliably | 60-second cuts lose 10-20 completion points |
| Reward clarity | Grant only on verified completion | Ambiguity drives early exits |
| Network latency | Dominant factor on open-web inventory | Every second of pre-roll costs completion |
| Format fit | Rewarded and offerwall outperform static | Static formats price like standard mobile display |
Frequently Asked Questions
Is in-game advertising worth it in 2026?
For a rewarded-format budget, yes on the numbers: eCPMs of USD 15 to 40 in tier-1 markets with completion above 95% beat most open-web video inventory on a cost-per-completed-view basis. For static banner or interstitial buys inside games, the case is weaker, since those formats sit closer to standard mobile display pricing without the same attention premium.
What is a realistic eCPM for in-game ads?
Rewarded video runs USD 15 to 40 in tier-1 markets, with US iOS around USD 19.63 and Android around USD 16.49 in recent industry tracking. Direct intrinsic-ad deals with a minimum spend commitment typically clear at USD 8 to 25 CPM, cheaper than rewarded but without the opt-in attention boost.
How big is the in-game advertising market right now?
Sizing depends on scope. The Business Research Company puts the in-game advertising market at USD 12.5 billion in 2026, growing to USD 20.7 billion by 2030 at a 13.5% CAGR. Sensor Tower's H1 2026 gaming index puts total gaming digital ad spend at USD 7 billion across 41 markets for the half-year alone, up 8% period on period, so the two figures measure different things: ad-format spend versus all gaming-app advertising.
Do players actually respond to ads inside games?
The data says mostly yes for opt-in formats. MAF's analysis of 500-plus mobile games found 9 in 10 players interact with rewarded ads and 85% say they enjoy the reward exchange. Anzu's player research found 75% of gamers positive or neutral toward in-game advertising generally, which is the format's real advantage over interruptive mobile ad formats.
What kills an in-game ad campaign's return?
Load time and format mismatch. Completion-rate research ties most of the variance in rewarded-video completion to loading latency, ambiguous reward timing and creative length over 30 seconds. A 60-second spot in a casual game can cost ten to twenty points of completion versus a 15- or 30-second cut.
Sources
MAF - Rewarded ads performance insights, 500+ games analyzed
The Business Research Company - In-Game Advertising Global Market Report 2026
Sensor Tower - H1 2026 Gaming Digital Market Index
IAB - 2026 Ad Spend Outlook Study, September Update
SocialPeta x Singular x Aarki - 2026 Global Mobile Gaming Marketing Trends White Paper
Anzu - Intrinsic in-game advertising, player research


