



Table of contents
X sells some of the cheapest reach in paid social — $0.74 CPC and CPMs near $5.65 — largely because advertisers left. For a heating and ventilation contractor, that combination of low cost and low competition creates a handful of genuinely useful plays and a great many ways to waste money. Here is the 2026 data.
Key Takeaways
- Median CPC is $0.74 (range $0.27-$1.95); CPM $5.65-$6.46, below Meta.
- Average CTR is 0.86%; promoted video leads at 1.24%.
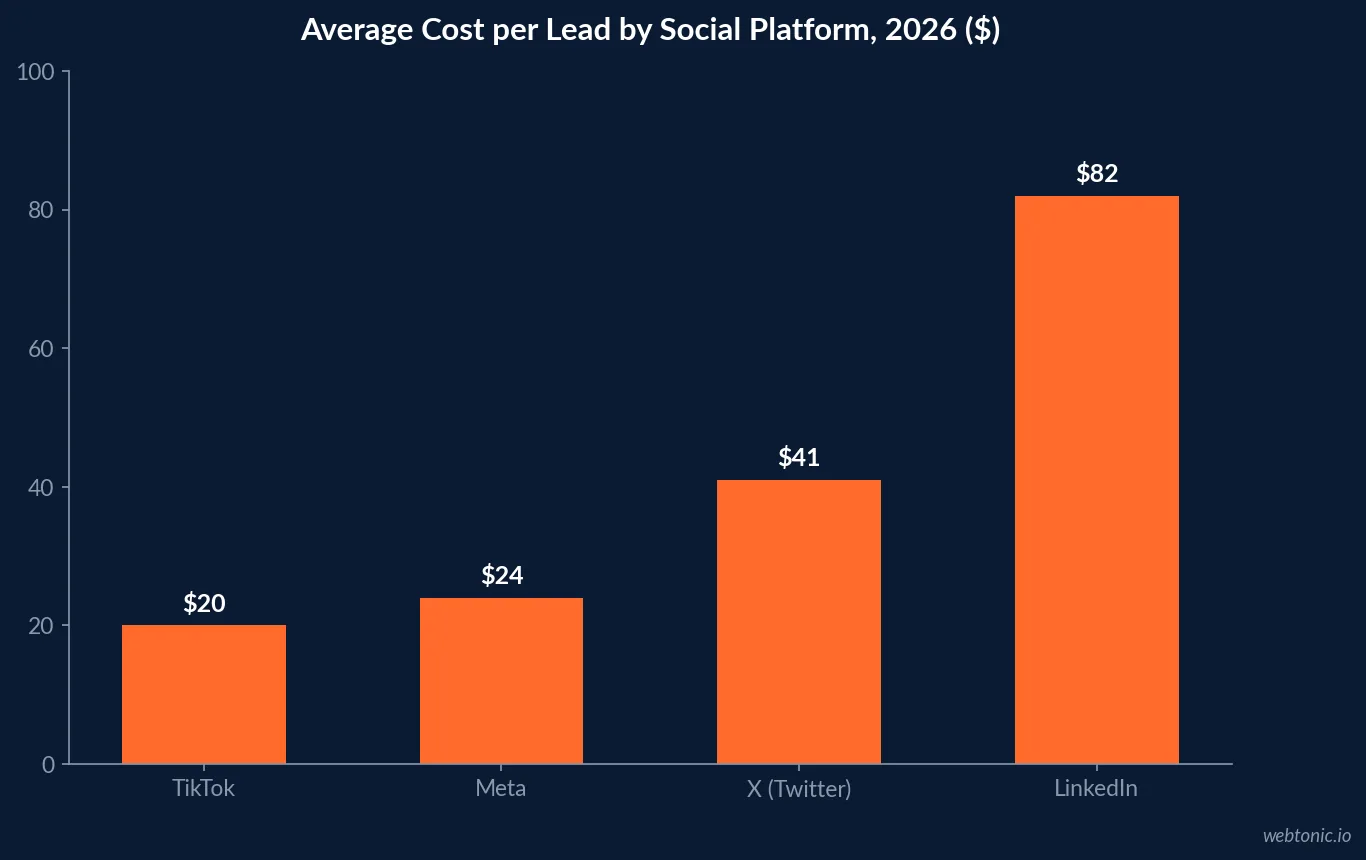
- Average CPL is $41 — versus LinkedIn $82, Meta $24, TikTok ~$20.
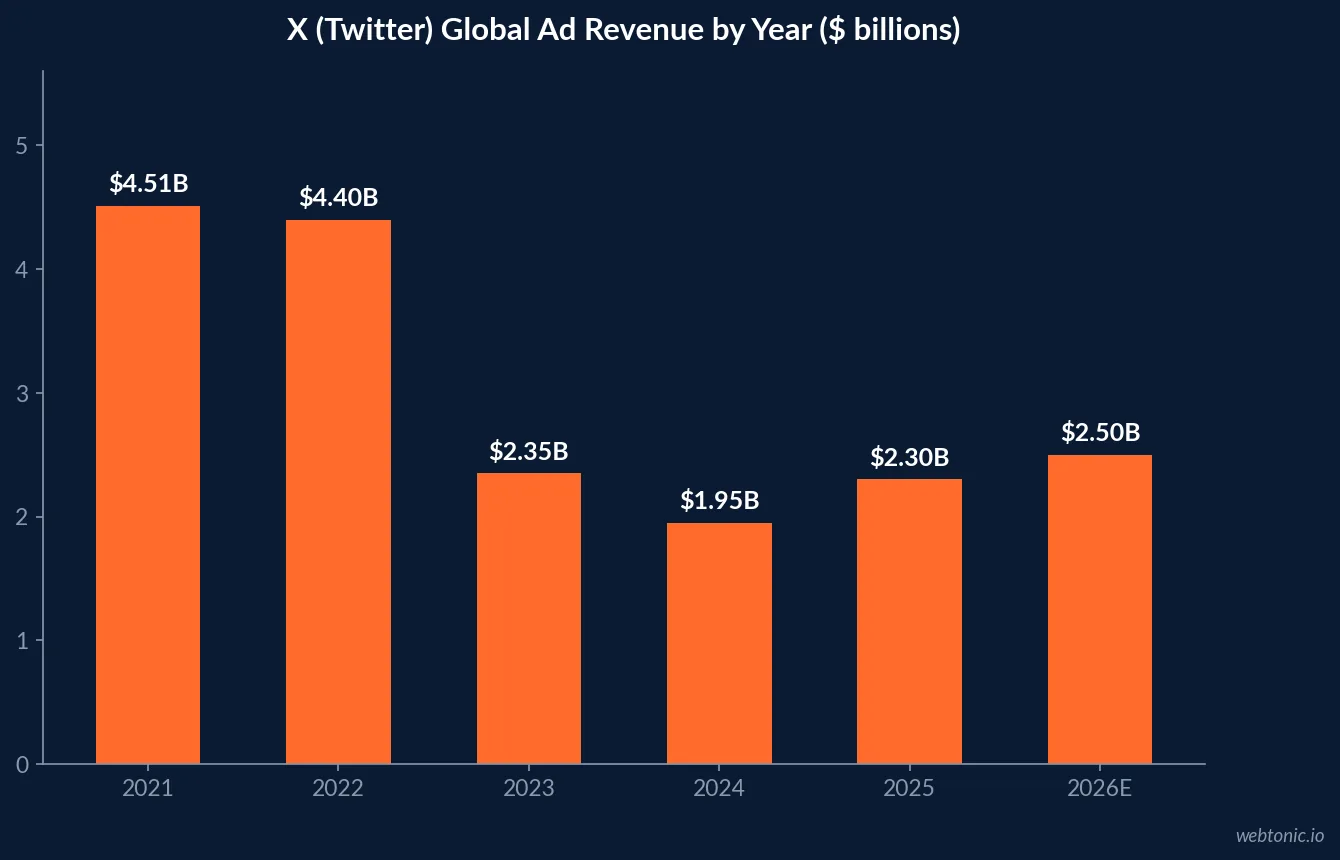
- Ad revenue is ~54% below its 2021 peak ($4.51B → ~$2.5B), though Q1 2026 rose 17% to $752M.
- Keyword targeting lifts CTR ~31%; location-targeted promoted posts convert at ~2.5x.
- Video drives 2.6x the engagement of images; vertical video performs 28% better.
- Visitor-to-lead is 0.69% against LinkedIn’s 2.74%, with lead quality ~34% weaker.
- HVAC search still delivers $145-$185 CPL at a 7.1% conversion rate — X is not a substitute.
1. The 2026 Cost Table
Aggregated 2026 platform benchmarks and comparative cost analysis agree on the shape: X is cheap on the top-of-funnel metrics and mediocre on the ones that matter to a service business.
| Metric | X (Twitter) | Comparison | Note |
|---|---|---|---|
| Average CPC | $0.74 | Meta $1.41 | Range $0.27-$1.95 |
| Average CPM | $5.65-$6.46 | Facebook $7.19 | Some datasets cite $2.09 |
| Average CTR | 0.86% | Facebook 0.90%, LinkedIn 0.65% | Pinterest 1.16% |
| Promoted video CTR | 1.24% | Highest format on platform | Vertical +28% |
| Cost per engagement | $0.15-$0.50 | Cheap but non-revenue | Vanity risk |
| Average CPL | $41 | LinkedIn $82, Meta $24 | TikTok ~$20 |
| Average CPA | $18.50-$21.55 | Objective-dependent | Conversion campaigns |
Two cost quirks are worth knowing before a first campaign. There is no minimum spend, which makes a $300 local test genuinely feasible, but the premium takeover inventory is priced for global brands — Promoted Trends run $100,000 to $250,000 per day and Timeline Takeover starts around $25,000 per day. A contractor lives entirely in promoted posts, where contractor-focused analysis reports $0.26 to $1.50 per first action on budgets of $1,000 to $5,000 a month.
2. The Platform Contraction, in Numbers
Any media plan that includes X has to price in the platform’s trajectory. Revenue tracking lays out the decline and the partial recovery.
| Year | Global ad revenue | Change |
|---|---|---|
| 2021 (peak) | $4.51B | Last full year as a public company |
| 2022 | ~$4.4B | Last strong year |
| 2023 | $2.2B-$2.5B | −46% vs 2022 |
| 2024 | $1.9B-$2.0B | Continued decline |
| 2025 | ~$2.3B | Partial stabilisation |
| 2026 (est.) | ~$2.5B | ~54% below peak |
The supporting detail is consistent: UK revenue fell 58% to $39.8M in 2024 from $95.2M, WARC estimates a $5.9B cumulative gap against the pre-acquisition trajectory, and advertiser-sentiment reporting notes a $577M net loss and a Fidelity mark valuing the company at $12.5B, 72% below the $44B purchase price. Against that, Q1 2026 reporting shows $752M in quarterly revenue, up 17% year over year. Subscriptions have not filled the gap — they contribute under 4% of revenue, with only 0.21% of users paying for Premium.
3. Audience: Big Reach, Wrong Shape
2026 audience data still shows meaningful scale, but the composition is poorly matched to residential HVAC demand.
| Audience metric | Figure | HVAC read |
|---|---|---|
| Monthly active users | 611M | 251M-259M daily |
| Gender split | 60.9% male | Skews away from household decision-makers |
| Urban share | 68% | Weak fit for suburban service areas |
| College-educated | 42% | Commercial B2B fit |
| Content concentration | 20% of users post 98% of content | Conversation is a minority activity |
| Average daily time | 34 minutes | Flat since 2022 |
| Company posting cadence | 4.1 posts/week | Down 23% from 2022 |
| Engagement rate (brand posts) | 0.12% | vs TikTok 3.70% |
That 0.12% brand engagement rate is the single most important audience number for a contractor: organic presence on X returns effectively nothing, so anything achieved here is paid. Compare that with the organic-leverage channels covered in our HVAC social media marketing statistics.
4. Keyword Targeting: The Reason to Bother
X is the only major social platform where targeting can key off what someone just posted. Keyword-targeting analysis and promotion mechanics research quantify the lift.
| Targeting approach | Measured effect | HVAC application |
|---|---|---|
| Keyword targeting vs interest-only | +31% CTR | “AC broke”, “no heat”, “power outage” |
| Location-targeted promoted posts | ~2.5x conversion rate | Metro-level service area |
| Promoted tweet CTR range | 1%-3% | Above platform average |
| Follower look-alike targeting | Reach expansion | Local news and utility accounts |
| Conversation topic targeting | Event-driven | Heat waves, cold snaps, storms |
| Retargeting site visitors | Cheapest CPM path | Requires pixel installed |
The realistic HVAC play is event-driven and short-lived: when a metro hits a heat advisory or a hard freeze, local conversation volume spikes for 48 to 72 hours, and keyword plus geo targeting puts a same-day service offer directly into it at a sub-dollar click. That is a genuinely distinct capability — no other social platform buys real-time complaint intent this cheaply. It requires operational readiness to answer the phone, which is why the measurement stack in our data intelligence work matters more than the media buy.
5. Lead Quality Is the Catch
| Quality metric | X (Twitter) | Benchmark | Implication |
|---|---|---|---|
| Visitor-to-lead rate | 0.69% | LinkedIn 2.74% | 4x weaker funnel |
| Reported lead quality gap | ~34% lower | vs platform averages | Higher disqualification |
| Conversion rate range | 1%-3% | Objective-dependent | Wide variance |
| Advertisers cutting spend | 52% | 26% planned further cuts | Auction thinning |
| Brand-safety confidence | 4% rate X as brand safe | 12% express trust | Kantar survey |
| Repeat-purchase evidence | Limited | Few documented case studies | Test small |
The credible positive case study is DTC rather than services — one apparel brand reported 3.1x ROAS on X against 1.8x to 2.4x on Meta — and it is an outlier, not a benchmark. For heating and ventilation, the economics comparison that matters is against search: 2026 HVAC marketing data shows $24 CPC, 7.1% conversion rate and $145-$185 CPL, plus 76% of HVAC searches on mobile and 22% of home-service searches now returning an AI answer before the click. A $41 X lead that closes at a third of the rate is not cheaper.
6. Creative and Format Data
2026 format analysis is unambiguous about where the remaining performance sits.
| Format / variable | Performance | Note |
|---|---|---|
| Video vs image engagement | 2.6x higher | Largest creative lever |
| Vertical 9:16 vs horizontal | +28% | Mobile-first feed |
| Promoted video CTR | 1.24% | vs 0.86% average |
| Video views YoY | +42% | Platform pushing video hard |
| Average video length | 47 seconds | Up from 34s in 2023 |
| Carousel clicks | +35% | vs single-image |
| Text-only promoted posts | Weakest | Avoid for direct response |
For a contractor the implication is cheap and practical: a 30-to-45-second vertical clip of an actual repair, captioned, outperforms any designed graphic. The same asset works across channels, which is the argument for producing it once and distributing everywhere — the approach behind our performance creative work.
7. Where X Fits a Contractor Media Plan
| Use case | Fit | Why |
|---|---|---|
| Emergency residential demand capture | Poor | Search owns urgent intent |
| Event-driven local reach (weather) | Strong | Keyword +31% CTR, geo 2.5x CVR |
| Commercial / property management | Moderate | 42% college-educated, B2B presence |
| Technician recruitment | Moderate | Cheap reach, trade communities |
| Brand awareness in a metro | Moderate | $5.65 CPM is the cheapest premium-feed reach |
| Retargeting site visitors | Strong | Low CPM, warm pool |
| Organic brand building | Poor | 0.12% brand engagement rate |
Commercial HVAC deserves a specific note. Building-management, facilities and property-portfolio buyers are B2B, long-cycle and account-based, which is closer to the LinkedIn model documented in our HVAC LinkedIn Ads statistics. X’s advantage there is purely price — a $41 CPL against LinkedIn’s $82 — offset by markedly weaker firmographic targeting.
8. Budget Guardrails for a Test
| Guardrail | Setting | Rationale |
|---|---|---|
| Test budget | $500-$1,500 over 30 days | No minimum spend requirement |
| Share of digital budget | ≤5% | Lead quality 34% weaker |
| Objective | Website clicks or conversions | Avoid engagement objectives |
| Targeting | Keyword + geo, layered | +31% CTR and ~2.5x CVR |
| Creative | Vertical video, 30-45s | 2.6x engagement, +28% vertical |
| Kill threshold | CPL > 2x search CPL at 30 days | Search CPL $145-$185 |
| Attribution | Call tracking mandatory | Phone leads close ~46% |
| Review cadence | Weekly | Thin auctions move fast |
Contractors should size this against total marketing budget: benchmark spend runs 6% to 9% of revenue for maintenance-mode operators and 10% to 18% for aggressive growth. At a 5% cap, X is a few hundred dollars a month — the correct order of magnitude for a channel with real upside on weather events and no dependable baseline.
One further constraint is worth naming for franchise and dealer-network operators: brand-safety perception. In Kantar survey data only 4% of marketers rate X as brand safe and 12% express trust in the platform, which in practice means a franchisor marketing committee may simply refuse the channel regardless of its cost efficiency. Independent operators do not carry that constraint, and it is one of the few areas where a single-location contractor has a structural advantage over a national brand — they can test cheap inventory that larger competitors are contractually barred from touching.
9. Signals to Watch Through 2026
| Signal | Current reading | What a change would mean |
|---|---|---|
| Quarterly ad revenue | $752M, +17% YoY | Sustained growth = rising CPMs |
| Advertiser return rate | 52% had cut spend | Auction competition returns |
| xAI targeting rollout | Rebuilt ad platform | Better local relevance for trades |
| Video share of feed | +42% views YoY | More cheap video inventory |
| Brand-safety perception | 4% rate as safe | Franchise approval risk |
| Premium adoption | 0.21% of users | Ads stay the whole business |
The strategic asymmetry is that today’s low prices exist because of yesterday’s advertiser exodus. If the Q1 2026 recovery holds, the arbitrage closes; if it does not, reach keeps eroding. Either way the answer for a heating and ventilation business is the same — keep the exposure small, keep the tracking tight.
10. The Bottom Line
- Cheap clicks, weak leads. $0.74 CPC and $41 CPL against 0.69% visitor-to-lead.
- Buy events, not always-on. Heat waves and freezes are the real use case.
- Keyword + geo or nothing. +31% CTR and ~2.5x conversion when layered.
- Vertical video only. 2.6x engagement, +28% versus horizontal.
- Ignore organic. 0.12% brand engagement rate.
- Cap at 5% of digital spend. Platform revenue is still 54% below peak.
- Track phone calls. Phone leads close near 46% versus 7.8% for forms.
- Re-evaluate quarterly. Q1 2026 grew 17% — pricing may not stay this soft.
For 2026, X is a tactical instrument for heating and ventilation, not a channel: a low-cost way to reach a specific metro during the 72 hours when its HVAC conversation spikes, plus a cheap retargeting surface. Everything else in the trade’s funnel — emergency demand, replacement quotes, maintenance plans — is better served by search, local and brand work covered in our HVAC digital marketing statistics and HVAC branding statistics. If you want the media mix modelled properly, talk to our team.
Frequently Asked Questions
What do X (Twitter) Ads cost an HVAC contractor in 2026?
Median CPC sits at $0.74 with a working range of $0.27 to $1.95, CPM lands between $5.65 and $6.46, and cost per engagement runs $0.15 to $0.50. Promoted-post CPC is reported higher at about $1.35 in some 2026 datasets, and promoted posts cost $0.26 to $1.50 per first action. Average CPL is $41 — cheaper than LinkedIn at $82 but well above TikTok at roughly $20 — and CPA benchmarks cluster around $18.50 to $21.55.
Is X still a viable advertising platform after the revenue decline?
It is viable but shrinking. Ad revenue peaked at $4.51B in 2021, fell to roughly $4.4B in 2022, then $2.2B to $2.5B in 2023 — a 46% collapse — and estimates for 2026 sit near $2.5B, about 54% below peak. UK revenue alone dropped 58% year over year to $39.8M. The counter-signal is Q1 2026 revenue of $752M, up 17% year over year. For an advertiser the practical consequence is thinner auction competition and low CPMs, alongside brand-safety and reach uncertainty.
Does keyword targeting on X work for heating and cooling businesses?
It is the platform's most useful feature for a service trade because it targets what people are posting about rather than who they are. Keyword-targeted campaigns show about 31% higher CTR than interest-only targeting, and location-targeted promoted posts have been measured converting at roughly 2.5x the rate of untargeted equivalents. Practically that means bidding on heat-wave, power-outage and frozen-pipe conversation in a specific metro during the days that conversation spikes.
What creative format performs best for X Ads?
Video, decisively. Video generates about 2.6x higher engagement than image formats, vertical 9:16 video performs roughly 28% better than horizontal, and promoted video ads carry the highest CTR at 1.24% against a 0.86% platform average. Average video length on the platform has grown to 47 seconds from 34 seconds in 2023, and video views were up 42% year over year, so short explainer clips fit the current feed better than static promos.
Should an HVAC company advertise on X at all?
Only in narrow cases, and never as a primary channel. The visitor-to-lead rate of 0.69% is low against LinkedIn's 2.74%, and lead quality has been measured about 34% weaker than platform averages. The defensible use cases are event-driven local reach during weather spikes, commercial and property-management audiences that live on the platform, cheap conversation monitoring in a service area, and recruitment. HVAC lead economics still favour search at a $145 to $185 cost per lead that closes.
Sources
SearchLab — X (Twitter) Statistics 2026
The Global Statistics — X/Twitter Advertising Statistics
HeyOz — Are X (Twitter) Ads Worth It?
Christoph Olivier Consulting — Twitter/X Ads 2026
True Interactive — Where Does X Stand With Advertisers in 2026
HowSociable — X Ad Revenue Q1 2026
Core6 Marketing — Promoting on Twitter/X
Aiken House — Keyword Targeting on X in 2026
Gray Reserve — X's Ad Platform for Service Contractors
SocialNexis — X (Twitter) Statistics 2026
RYN Digital — HVAC Marketing Statistics 2026


