Table of contents
Heating and ventilation is the textbook commodity-feeling category, and the data shows what that sameness costs: average service calls of $89 to $200 against $250 to $400 for premium-branded contractors doing identical work. Meanwhile only 15% of homeowners request an equipment brand by name. The brand that actually decides the sale is yours. Here are the 2026 numbers.
Key Takeaways
- 87% of contractors say homeowners rely on them to pick the equipment brand; only 15% of homeowners request one by name.
- Premium-branded contractors charge $250-$400 per service call vs $89-$200 nationally.
- Distinctive brands command 13%-46% price premiums in commodity categories; branded contractors charge 15%-30% more.
- A wrapped truck delivers 30,000-70,000 daily impressions at a $0.48 CPM vs $3.56 for billboards.
- Consistent brand presentation is linked to a 23% revenue uplift (up to 33% in later research); consistent colour lifts recognition up to 80%.
- Average contractor margins are 2.5%-5% while the top 1% reach 15%-25%.
- 69% of homeowners hire a contractor they have used before or that was recommended to them.
- Across roughly 120,461 US HVAC businesses the largest player holds under 2% market share.
HVAC Branding Benchmarks at a Glance
The table consolidates Journela's HVAC brand identity analysis, brand consistency research compiled by DashoContent and Cascade DM's contractor branding data.
| Metric | Figure | What it tells you |
|---|---|---|
| Average service call, unbranded | $89 - $200 | The price-shopper market |
| Average service call, premium brand | $250 - $400 | Same work, different perceived value |
| Price premium, distinctive brands | 13% - 46% | McKinsey, commodity-feeling categories |
| Price premium, branded contractors | 15% - 30% | Versus minimally branded local competitors |
| Average contractor profit margin | 2.5% - 5% | Where price competition leads |
| Top 1% contractor margin | 15% - 25% | Where brand-led positioning leads |
| Revenue uplift, consistent branding | 23% (up to 33%) | Most-cited brand consistency research |
| Recognition uplift, consistent colour | Up to 80% | Colour applied across all touchpoints |
| Identity development investment | $5,000 - $15,000 | Strategy, logo system, colour, typography |
| Typical template logo spend | $79 | The most expensive logo most contractors buy |
Read the first two rows together. The gap between an $89 service call and a $250 one is not technician skill — it is what the customer believes before anyone picks up the phone. On 800 service calls a year that spread is roughly $128,800 of margin decided by branding.
1. Who Actually Chooses the Brand
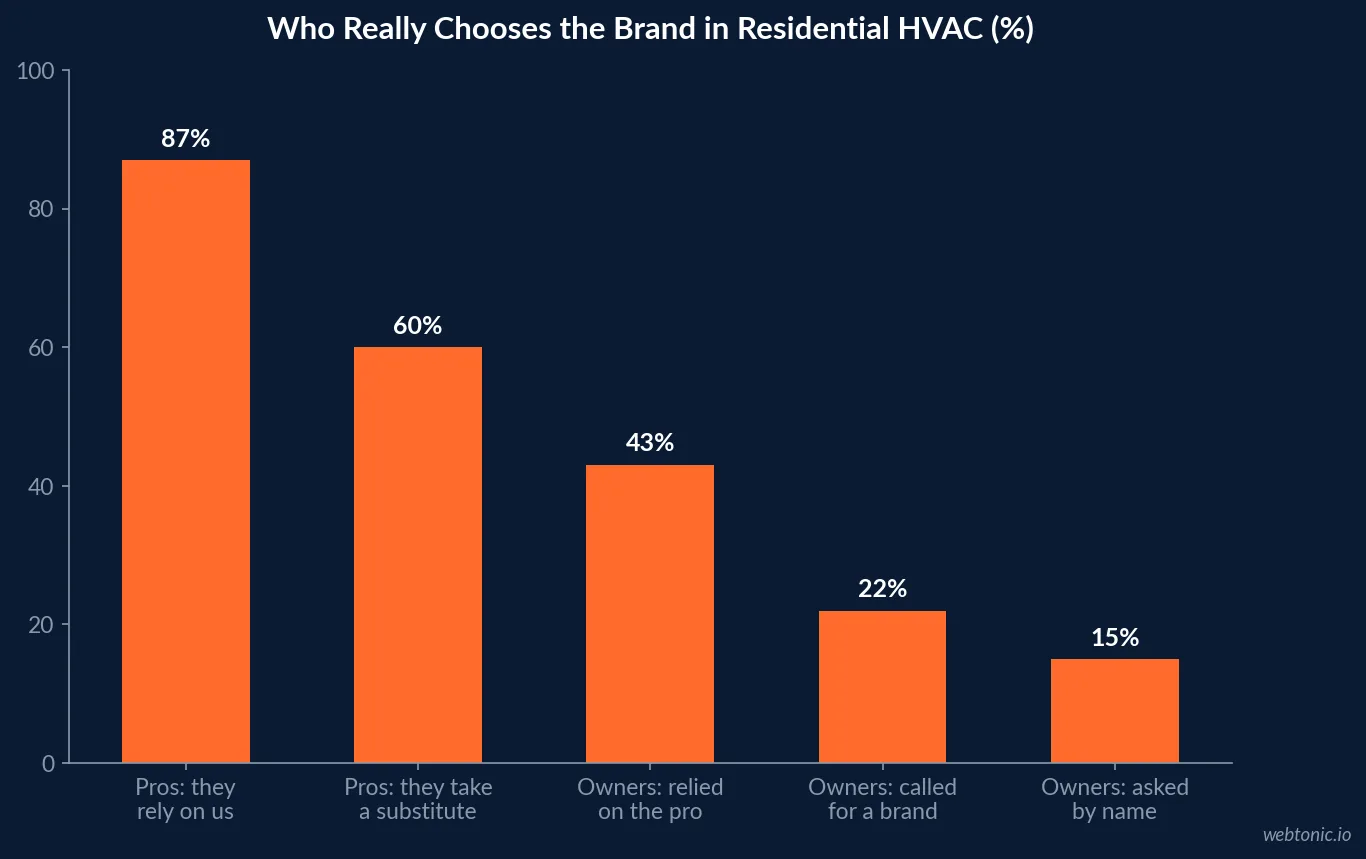
The most useful primary research in this category is a myCLEARopinion survey of 120 contractors and about 400 homeowners, reported by ACHR News. It settles a long-running argument.
| Finding | Figure | Implication |
|---|---|---|
| Contractors: homeowners rely on us for brand choice | 87% always or frequently | Equipment brand is a contractor decision |
| Contractors: homeowners accept a substitute brand | 60% | Brand loyalty is soft at the point of sale |
| Homeowners: relied on contractor to decide | 43% | Homeowners credit themselves with more input |
| Homeowners: called because of brands carried | 22% | Equipment brand rarely generates the call |
| Homeowners: requested a brand by name | 15% | Manufacturer pull is minimal |
| Consumers choosing a system on brand reputation | 7% | Equipment reputation is not the deciding factor |
Search data reinforces it. Industry practitioners tracking homeowner search behaviour report that queries for manufacturers like Carrier or Trane are very low relative to 'HVAC repair near me' and 'AC repair near me'. Meanwhile Lifestory Research's 2026 America's Most Trusted study has named Trane the most trusted HVAC brand for the twelfth consecutive year — genuine manufacturer equity that still does not translate into homeowners requesting it. As contractors told ACHR News, homeowners are inclined to trust the contractor's local brand presence instead.
2. Why Every HVAC Company Looks the Same
Journela's analysis identifies four structural causes of visual sameness, each with a cost attached: template logos bought for $79 from logo generators, fear of standing out, a "just the facts" mentality that treats branding as fluff, and price-driven decision-making that never calculates the lifetime cost of a weak brand.
The colour data is the clearest illustration. Roughly half of HVAC companies use blue and white and another 30% use red and white, leaving four in five contractors inside two palettes. The same convergence shows up in logo motifs — wrench-and-flame, snowflake-and-sun, thermometer icon — and in default WordPress typography on the website. The customer's problem is real: a homeowner cannot verify NATE certification or refrigerant expertise before paying, so visual signals are the only evidence available before the work is done.
3. Fleet Graphics: The Cheapest Branded Impressions in the Trades
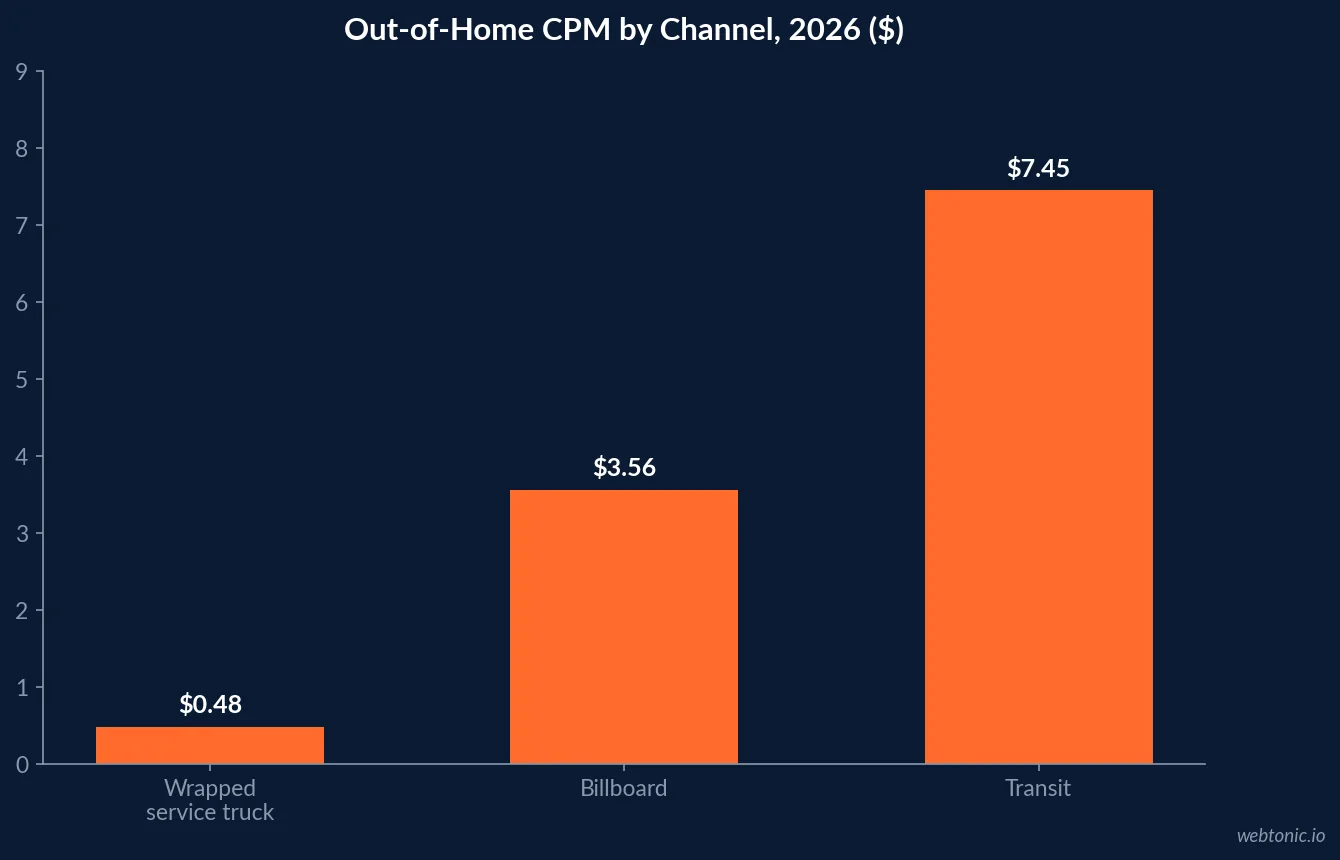
Nowhere else in the HVAC marketing mix does branding show a CPM this low. PipelineOn's analysis of OAAA data puts a single wrapped service truck at 30,000 to 70,000 daily impressions at a $0.48 CPM.
| Channel | CPM | Note |
|---|---|---|
| Wrapped service truck | $0.48 | Lowest CPM of any out-of-home channel |
| Billboard | $3.56 | Roughly 7x the cost per impression |
| Transit advertising | $7.45 | Roughly 15x the cost per impression |
| HVAC Google Ads (avg CPC) | $24 | Up 9% year over year |
| HVAC average cost per lead | $145 ($110-$185) | Paid search benchmark |
JedHead's ROI analysis makes the essential qualification: the metric that matters is not impressions but brand recall at the moment a customer needs the service. That only accumulates when the wrap carries the same logo, colours and typography as the website, the uniforms, the yard signs and the estimate PDF. A wrap designed independently by the wrap shop buys impressions and builds nothing.
Compare that $0.48 CPM with the 2026 paid-search benchmarks: a $24 average CPC and a $145 average cost per lead, with CPCs up 8-12% year over year. Branded assets do not replace demand capture, but they are the cheapest way to make demand capture convert — which is the argument for treating creative and identity work as a performance line item rather than an overhead.
4. Trust, Reviews and Referrals — Brand by Another Name
In a category where 69% of homeowners hire a contractor they have used before or that a friend or family member recommended, brand memory is the acquisition channel. PipelineOn's HVAC NPS benchmarks put cross-industry HVAC scores at 30-50 with elite operators above 70.
| Trust signal | Figure | Brand connection |
|---|---|---|
| Homeowners hiring prior or referred contractors | 69% | Requires a memorable name to refer |
| Consumers reading reviews before choosing | About 9 in 10 | Reviews attach to a recognisable brand |
| Typical HVAC NPS range | 30 - 50 | Elite operators exceed 70 |
| Homeowners preferring local or family-owned | 61% | Local identity beats national scale |
| Google listing with photos | +35% more clicks | Visual brand assets drive the click |
| Customers citing upfront pricing as a reason to choose | 73% | Only strong brands publish prices confidently |
| Conversion uplift from a single positive review | About 10% | Forgettable brands collect fewer reviews |
That 73% upfront-pricing figure from ServiceTitan's 2026 Residential State of the Trades report is the quiet one. Publishing prices is a branding decision disguised as an operations decision: contractors who believe their brand justifies their number will publish it, and price-shoppers self-select out. Contractors competing only on price cannot afford the transparency their customers say they want.
5. What Strong HVAC Brand Identity Includes
Journela's framework breaks identity into components, each with a benchmark for what "done" looks like in this trade.
| Component | Commodity default | Distinctive standard |
|---|---|---|
| Logo | $79 template, wrench-and-flame | $5,000-$15,000 identity built on positioning |
| Colour | Blue and white (about 50% of the market) | Unexpected pairings: charcoal and orange, green and cream |
| Typography | Default website fonts | Intentional type with a point of view |
| Photography | Stock models beside new condensers | Real technicians on real job sites |
| Fleet | Wrap-shop design | Wrap built from the brand system |
| Uniforms | Generic workwear | Same palette and mark as every other asset |
| Voice | Interchangeable service copy | Distinctive, specific messaging |
Real photography deserves a line of its own: it is repeatedly identified as one of the highest-converting elements on HVAC websites, and it is the component contractors skip most often because it costs money to produce. Stock imagery is the visual equivalent of the $79 logo.
6. Branding as Recruitment Infrastructure
The labour math makes identity a hiring tool. US Bureau of Labor Statistics projections put HVAC technician demand growth at 9% through 2033 with median wages near $59,610. In a shortage, technicians choose employers, and generic branding signals a one-person operation while a coherent identity signals a business worth building a career inside.
This is where brand spend produces compounding returns that never appear in a marketing report: lower recruitment cost, better technician retention, and the capacity growth that lets a contractor take the higher-value work in the first place.
7. Consolidation Raises the Stakes
The competitive backdrop has changed. DealSeam's 2026 roll-up tracker counts roughly 120,461 US HVAC contracting businesses with the largest single player holding under 2% market share — the textbook setup for consolidation. Private-equity add-on acquisitions have surged and PE firms now account for around half of HVAC M&A deals, with platforms rolling up regional contractors at 4-7x EBITDA.
| Market structure | Figure | Branding consequence |
|---|---|---|
| US HVAC contracting businesses | ~120,461 | Extreme fragmentation |
| Largest player market share | Under 2% | No dominant national brand exists |
| PE share of HVAC M&A deals | About 50% | Professionalised competitors entering local markets |
| Typical roll-up multiple | 4-7x EBITDA | Brand equity affects sale price |
| Combined HVAC and plumbing services market | About $205 billion | Roughly 105,000 establishments |
Two implications follow. Independent contractors now compete against consolidated platforms with real marketing budgets, so visual sameness is more expensive than it was five years ago. And for owners planning an exit, a distinctive brand with pricing power and recurring maintenance revenue is a valuation input — buyers pay for margins, and margins in this trade are a branding outcome.
8. Budget Benchmarks for Branding and Marketing
Built on Tenth's benchmark research shows the pattern that separates operators: top performers spend less as a share of revenue, because their brand does part of the work paid media otherwise buys.
| Quartile | % of revenue on marketing | Monthly spend ($2M company) |
|---|---|---|
| Top 25% | 6% - 9% | $10,000 - $15,000 |
| Middle 50% | 7% - 12% | $11,700 - $20,000 |
| Bottom 25% | 10% - 18% | $16,700 - $30,000 |
Contractor-wide benchmarks put healthy spend at 5% to 10% of gross revenue: below 5% is under-investment, and sustained spend above 12% usually signals broken unit economics — often a weak brand forcing the business to buy every lead. Against those figures a $5,000-$15,000 identity investment is a fraction of a single year of media, and unlike media it does not stop working when the budget pauses.
9. How Branding Shows Up in Digital Performance
Brand strength is measurable in the ad account. Contractors with 4.8-plus star Google ratings see 31% higher CTR as seller ratings surface on Search and Local Services Ads, and a Google Business Profile with photos attracts 35% more clicks. In 2026 an estimated 22% of home-service searches involve an AI-generated response before the click, which rewards brands with consistent, structured, well-cited information across the web.
The compounding logic is straightforward: a distinctive brand earns more reviews, more reviews raise CTR, higher CTR lowers CPC, and lower CPC funds more brand-building. Weak-brand contractors run the same loop in reverse and conclude that advertising does not work. For the broader channel picture in this trade see our heating and ventilation digital marketing statistics, and for how creative quality moves paid performance, our Google Ads strategy guide covers the mechanics.
10. What the Data Recommends
- Stop leading with the manufacturer. Only 15% of homeowners ask for a brand by name; 87% of contractors say the choice is theirs.
- Leave the blue-and-white palette. Roughly 80% of the trade sits in two colour schemes.
- Fund the identity once, properly. $5,000-$15,000 against a $128,800 annual margin swing on 800 service calls.
- Wrap the fleet from the brand system. A $0.48 CPM only compounds when the wrap matches everything else.
- Replace stock photography with real job-site work. Consistently one of the highest-converting site elements.
- Publish prices. 73% of customers cite upfront pricing as a primary reason for choosing a contractor.
- Engineer reviews deliberately. 4.8-plus ratings lift ad CTR 31%; 69% of hires are repeat or referred.
None of this is a design preference. In a market of 120,461 near-identical competitors where no player holds 2% share, differentiation is the only mechanism that moves a contractor out of the $89 service-call market — and the margin data shows exactly what that move is worth. Teams building the demand side alongside it can see how we approach it in growth marketing.
Frequently Asked Questions
Does branding actually change what an HVAC contractor can charge?
The pricing spread says yes. Average HVAC service calls run $89 to $200 nationally while premium-branded contractors routinely charge $250 to $400 for the same work. McKinsey's research on B2C differentiation finds distinctive brands command 13% to 46% price premiums in commodity-feeling categories, and contractors with professional branding and a strong online presence are documented charging 15% to 30% more than minimally branded competitors in the same market. Average contractor profit margins sit at 2.5% to 5% while top 1% performers reach 15% to 25%.
Do homeowners care about the equipment brand or the contractor brand?
The contractor brand, by a wide margin. In a myCLEARopinion survey of 120 contractors and about 400 homeowners, 87% of contractors said homeowners always or frequently rely on them to choose the equipment brand and 60% said homeowners will accept a different brand than the one requested. Only 22% of homeowners had called a contractor because of the brands they carry, and only 15% initially requested a brand by name. Search behaviour confirms it: queries for 'AC repair near me' massively outweigh queries for specific manufacturers.
What is the cheapest branded advertising channel in HVAC?
Fleet graphics, by an order of magnitude. A single wrapped service truck generates 30,000 to 70,000 daily impressions at roughly a $0.48 CPM, against $3.56 for billboards and $7.45 for transit advertising per OAAA data. The catch is that wraps only compound brand equity if the logo, colours and typography match every other touchpoint — an off-brand wrap designed by the wrap shop buys impressions without building recognition.
How much should an HVAC company spend on branding and marketing?
Contractor marketing spend benchmarks land at 5% to 10% of gross revenue, with top-quartile HVAC operators at 6% to 9% and bottom-quartile at 10% to 18%. Below 5% signals under-investment; sustained spend above 12% usually signals broken unit economics. Serious identity development — strategy, logo system, colour, typography, applications — typically runs $5,000 to $15,000, which pays back against a single $200 uplift on a few hundred service calls.
Does brand consistency have a measurable revenue effect?
The most cited research puts the uplift from consistent brand presentation at 23%, with a later update finding gains up to 33%; more conservative recent estimates land at 10% to 20%. Consistent colour use is credited with increasing brand recognition by up to 80%. Treat the exact percentage as directional — the reliable finding is that inconsistency is expensive, and the penalty appears to be growing as the number of channels a brand must show up on increases.
Sources
Journela — Why HVAC Companies Look Identical
ACHR News — Brand Importance in the HVAC Industry
ACHR News — HVAC Purchase Decision Factors
WebFX — Branding Statistics
DashoContent — Brand Consistency Statistics 2026
PipelineOn — Truck Wraps for Contractors
JedHead — Do Fleet Wraps Increase Business
Cascade DM — Construction Branding
RYN Digital — HVAC Marketing Statistics 2026
Built on Tenth — HVAC Marketing Benchmarks 2026
DealSeam — HVAC PE Roll-up Tracker 2026
PipelineOn — HVAC NPS Benchmarks 2026