



Table of contents

A 561-organization MACH Alliance survey and a Forrester-audited Salesforce case study now give e-commerce teams a real budget line for headless commerce, not just a platform pitch. Together they show what a decoupled front end costs to run, what share of an IT budget it actually consumes, and where the return shows up first.
Key Takeaways
- 93% of surveyed organizations increased their MACH infrastructure in the past year.
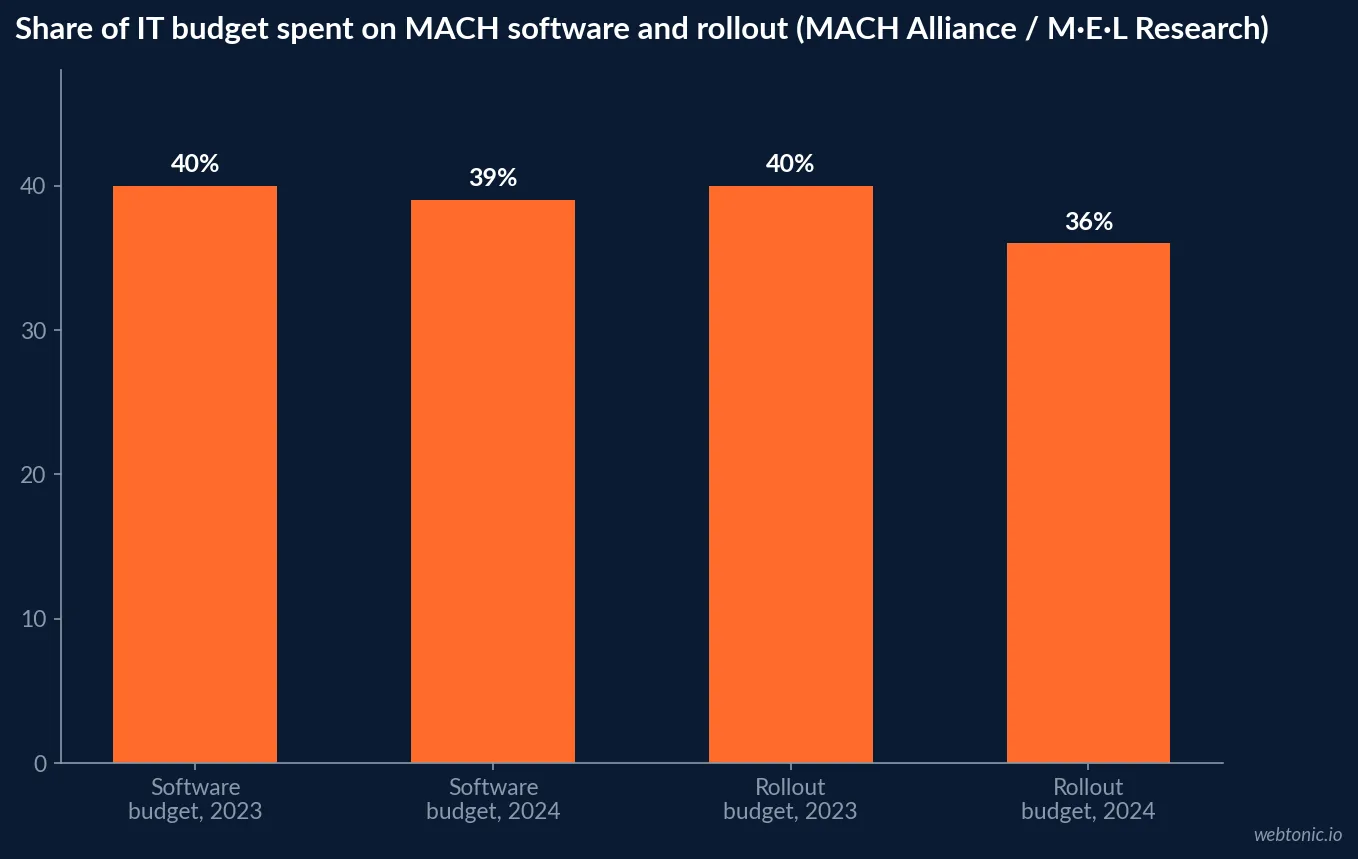
- The average firm spends 39% of its IT budget on MACH software alone.
- Another 36% goes to implementation of that software.
- Firms with 51%-plus legacy tech spend 48% on software just to catch up.
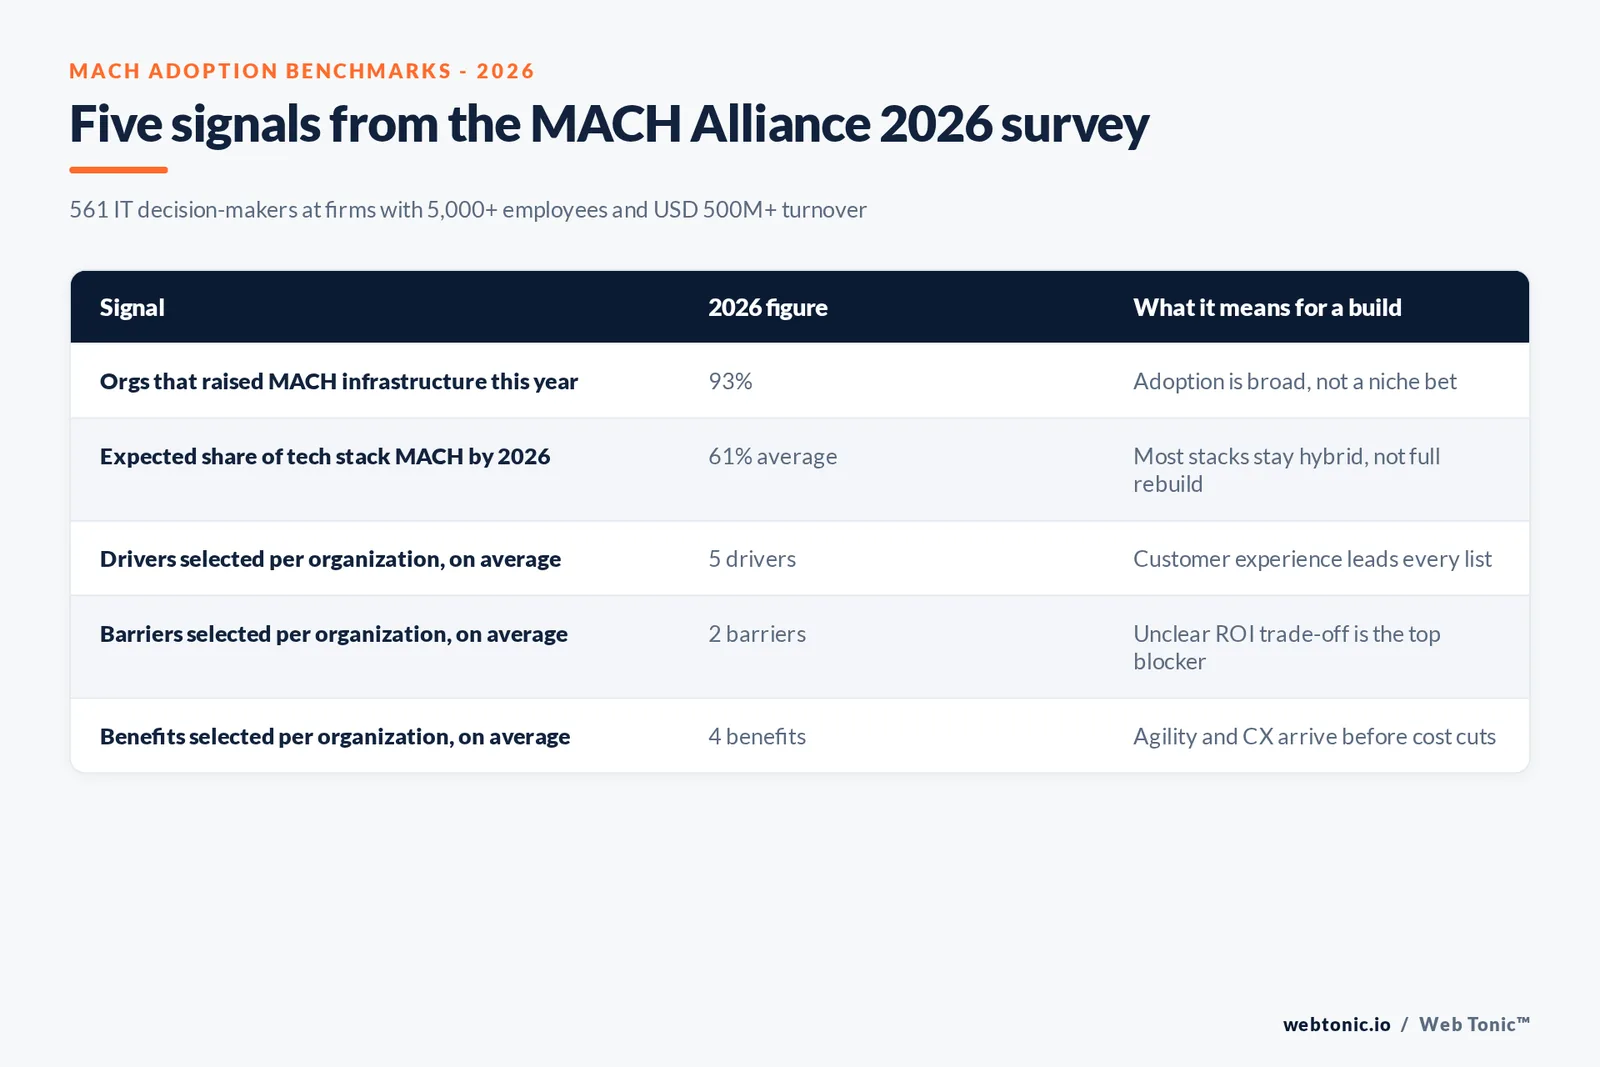
- 61% of the average tech stack is expected to be MACH or composable by 2026.
- Respondents named 5 adoption drivers on average, led by customer experience.
- Respondents also named 2 barriers on average to implementation.
- 31% call the investment trade-off unclear - the top-cited barrier.
- A Forrester-modeled composable storefront returned 271% ROI over three years.
- That build carried a USD 7.46 million net present value.
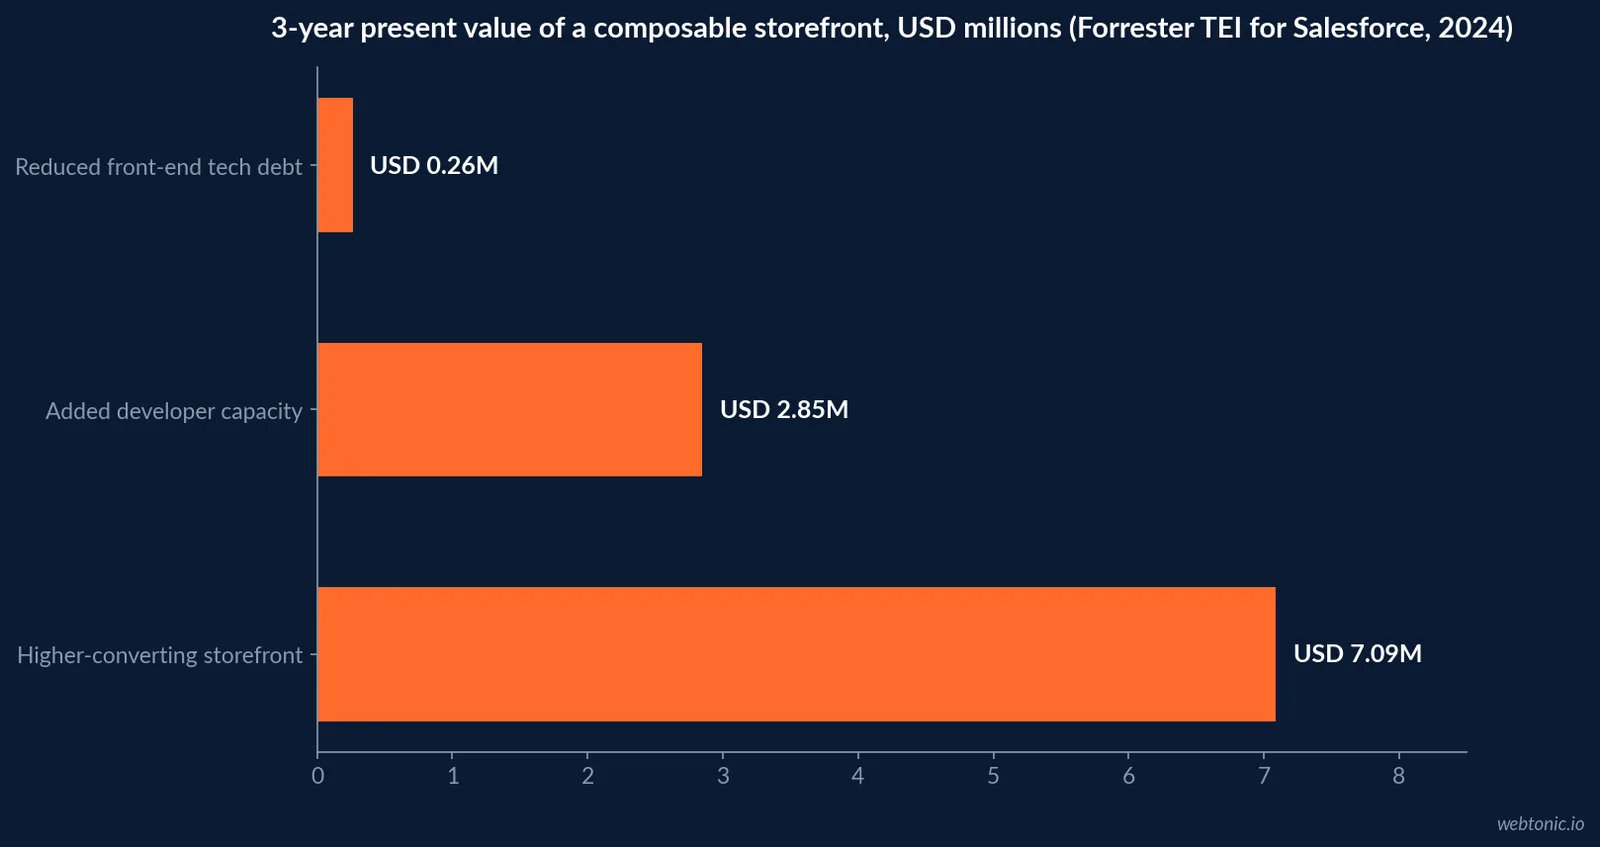
- Added developer capacity was worth USD 2.85 million of that value.
- A conversion lift from 2.5% to 3.0% was worth USD 7.09 million.
- Reduced front-end tech debt added USD 264,000 more.
- External licensing costs totaled USD 1.09 million over three years.
- Internal labor and integrator costs totaled USD 1.50 million.
- 55% of MACH adopters report better customer experience as a direct benefit.
- 93% of brands surveyed by Alokai have gone composable in some form.
What "headless commerce" is buying, in plain terms
Headless commerce decouples the storefront a shopper sees from the backend that manages products, pricing, and orders, connecting the two through APIs instead of a single monolithic platform. The MACH Alliance's 2025 Global Annual Research Report, based on a survey of 561 IT decision-makers at organizations with 5,000-plus employees and at least USD 500 million in global annual turnover, is the clearest independent read on how far that shift has gone and what it costs once it is live.
The short version: adoption is broad and accelerating, but the budget line is real and does not shrink quickly, even for teams that are already committed.
The budget line most teams underestimate
The MACH Alliance's survey asked organizations already running MACH what share of their IT budget goes to purchasing the software versus implementing it. The average firm reported 39% on software and 36% on implementation in its October 2024 wave, down only slightly from 40% and 40% a year earlier. That is not a rounding error - it means the typical adopter is putting three-quarters of its IT spend against MACH once the decision is made.
The number moves further for teams carrying more legacy technology. Organizations with 51% or more legacy tech reported spending 48% on software and 42% on implementation - a catch-up tax, not a discount for starting from a harder position.
| Budget line (2026 planning) | Average firm | 51%+ legacy tech firm | What drives the gap |
|---|---|---|---|
| Share of IT budget: MACH software | 39% | 48% | More components to replace at once |
| Share of IT budget: MACH rollout | 36% | 42% | More integration work per component |
| Firms increasing MACH infra, past year | 93% | 94% (technology sector) | Momentum, not a one-time push |
| Expected MACH share of stack by 2026 | 61% | Higher for mature adopters | Hybrid stacks remain the norm |
| Average drivers cited per organization | 5 drivers | n/a | Customer experience leads every list |
Where the resistance actually comes from
The same survey asked what holds teams back. On average, respondents named 2 barriers each, and the list is topped not by cost but by ambiguity: 31% say the trade-off between the initial investment and the long-term benefit is not clear. Internal resistance to change follows at 29%, then simply not having budget for the initial investment at 22%. Vendor lock-in concerns and a lack of internal skills each land near 20-26%.
That ordering matters for how a budget request should be framed. A request that leads with cost savings is answering a question fewer than a quarter of resistant stakeholders are actually asking. A request that leads with a documented payback model answers the concern that shows up most.
| Reported barrier to MACH implementation | Share citing it | What it signals |
|---|---|---|
| Trade-off between investment and benefit unclear | 31% | No credible ROI model has been shown yet |
| Internal team resistant to change | 29% | Change management, not tooling, is the gap |
| No budget for the initial investment | 22% | The ask has not been sized correctly |
| Reliant on current vendor for continuity | 26% | Migration risk outweighs the pitch so far |
| Lack of internal skills to implement | 24% | Hiring or partner support is the real blocker |
What a documented payback model actually looks like
The most detailed public payback model for a headless build comes from Forrester's Total Economic Impact study, commissioned by Salesforce and published in February 2024. Forrester interviewed four organizations running Salesforce Commerce Cloud Composable Storefront, built a single composite organization from their experience, and modeled a 271% three-year ROI with a USD 7.46 million net present value.
The value did not come primarily from cutting cost. It came from developers shipping more with the same headcount and from a conversion lift that a monolithic front end had not been able to deliver.
Where the value landed in the Forrester model
Three quantified benefits carried the case. Additional developer capacity - the composite organization more than doubled what its team could ship without adding headcount - was worth USD 2.85 million over three years. A conversion rate improvement from 2.5% to 3.0%, credited to better site performance and merchandising control, was worth USD 7.09 million in additional profit, by far the largest line. Reduced front-end technical debt, from decommissioning legacy pieces, added a further USD 264,000.
Against that, three-year costs were USD 1.09 million in external licensing and USD 1.50 million in internal implementation labor and systems-integrator time - a combined USD 2.6 million cost base against USD 10.2 million in quantified benefit.
| Line item (3-year present value) | Amount, USD | Category | Source |
|---|---|---|---|
| Added developer capacity | 2,850,000 | Benefit | Forrester TEI for Salesforce |
| Conversion lift, 2.5% to 3.0% | 7,090,000 | Benefit | Forrester TEI for Salesforce |
| Reduced front-end tech debt | 264,000 | Benefit | Forrester TEI for Salesforce |
| External licensing costs | 1,090,000 | Cost | Forrester TEI for Salesforce |
| Internal labor and integrator costs | 1,500,000 | Cost | Forrester TEI for Salesforce |
| Net present value | 7,460,000 | Result | Forrester TEI for Salesforce |
The benefit that shows up before cost savings does
Asked what benefits they had actually experienced, MACH adopters in the MACH Alliance survey ranked customer experience first at 55%, followed by improved systems and process integration at 54% and greater organizational agility at 50%. Reduced IT costs ranked sixth, at 42% - useful, but not the leading reason teams say the investment paid off.
Alokai's Composable Commerce Trends Report 2026, surveying 500-plus enterprise-grade professionals across the US, UK and Europe, reports that 93% of ecommerce brands have already gone composable in some form - a figure that lines up closely with the MACH Alliance's adoption data and suggests the debate has shifted from whether to build headless to how much of the stack to convert first.
| Reported benefit of MACH adoption | Share reporting it | Rank vs. cost savings |
|---|---|---|
| Customer experience is better | 55% | 1st |
| Improved systems and process integration | 54% | 2nd |
| Organization adapts faster / more agile | 50% | 3rd |
| Improved privacy and security | 48% | 4th |
| Reduced IT costs | 42% | 6th |
What drives the decision to migrate at all
The MACH Alliance survey also asked why organizations started the MACH journey in the first place. Improve customer experience tops the driver list at 61%, followed by ability to innovate faster (57%), improve privacy and security (54%), and improve competitive advantage (51%). Cost reduction sits further down that list at 50% - the same position it holds on the benefits side, which suggests teams are broadly honest about why they actually started the project versus what they hoped it might save.
commercetools and Deloitte Digital's joint TCO framework makes a related point from the vendor side: total cost of ownership on a composable stack has to include indirect costs - integration overhead, change management, and the cost of running two systems during a phased migration - not just the license line, or the business case will look better on paper than it performs once implementation starts.
| Adoption driver (why teams started) | Share citing it, 2026 | Rank |
|---|---|---|
| Improve customer experience | 61% | 1st |
| Ability to innovate faster | 57% | 2nd |
| Improve privacy and security | 54% | 3rd |
| Improve competitive advantage | 51% | 4th |
| Reduce costs | 50% | 5th (tied) |
| Respond to market changes faster | 50% | 5th (tied) |
How analysts are scoring the vendors behind the shift
The budget conversation does not happen in a vacuum - it happens against a vendor landscape analysts are actively re-ranking. MACH Alliance's Enterprise Technology Report for 2026 shifted focus toward AI readiness on top of composability, surveying 600 C-suite and IT leaders and finding organizations with a fully composable foundation report measurable AI ROI at roughly six times the rate of those still in early planning. That is a second, newer data point suggesting the budget case for headless is increasingly bundled with the AI roadmap, not separate from it.
Salesforce, commercetools, BigCommerce, VTEX and Adobe are the vendors most frequently benchmarked in these reports, and the Gartner Magic Quadrant for Digital Commerce - referenced across several vendor resource pages - continues to weight completeness of vision and ability to execute on composable architecture more heavily each cycle, which is itself indirect evidence that the shift is structural rather than a passing platform trend.
What a real build costs, outside the survey averages
The budget-share figures above are useful for planning against an existing IT budget, but teams scoping a first headless build usually need an absolute number too. Moydus's 2026 headless commerce guide, drawing on its own agency delivery data, puts a mid-complexity custom storefront on an existing commerce backend at USD 60,000 to 150,000, with a 10 to 18 week build timeline for a senior team - a range that lines up with the MACH Alliance's finding that most adopters run a hybrid rollout rather than a full rebuild in one pass.
That range sits well below the enterprise end some vendor case studies describe, which is a reminder that the MACH Alliance's respondent base skews toward organizations with 5,000-plus employees; a mid-market team scoping its first project should expect the lower end of published ranges, not the enterprise composite Forrester modeled.
| Build scope | Typical cost range, 2026 | Typical timeline | Source |
|---|---|---|---|
| Mid-complexity custom storefront on existing backend | USD 60,000-150,000 | 10-18 weeks | Moydus 2026 guide |
| Enterprise composable rebuild (Forrester composite) | n/a, ROI-modeled | Multi-quarter | Forrester TEI for Salesforce |
| Software share of ongoing IT budget | 39% average | Ongoing | MACH Alliance 2025 |
| Implementation share of ongoing IT budget | 36% average | Ongoing | MACH Alliance 2025 |
How to size the budget request instead of guessing
Start from the barrier that actually blocks approval - the unclear investment trade-off - and answer it with a scoped payback model rather than a platform comparison. Price the software line and the rollout line separately, since the MACH Alliance data shows they move independently and both run higher for teams with more legacy debt to migrate off. Then attach the request to a measurable lever, ideally conversion rate or developer throughput, because those are where Forrester's model shows the return concentrating, not the licensing line.
If the storefront work needs a partner rather than an in-house build, our growth marketing practice plans the commercial side of a replatform alongside engineering, our team background covers the technical delivery side of that same conversation, and our write-up on what paid search actually costs is a useful companion when the same budget cycle also has to fund the channels that will drive traffic to the new storefront.
Frequently Asked Questions
How much of an IT budget does headless commerce actually take?
The MACH Alliance's 2025 Global Annual Research Report, based on 561 IT decision-makers at organizations with 5,000-plus employees, found the average firm already running MACH spends 39% of its IT budget on purchasing MACH software and 36% on implementing it, down slightly from 39% and 40% a year earlier. Firms carrying 51%-plus legacy technology spend far more - 48% on software and 42% on rollout - because they are paying to catch up, not just to add capacity.
Does headless commerce actually pay back?
For one well-documented case, yes and by a wide margin. Forrester's Total Economic Impact study, commissioned by Salesforce in February 2024, modeled a composite retailer adopting Commerce Cloud Composable Storefront and found a 271% three-year ROI and a USD 7.46 million net present value, built mostly from added developer capacity and a conversion lift from 2.5% to 3.0%.
What is the single biggest barrier to starting a headless build?
An unclear trade-off between the initial investment and the long-term benefit. The MACH Alliance's 2025 survey put that at the top of the barrier list at 31%, ahead of internal resistance to change (29%) and simply not having budget for the initial investment (22%). Respondents cited an average of two barriers each, so the resistance is usually compounded, not singular.
Is headless commerce still growing or has adoption plateaued?
It is still growing. The MACH Alliance found 93% of surveyed organizations increased their MACH infrastructure in the past year, and the average firm expects 61% of its tech setup to be MACH or composable by the start of 2026. Alokai's Composable Commerce Trends Report 2026, surveying 500-plus enterprise professionals, put current adoption even higher at 93% of ecommerce brands having gone composable in some form.
What benefit shows up first after a headless migration?
Customer experience, consistently. The MACH Alliance's benefit list is topped by better customer experience (55%), improved systems and process integration (54%) and greater organizational agility (50%). Reduced IT costs ranks sixth at 42%, which matches Forrester's finding that the cost line is not where the ROI case is won - the conversion and capacity lines are.
Sources
MACH Alliance / M·E·L Research - 2025 Global Annual Research Report
Forrester - The Total Economic Impact of Salesforce Commerce Cloud Composable Storefront (2024)
Alokai - Composable Commerce Trends Report 2026
commercetools and Deloitte Digital - A Framework for Composable Commerce TCO
MACH Alliance - Enterprise Technology Report
Moydus - Headless Ecommerce Guide 2026: Architecture, Cost & When to Build


