



Table of contents
Freemium is usually pitched with the phrase "product-led growth," but the 2026 benchmark data says most freemium products convert under 5% of free users to paid, and free users cost real infrastructure money before they ever convert. This page prices what a growth team should actually budget for a freemium motion.
Key Takeaways
- The widely-cited freemium median conversion rate is 8%, per ChartMogul/ProductLed.
- Almost no product actually converts at that median - the distribution is bimodal.
- Roughly a quarter of freemium products convert under 2.5% of free users.
- Another 29% convert between 2.5% and 7.5%.
- About a quarter convert between 10% and 15%.
- OpenView's long-running benchmark puts the typical band at 2% to 5%.
- Hard-paywall apps convert at 10.7% versus 2.1% for freemium, a 5x gap.
- That gap narrows to near-parity on year-one retention.
- Per-user compute and storage cost can run USD 1 to USD 5 a year for typical SaaS.
- AI-native products can see USD 20 to USD 100+ a year per free user.
- Free users are documented to generate disproportionate support ticket volume relative to revenue.
- Spotify's premium penetration sits at roughly 38.5% of MAU in Q1 2026.
- Freemium apps account for a majority of app store downloads but a smaller revenue share.
- Freemium-based products draw about 13% of visits from low-cost, scalable channels.
The 8% median is quoted constantly and almost never actually hit
The most-cited freemium statistic is a median free-to-paid conversion rate of 8%, from ChartMogul's SaaS Conversion Report built with Kyle Poyar and ProductLed's 2026 survey of 200 software products. The number is real, but it is a median across a distribution where very few products cluster near it. Kyle Poyar's own analysis of the same dataset found roughly a quarter of products convert under 2.5%, another 29% land between 2.5% and 7.5%, and about a quarter reach 10% to 15%. The distribution is closer to bimodal than centered.
The practical implication for a growth budget: assume you will land somewhere in the lower half of that range unless your product already has strong activation data suggesting otherwise, and treat the 8% headline as an aspirational ceiling, not a planning assumption.
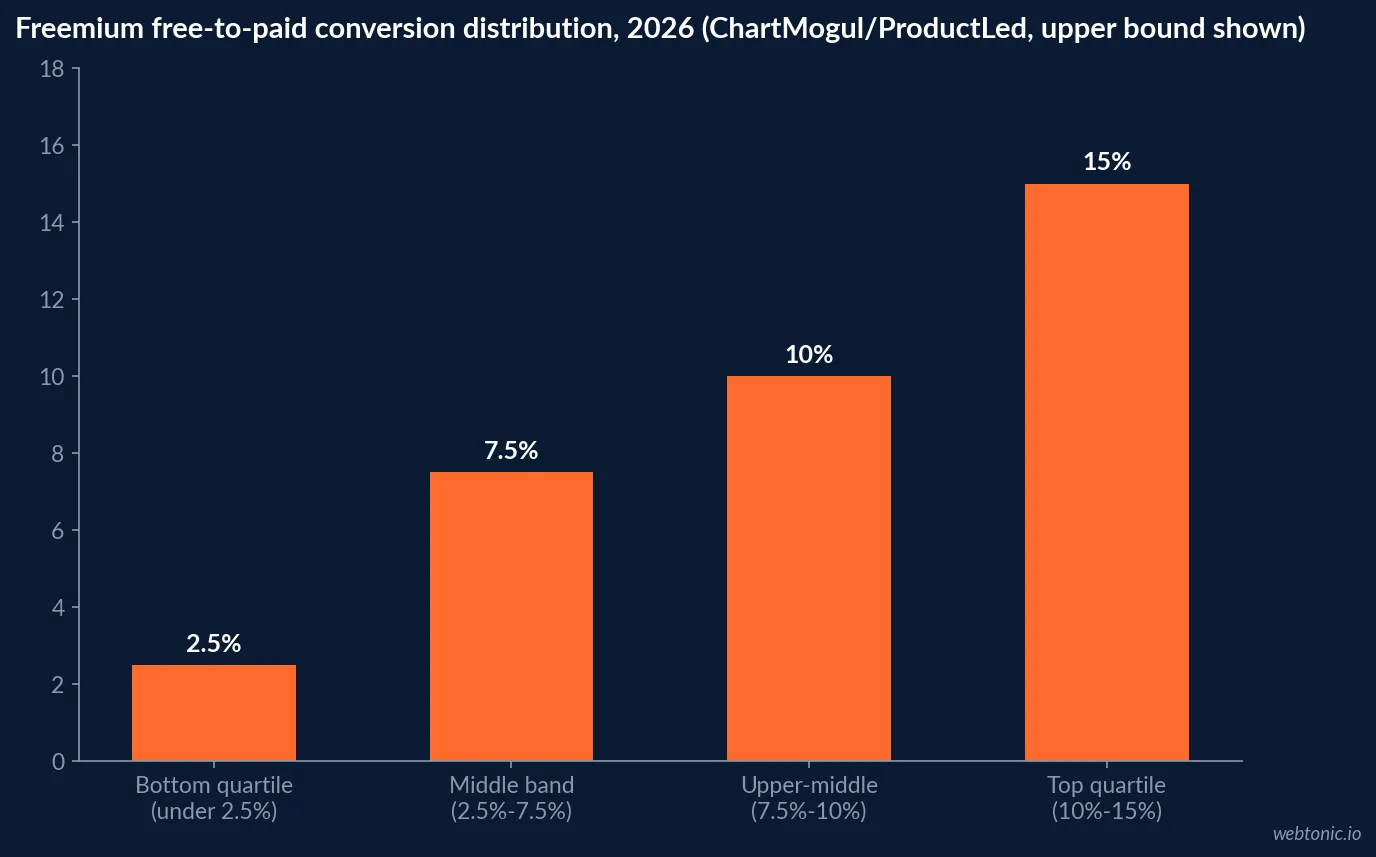
| Conversion band (2026 freemium data) | Share of products | What it means for budgeting |
|---|---|---|
| Under 2.5% | ~25% | Free tier is mostly a top-of-funnel cost center |
| 2.5% to 7.5% | ~29% | Typical, plan infrastructure spend against this band |
| 7.5% to 10% | ~21% (remainder) | Above-average product-market fit signal |
| 10% to 15% | ~25% | Rare; usually a narrowly-gated free tier |
| Quoted median (rarely hit) | 8% | Not a safe planning assumption on its own |
How freemium compares against a hard paywall
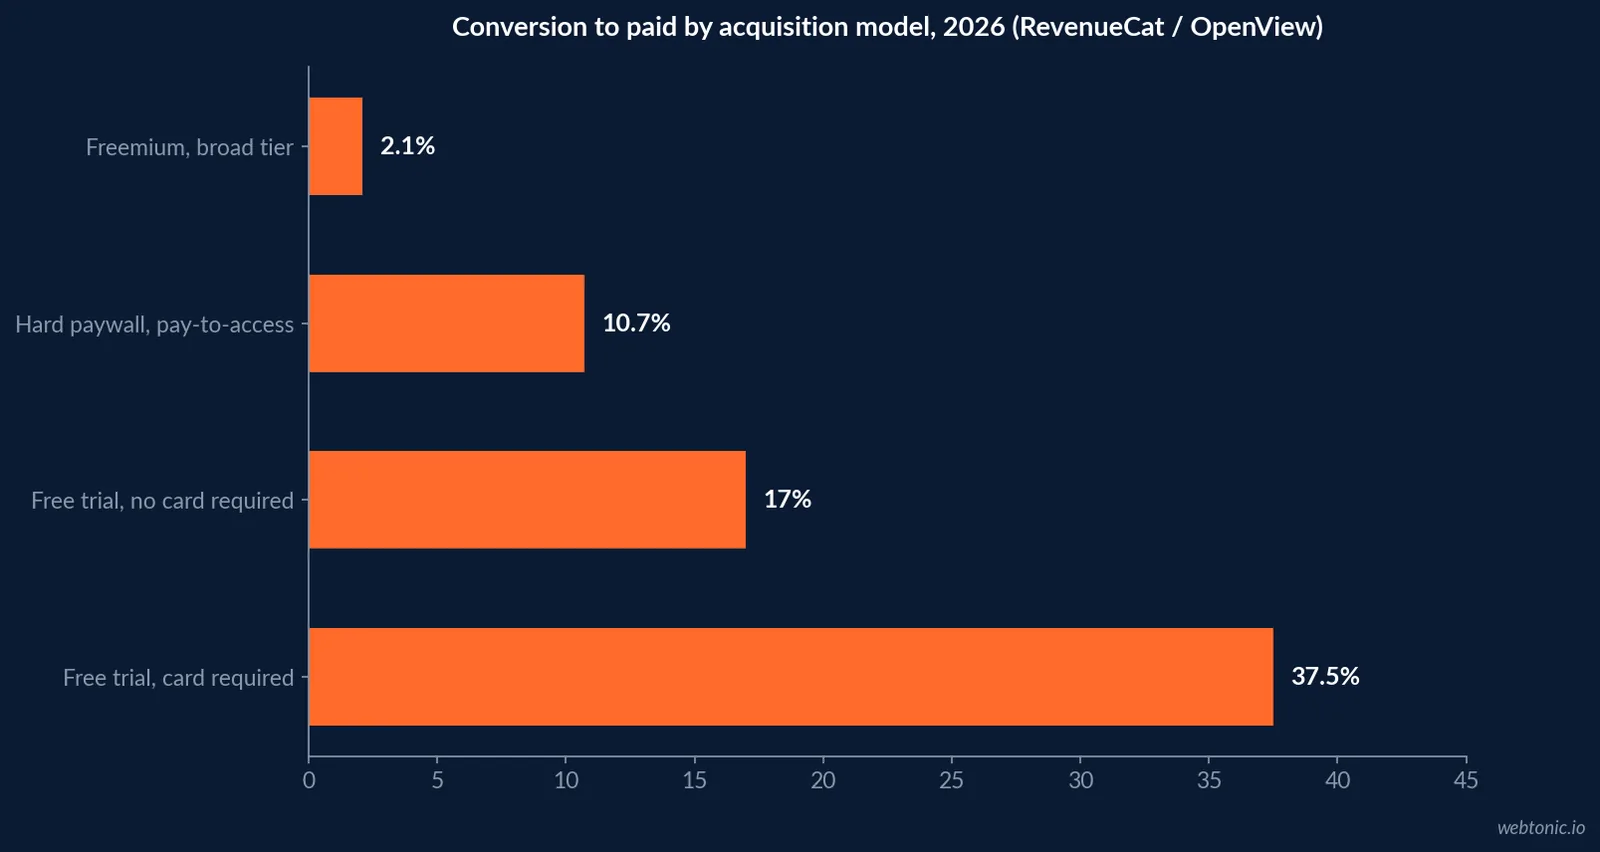
RevenueCat's State of Subscription Apps 2026 found that apps requiring payment before access - a hard paywall - convert trial starts to paid at 10.7%, versus 2.1% for freemium, roughly a five-times gap that has held across report years. The advantage largely disappears over a longer horizon: after one year, retention between the two models converges to near-parity, meaning freemium's real payoff is a larger top-of-funnel base and a lower-friction path to trial the product, not a superior long-run retention outcome.
OpenView's long-running Product Benchmarks work anchors the typical freemium free-to-paid conversion band at 2% to 5%, against free-trial conversion typically in the 17% to 35% range depending on whether a credit card is required upfront - a much wider structural gap than the headline 8% figure implies on its own.
| Model | Typical conversion to paid | Retention after 1 year | Source |
|---|---|---|---|
| Hard paywall (pay to access) | 10.7% | Comparable to freemium | RevenueCat 2026 |
| Freemium (broad free tier) | 2.1%-5% | Comparable to hard paywall | RevenueCat / OpenView |
| Free trial, no card required | ~17% | Varies by product | OpenView |
| Free trial, card required | 25%-50% | Varies by product | Industry benchmark aggregation |
| Narrow, use-case-gated freemium | 5%-15% | Higher engagement subset | Industry benchmark aggregation |
Free users are a cost center before they are a funnel
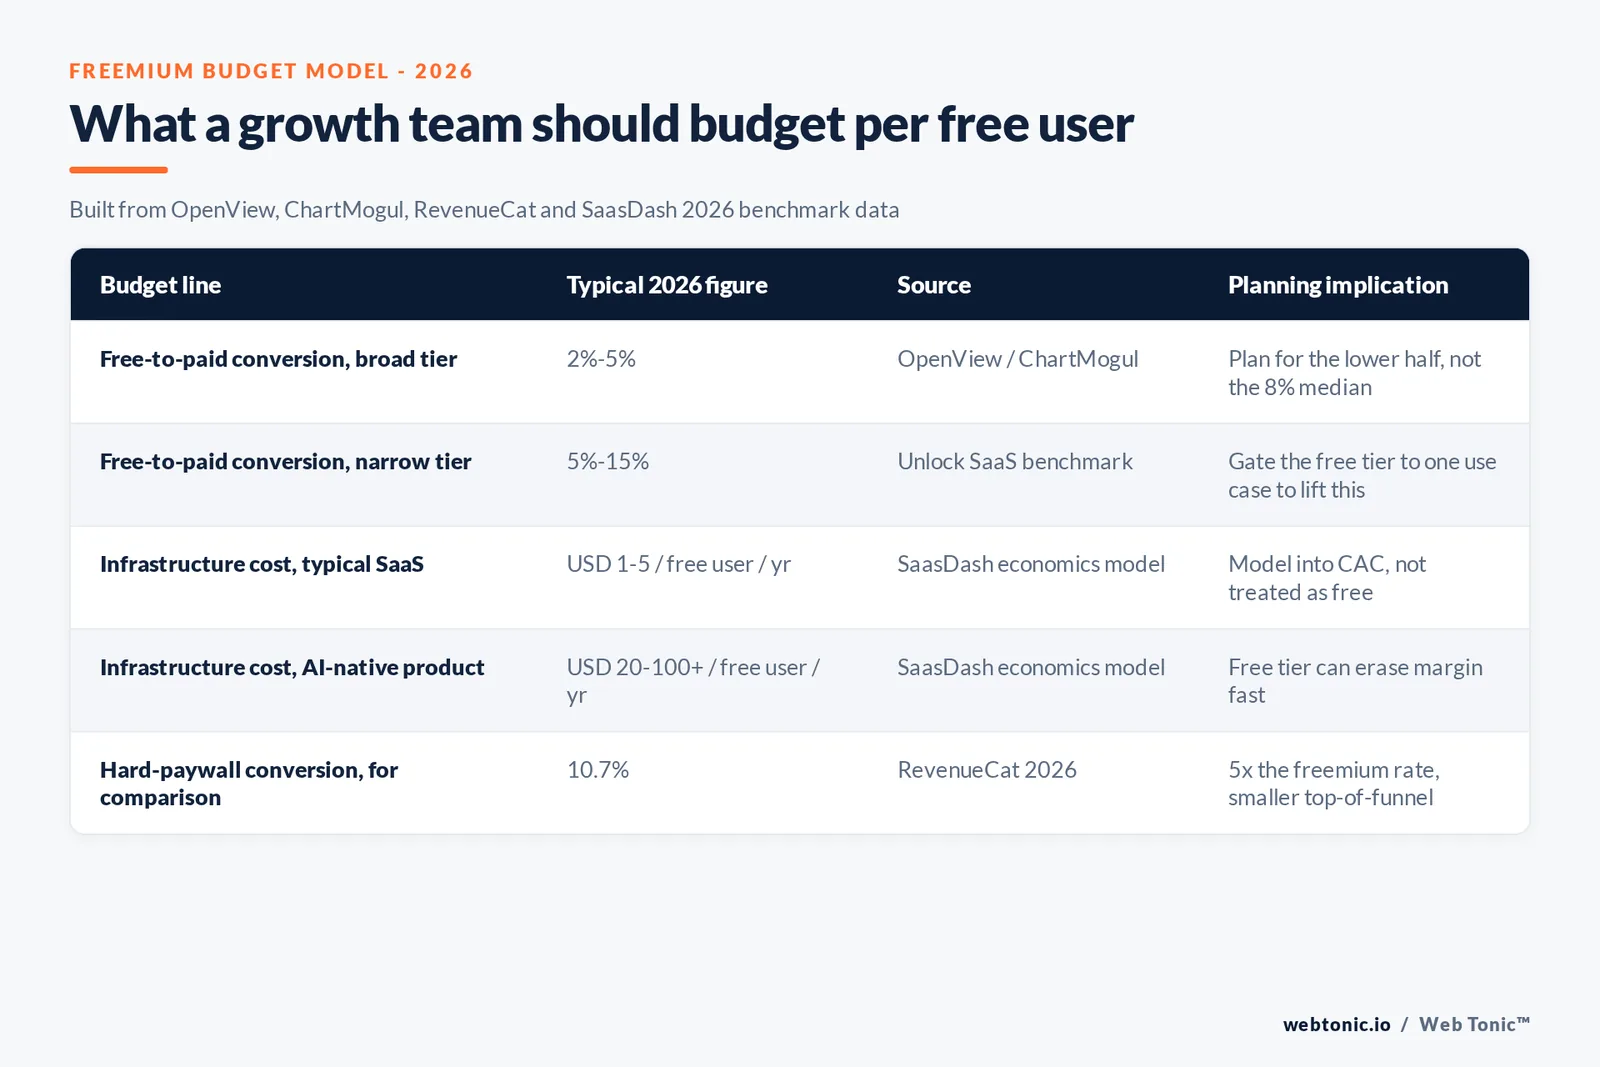
The part most freemium pitches skip: free users consume real spend indefinitely, on two separate lines. SaaS free-tier economics guidance puts typical compute, storage and bandwidth cost per genuinely active free user at USD 1 to USD 5 a year for conventional SaaS, climbing to USD 20 to USD 100 or more a year for AI-native products carrying inference cost per request. Separately, that same model flags customer-success benchmarking research showing free users generate a disproportionately larger share of support tickets relative to the revenue they produce than paying users do, meaning support load, not just infrastructure, scales with a growing free base.
Both costs have to be modeled explicitly into the customer acquisition cost math for the eventual paying customer, because they are paid on every free account regardless of whether that account ever upgrades. A freemium motion with a 2% conversion rate and USD 3 in annual free-user infrastructure cost alone is carrying roughly USD 150 in infrastructure spend for every paying customer it eventually produces, before support cost, marketing spend or sales cost are added on top. Andreessen Horowitz's guidance on optimizing a free tier frames the fix as watching conversion-to-paid, conversion-to-enterprise and cohort revenue retention together, rather than free-tier size alone, precisely because a growing free base with flat conversion is a cost problem dressed up as a growth metric.
Why the same "8% median" statistic keeps circulating unchanged
The 2026 survey behind the 8% figure is not the only source repeating it - Userpilot's analysis of the same 200-product Kyle Poyar/ChartMogul/ ProductLed dataset confirms the identical breakdown: a quarter of freemium products convert under 2.5% within six months, another quarter manage 10% to 15%, and the median sits in the gap between them rather than at either cluster. That consistency across independent write-ups of the same underlying survey is a good sign the distribution shape is real, not an artifact of one analyst's framing.
Unlock SaaS's ongoing benchmark tracker narrows the range further by model shape: broad freemium products (unlimited time, capped features) typically convert 1% to 4%, while narrow, use-case-gated freemium products (a specific workflow unlocked, everything else paywalled) convert 5% to 15% - a structural difference in how the free tier is scoped, not a difference in marketing execution.
| Freemium tier design | Typical conversion | Source |
|---|---|---|
| Broad freemium (most features free) | 1%-4% | Unlock SaaS benchmark |
| Narrow, use-case-gated freemium | 5%-15% | Unlock SaaS benchmark |
| Bottom quartile of surveyed products | Under 2.5% | ChartMogul / Userpilot |
| Top quartile of surveyed products | 10%-15% | ChartMogul / Userpilot |
| 1,200-company benchmark set, freemium band | ~2%-5% | Artisan Strategies 2026 |
How B2B and B2C freemium funnels differ in practice
A 2026 benchmark study of more than 1,200 companies by Artisan Strategies separates freemium free-to-paid conversion (roughly 2% to 5%) from credit-card-gated trial conversion (roughly 25% to 50%), noting explicitly that the two numbers measure different funnels and should not be compared as if they were competing tactics for the same product. B2B products with a longer sales cycle and a smaller total addressable market tend to lean toward gated trials specifically because a 2% to 5% freemium conversion rate on a small user base does not generate enough paying customers to matter; B2C and prosumer products with much larger addressable audiences can absorb a low conversion rate because the free-tier volume compensates for it.
The planning implication: a freemium motion is a volume play, and it only makes budget sense once your addressable free-user population is large enough that a 2% to 5% conversion rate produces a customer count worth the infrastructure and support cost calculated above.
What mature freemium products actually converge to
Public companies give the clearest long-run read on freemium ceilings. Spotify's own reporting put premium subscriber penetration at roughly 38.5% of monthly active users in Q1 2026 - built over nearly two decades of iterating the free-to-paid boundary. That is frequently cited as an aspirational freemium benchmark, but it understates how long it took to get there: younger freemium products, including fast-growing consumer apps still scaling their free base, typically convert a single-digit share of users in their early years, closer to the 2% to 5% range this page anchors on than to Spotify's mature-state number.
The lesson for a growth budget is sequencing: plan for a multi-year path from single-digit conversion toward a Spotify-like ceiling, not a same-year jump to it. Our data and analytics practice builds the cohort models that track that trajectory against your own product's activation data rather than an aspirational public-company comparison.
| Freemium maturity signal | Figure | Source |
|---|---|---|
| Spotify premium penetration, Q1 2026 | ~38.5% of MAU | Company reporting |
| Typical early-stage freemium conversion | 2%-5% | OpenView / ChartMogul |
| Freemium share of visits from low-cost channels | ~13% | OpenView Product Benchmarks |
| Freemium visit-to-signup rate, median | ~6% | OpenView Product Benchmarks |
| Years typically required to approach a mature ceiling | Multi-year, not single-year | Industry pattern |
Budgeting freemium without the growth-hack framing
Treat freemium as a three-line budget item: infrastructure and support cost per free user, expected conversion in the 2% to 5% band absent stronger activation evidence, and the multi-year timeline before that rate approaches a mature ceiling. A freemium motion is not a way to avoid paid acquisition cost - it moves part of that cost into infrastructure spend and stretches the payback period, which is a valid trade only if the resulting funnel is genuinely cheaper than the alternative on a fully loaded basis.
If you are modeling a freemium or free-trial motion against your own product's cost structure, talk to us, see how our growth marketing practice models funnel economics, or read our breakdown of channel-level acquisition cost in what paid search actually costs before comparing it against a free-tier funnel.
Frequently Asked Questions
What is a realistic freemium-to-paid conversion rate in 2026?
Most freemium products convert far below the widely-quoted 8% median. ChartMogul and ProductLed's 2026 survey of 200 software products found the median free-to-paid conversion rate is 8%, but very few products actually sit at that median - roughly a quarter convert under 2.5%, another 29% land between 2.5% and 7.5%, and only about a quarter reach 10% to 15%. OpenView's long-running Product Benchmarks work puts the typical band at 2% to 5% for broad freemium models. Budget against the 2%-5% range, not the 8% headline.
How does freemium conversion compare to a free trial?
Free trials convert several times better. RevenueCat's State of Subscription Apps 2026 found apps using a hard paywall (pay before access) convert at 10.7% versus 2.1% for freemium, a roughly five-times gap that has held across report years. The advantage narrows over the long run - after a year, retention for both models is nearly identical - so the freemium trade is lower initial conversion in exchange for a larger top-of-funnel audience and more marketing-vehicle value from the free tier itself.
Does a large free user base cost money even before it converts?
Yes, and it is a real line item, not a rounding error. SaaS free-tier economics guidance puts typical compute, storage and bandwidth cost per genuinely active free user at roughly USD 1 to USD 5 a year for conventional SaaS, climbing to USD 20 to USD 100 or more a year for AI-native products carrying inference cost. That same free-tier economics model also flags customer-success benchmarking research showing free users generate a disproportionately larger share of support tickets relative to the revenue they produce than paying users, so the true annual cost per free user is infrastructure plus a heavier support load, not infrastructure alone.
What do real public freemium products actually convert at?
It varies widely by product maturity and category. Spotify's premium penetration sat at roughly 38.5% of monthly active users in Q1 2026 per the company's own reporting, built over nearly two decades of product iteration. Duolingo, a younger freemium product, converts a far smaller share of its free base to paid subscribers, illustrating that Spotify's ~38% is closer to a ceiling reached over time than a typical starting benchmark for a freemium product to budget against.
How should a growth team size a freemium budget?
Model three numbers together: infrastructure cost per free user per month, expected conversion rate in the 2% to 5% band unless you have product-market-fit evidence for better, and the support cost load free users generate. A freemium product only pays for itself once paid-user revenue covers the infrastructure and support cost of the free base that produced it, which is a longer runway than most growth plans budget for in year one.
Sources
ChartMogul - The SaaS Conversion Report
Kyle Poyar, Growth Unhinged - The 2026 free-to-paid conversion report
OpenView - Guide to product-led growth benchmarks
RevenueCat - State of Subscription Apps 2026
Lenny's Newsletter - What is a good free-to-paid conversion rate
Axis Intelligence - Duolingo statistics, 2026 shareholder filings
SaasDash - PLG free tier design economics
Andreessen Horowitz - How to optimize your free tier
Userpilot - Why freemium-to-premium conversions are flopping
Unlock SaaS - Free-to-paid conversion benchmark
Artisan Strategies - SaaS conversion rate benchmarks 2026


