



Table of contents

The franchise industry is growing at a modest, steady pace in 2026 - but almost none of the growth statistics you will see in a sales deck say anything about the specific territory or brand you are being asked to buy into. This page separates the industry-wide numbers from the per-brand due diligence data a serious buyer actually needs.
Key Takeaways
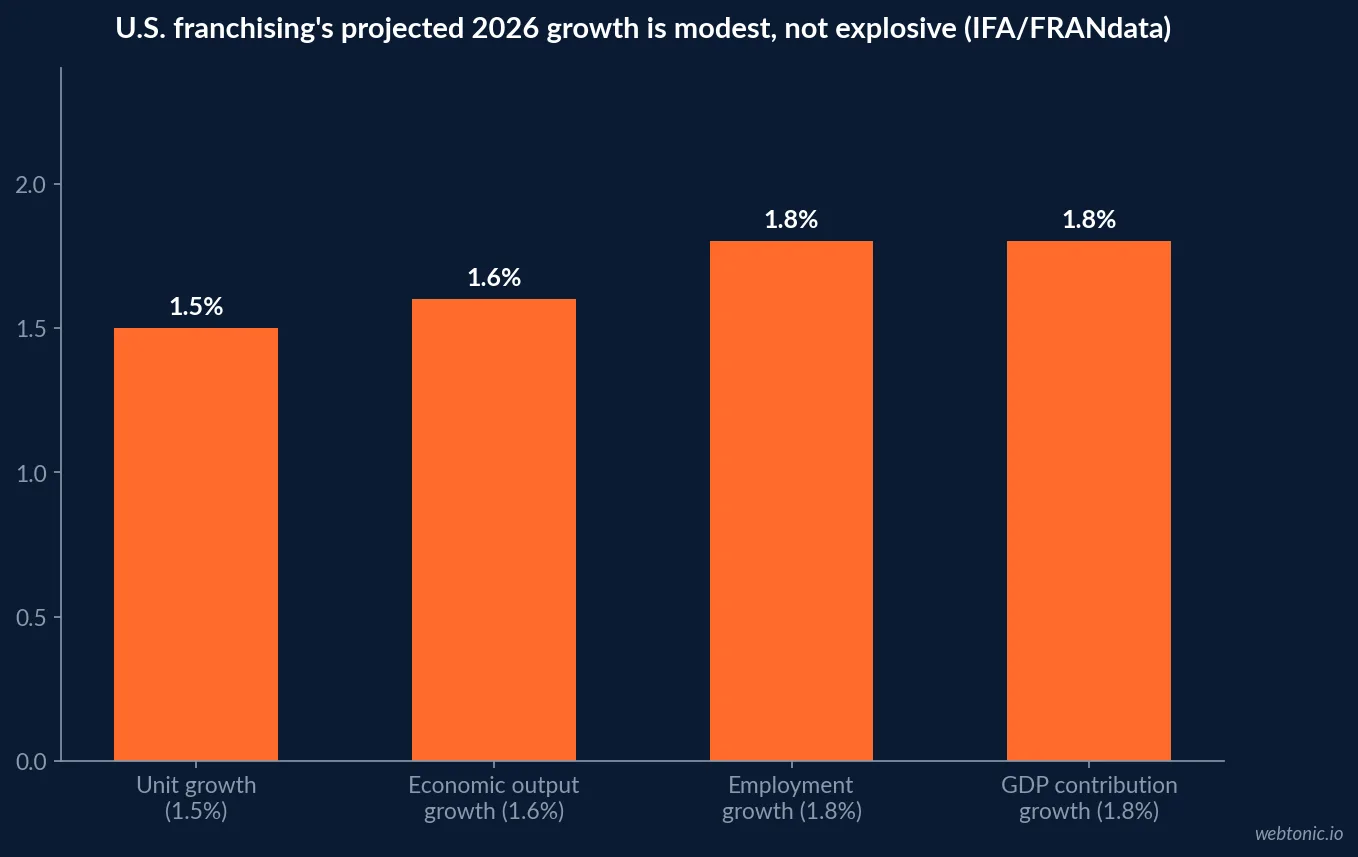
- U.S. franchise units are projected to reach about 845,000 in 2026, up 1.5%.
- Franchise economic output is projected at USD 921.4 billion, up 1.6%.
- Franchise employment is projected to reach nearly 8.9 million jobs, up 1.8%.
- Median annual franchised-outlet closure rate runs 3.6% across analyzed FDDs.
- Roughly a third of tracked brands closed more units than they opened in a fiscal year.
- 70% of franchise systems disclose zero or one lawsuit in FDD Item 3.
- 88% of systems disclose five lawsuits or fewer.
- Median ongoing royalty runs 6.0% of gross revenue across analyzed FDDs.
- Median advertising fund contribution adds another 2.0% of revenue.
- Combined royalty plus ad fund burden reaches 8.0% of top-line revenue at the median.
- Fitness and home services categories often run 7% to 8% royalties.
- Estimates of SBA franchise loan charge-off rates range from about 8% to 16% by sample.
- Per-brand SBA default rates span from near 0% to above 20%.
- 281 of 454 analyzed FDDs disclose Item 19 earnings data, the rest do not.
- Only 63% to 69% of surveyed franchisors report strong or very strong 2026 growth.
Why the headline growth number tells you almost nothing
The International Franchise Association's 2026 Franchising Economic Outlook, built with FRANdata, projects franchise establishments growing from 832,521 to about 845,000 units in 2026, a 1.5% increase, with economic output up 1.6% to roughly USD 921.4 billion and employment climbing 1.8% to nearly 8.9 million jobs.
That figure is an aggregate across every registered franchise system in the country, spanning quick-service restaurants to home services to fitness. It is a useful macro read on the sector's health. It says literally nothing about whether the specific brand and territory in front of you is one of the systems adding units or one of the systems quietly shrinking underneath the average.
| 2026 industry metric | Projected figure | Change vs. 2025 | Source |
|---|---|---|---|
| Franchise establishments | About 845,000 units | +1.5% (832,521 to 845,000) | IFA / FRANdata |
| Franchise economic output | USD 921.4 billion | +1.6% (from USD 907.3B) | IFA / FRANdata |
| Franchise employment | Nearly 8.9 million jobs | +1.8% (150,000+ net new) | IFA / FRANdata |
| Contribution to GDP | USD 558.4 billion | +1.8% (from USD 549.9B) | IFA / FRANdata |
| Franchisors reporting strong 2026 growth | 63%-69% | Varies by brand size | Franchise Business Review |
The closure rate hiding inside the growth number
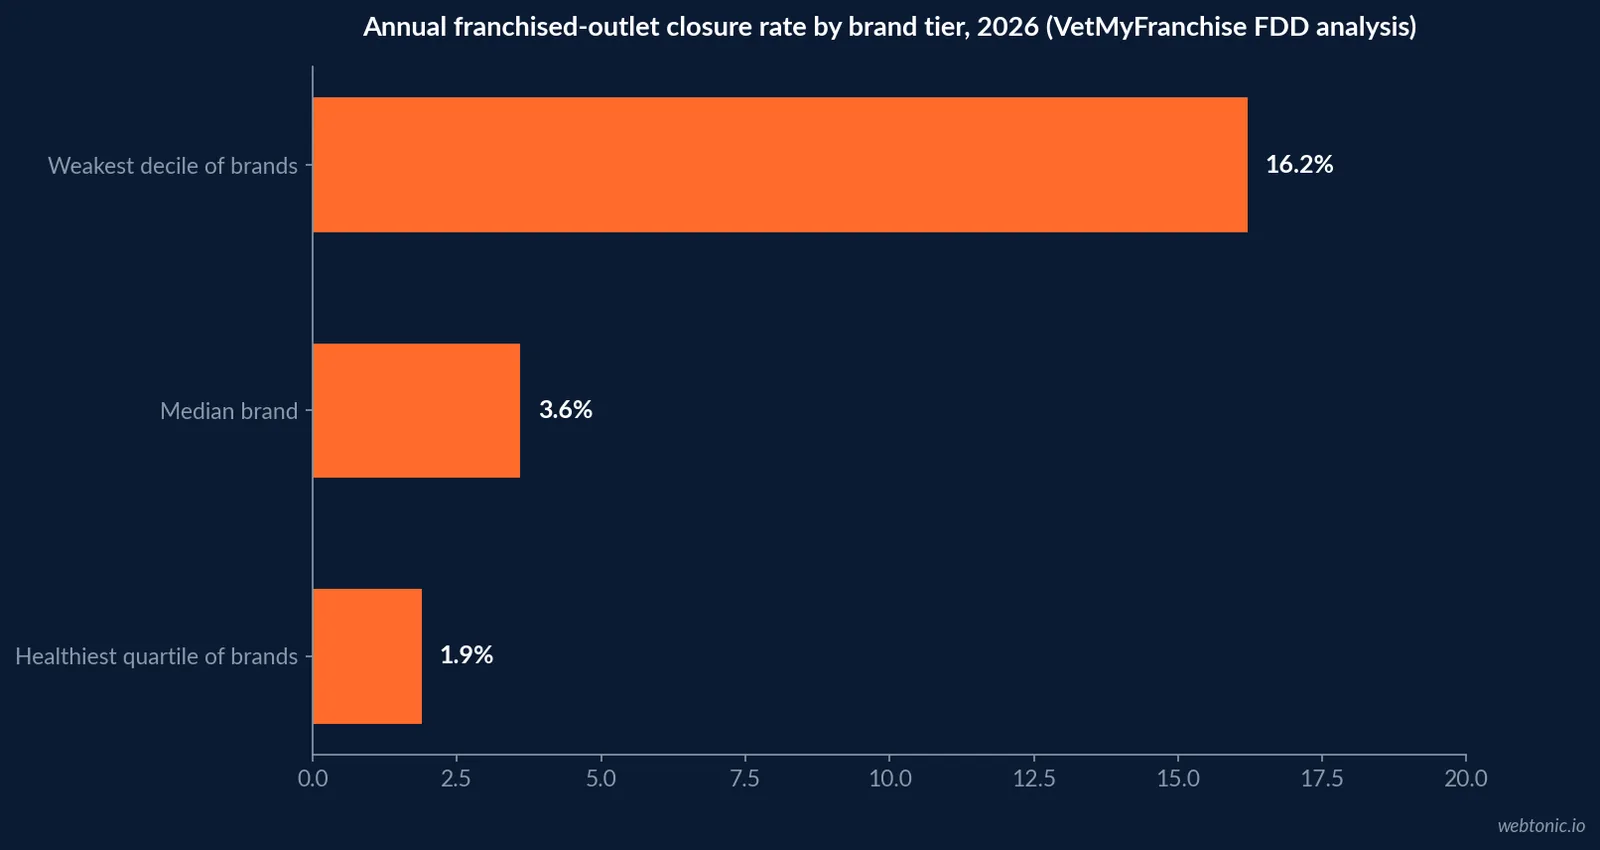
Growth statistics measure net change; they do not measure churn. An analysis of franchise disclosure documents by VetMyFranchise found a median annual franchised-outlet closure rate of 3.6% across brands whose churn tables parse cleanly, with the healthiest quarter of brands closing under 1.9% of units and the worst tenth closing over 16.2%. Roughly 34% of analyzed brands closed more units than they opened in the period studied.
That means industry-wide net growth of 1.5% is entirely compatible with a specific brand shrinking by double digits. The Franchise Disclosure Document's Item 20 tables, which list outlets opened, closed, transferred and terminated by state for the last three fiscal years, are the only reliable way to check which side of that split your target brand sits on.
| Closure benchmark (analyzed FDDs) | Figure | What it tells a buyer |
|---|---|---|
| Median annual closure rate | 3.6% | The typical brand's churn floor |
| Healthiest quartile | Under 1.9% | What a well-run system looks like |
| Weakest decile | Over 16.2% | A brand actively shedding units |
| Brands that closed more than they opened | ~34% | Net negative growth despite industry averages |
| Brands with measurable net growth | 594 of 2,394 (~25%) | Minority actually expanding |
What franchise litigation disclosures actually show
Franchise sales pitches rarely mention Item 3 of the FDD, the litigation history section, but it is one of the few places a franchisor is legally required to disclose lawsuits involving the franchise system. Research summarized through the ABA Forum on Franchising and cited by Lopes Law found that 70% of franchise systems disclose zero or one lawsuit in Item 3, and 88% disclose five or fewer.
A handful of disclosed cases in a large system is not automatically disqualifying - raw case counts mislead because a brand with thousands of units will naturally accumulate more disputes than one with a few hundred. What should raise a flag is a pattern: several franchisee-initiated class actions alleging the same practice, such as misleading earnings claims, is a systemic signal that a single lawsuit is not.
The fee burden that eats into unit economics before overhead
An analysis of more than 2,300 active FDDs by VetMyFranchise's Royalty Burden Index puts the median ongoing royalty at 6.0% of gross revenue, with a further median 2.0% advertising fund contribution, for a combined 8.0% of top-line revenue owed to the franchisor before a single fixed cost is covered. Most brands cluster between 5% and 8% on royalty alone, though fitness and home services categories frequently run 7% to 8%, and some B2B professional service franchises reach 8% to 12%.
That fee is owed on revenue, not profit, in every month regardless of your margin that period. A territory that looks attractive on a franchisor's Item 19 average unit revenue figure can still be a poor buy once the full royalty-plus-ad-fund burden is modeled against your realistic local margin.
| Fee benchmark (2,300+ FDDs analyzed) | Median figure | Typical range |
|---|---|---|
| Ongoing royalty | 6.0% of gross revenue | 5%-8% for most brands |
| Advertising fund contribution | 2.0% of gross revenue | 1%-4% depending on brand |
| Combined royalty + ad fund | 8.0% of gross revenue | 6%-15% across categories |
| Fitness franchises royalty | 7.0% | 5%-7% |
| Home services royalty | 6.0%-7.0% | 5%-10% |
What Item 19 earnings disclosure does and does not tell you
Not every franchisor discloses earnings performance. An analysis of 454 franchise brands' FDDs found that 281 of 454 (about 62%) disclose some form of Item 19 earnings information, meaning roughly 4 in 10 brands give a prospective buyer no historical revenue benchmark at all beyond what a broker tells you verbally. Where Item 19 is disclosed, it typically reports average unit revenue, not average unit profit, so a strong average revenue figure can still sit on top of a weak margin once the royalty, ad fund and local operating costs are applied.
The FTC's Franchise Rule requires the FDD itself, the 14-day review period and Item 19 format when a franchisor chooses to disclose earnings, but it does not require every franchisor to disclose earnings in the first place. Read our take on turning any due-diligence document into a repeatable review process in our growth marketing practice notes on vetting a channel before committing budget to it.
| FDD section to pull | What to compare it against | 2026 benchmark | Red flag |
|---|---|---|---|
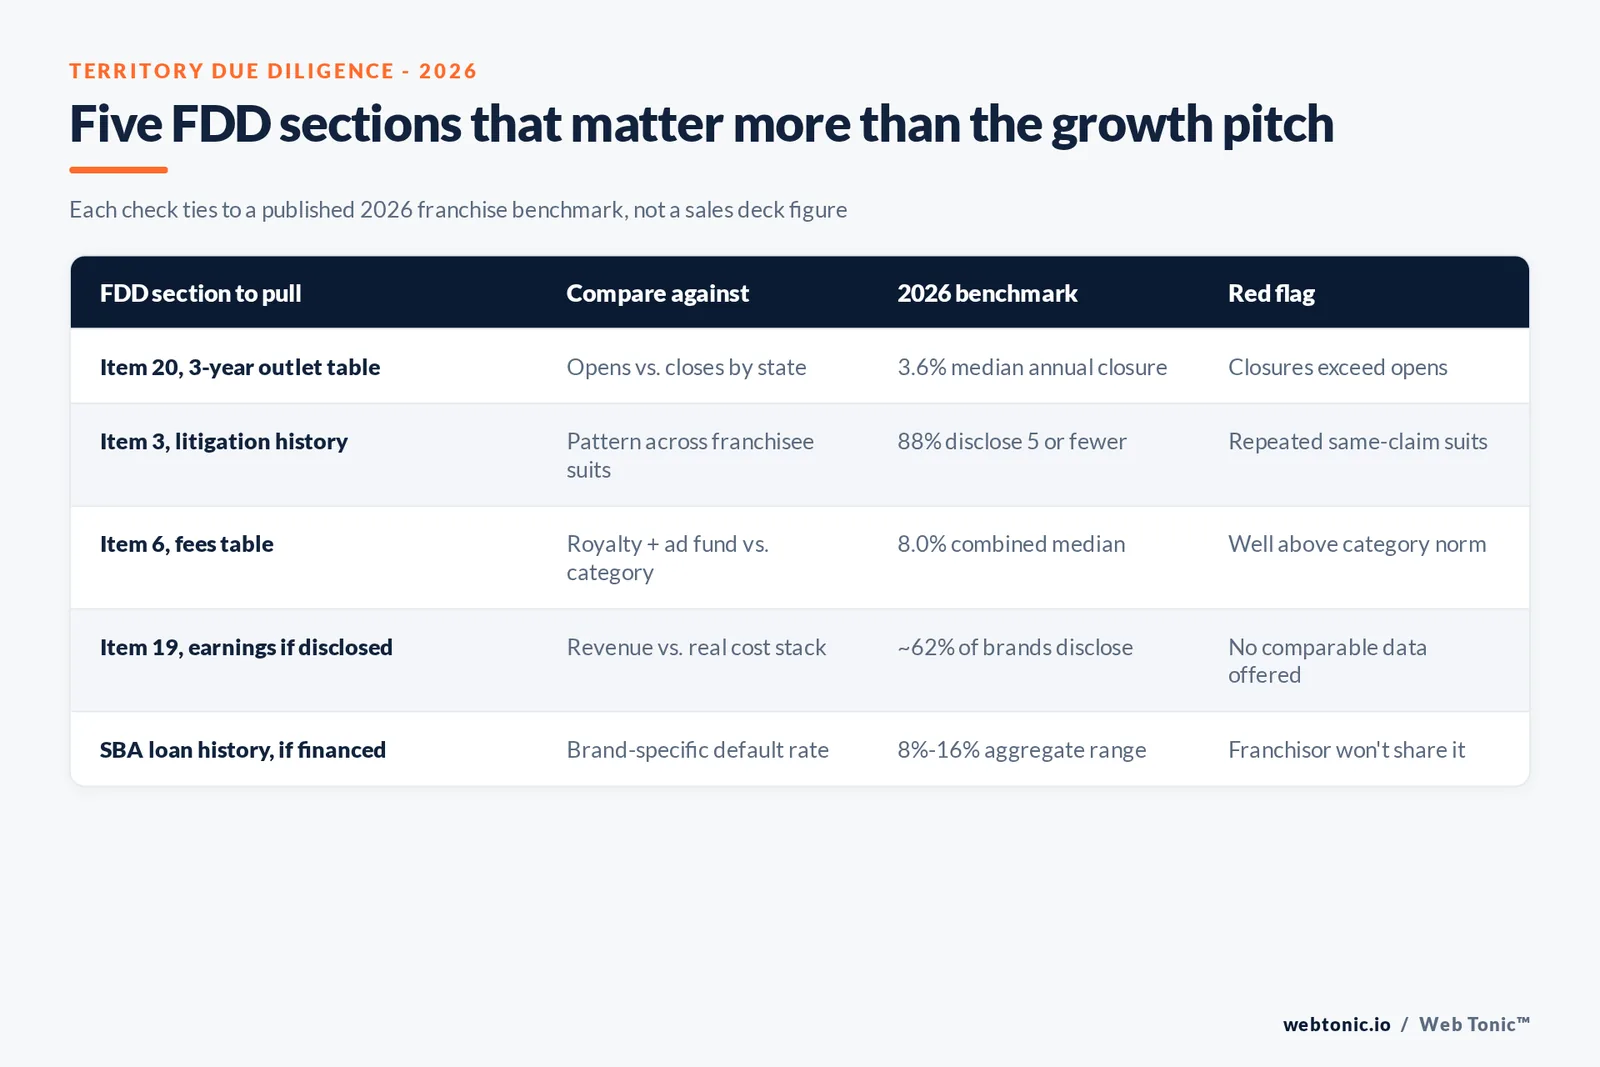
| Item 20 outlet tables, 3 years | Opens vs. closes by state | 3.6% median annual closure | Closures exceeding opens |
| Item 3, litigation history | Pattern across franchisee suits | 88% disclose 5 or fewer | Repeated same-claim suits |
| Item 6, fees table | Royalty + ad fund vs. category norm | 8.0% combined median | Well above category norm, no added support |
| Item 19, earnings if disclosed | Revenue vs. real cost stack | 62% of brands disclose | No Item 19, no comparable data offered |
| SBA loan history, if financed | Brand-specific default rate | 8%-16% aggregate range | Franchisor won't share brand default rate |
Financing risk varies by brand far more than by industry
Multiple independent analyses of SBA 7(a) loan data reach different aggregate figures depending on the loan vintage and sample analyzed - estimates for franchise loan charge-off rates range roughly from 8% to 16% across studies. What matters more than the aggregate is the brand-level spread: per-brand default rates on SBA-backed franchise loans have been documented ranging from close to 0% at the strongest systems to above 20% at the weakest, among brands with meaningful loan volume.
Any franchisor asking you to finance the purchase through an SBA loan should be able to share their brand's own historical default rate on file with the lender community. If they cannot or will not, treat that refusal as data in itself.
Why royalty rates differ so much by category
The 6.0% median royalty figure hides real category spread. An analysis of royalty rates across more than 180 brands by FranchiseStack puts the blended 2026 average at 6.44%, with retail and services categories running as high as 8.50% on average and real estate categories as low as 4.56%. A handful of well-known outliers sit far outside the norm - the analysis flags brands charging anywhere from single-digit percentages up to structures in the low double digits depending on how the fee is calculated.
The category median is the right comparison point, not the industry-wide 6.0% figure, because a home-services buyer comparing their royalty against a real-estate benchmark will draw the wrong conclusion about whether their fee is competitive.
| Category | Typical royalty range | Source |
|---|---|---|
| Retail & services | Up to 8.50% average | FranchiseStack 2026 |
| Fitness | 5%-7% | VetMyFranchise / FranchiseIQ |
| Home services | 5%-10% | VetMyFranchise / FranchiseIQ |
| QSR / food | 4%-6% | FranchiseIQ |
| Real estate / brokerage | 4.56%-7% | FranchiseStack / FranchiseIQ |
Where SBA financing data actually lives if you want to check it yourself
A prospective buyer does not have to take a franchisor's word on financing risk. The SBA's own Franchise Directory is the register lenders and Certified Development Companies use to confirm whether a specific franchise brand and agreement structure is eligible for 7(a) and 504 financing at all - a brand missing from that directory, or listed with agreement-specific caveats, is a concrete due-diligence flag independent of any third-party default-rate estimate.
Cross-checking a target brand against the SBA's own directory before relying on a franchisor's verbal claims about financing eligibility costs nothing and catches a category of problem the growth projections in a sales deck will never surface.
How to read a sales deck against these numbers
A franchise sales presentation will lead with the industry growth story because it is the most flattering aggregate figure available. Ask instead for the specific system's Item 20 closure history, the Item 3 litigation pattern, and the Item 19 earnings data if it exists, then run those against the benchmarks above. Franchise growth is real in 2026, but it is an industry average - the only number that determines whether your specific territory is a good buy is the one in your own FDD.
If you are marketing a franchise system yourself and want the growth pitch backed by defensible, channel-level data rather than industry averages, talk to us about how our growth marketing practice builds franchisee-acquisition funnels on real unit economics, or see how our data and analytics practice models territory-level performance before a launch.
Quick reference: the numbers worth writing down before a call with a broker
A broker or franchisor's sales team will quote the industry growth figures first because they are the most flattering aggregate available. Entrepreneur's Franchise 500 ranking, an independently compiled annual list, is a reasonable starting cross-check on how a specific brand's momentum and system size compare against its category before you go further into the brand's own FDD.
| Question to ask before signing | Where the answer lives | Industry-average figure to compare against |
|---|---|---|
| Is the brand net-growing or net-shrinking? | FDD Item 20, 3-year outlet table | 3.6% median annual closure rate |
| How many lawsuits, and what pattern? | FDD Item 3 | 88% of systems disclose 5 or fewer |
| What is the real all-in fee burden? | FDD Item 6 | 8.0% combined royalty + ad fund median |
| Does the brand disclose earnings at all? | FDD Item 19 | ~62% of brands disclose some earnings data |
| Is the brand SBA-financeable and how has it defaulted? | SBA Franchise Directory + lender history | 8%-16% aggregate charge-off range |
Frequently Asked Questions
Is the franchise industry actually growing in 2026?
Yes, but modestly. The International Franchise Association's 2026 Franchising Economic Outlook, produced with FRANdata, projects franchise establishments growing from 832,521 to about 845,000 units, a 1.5% increase, with economic output up 1.6% to roughly USD 921.4 billion. That is steady, not explosive, growth, and it is an industry-wide average that says nothing about the specific brand or territory you are evaluating.
What closure rate should a territory buyer actually worry about?
Not the headline unit-growth number. VetMyFranchise's analysis of franchise disclosure documents found a median annual franchised-outlet closure rate of 3.6% and reported that roughly a third of tracked brands closed more units than they opened in a given fiscal year. A brand can post positive net growth nationally while your specific territory or region is a net loser, so ask for closure counts by state, not just the system total.
Do most franchise systems face lawsuits?
Some, but not most, and severity varies enormously. Research summarized through the ABA Forum on Franchising found that 70% of franchise systems disclose zero or one lawsuit in Item 3 of their FDD, and 88% disclose five or fewer. A handful of lawsuits in a large system is not automatically a red flag; what matters is whether the disclosed cases involve franchisee groups alleging the same practice you are about to sign up for.
How much does the ongoing royalty actually cost?
VetMyFranchise's analysis of more than 2,300 active FDDs puts the median ongoing royalty at 6.0% of gross revenue, plus a median 2.0% advertising fund contribution, for a combined 8.0% of top-line revenue paid out before you cover a single fixed cost. Royalty burden varies by category: fitness and home services franchises often sit at 7% to 8%, while some real estate brands sit closer to 4.5% to 5%.
What is the real default risk on franchise financing?
It depends heavily on the brand, not the industry. Multiple independent analyses of SBA 7(a) loan data put aggregate franchise loan charge-off rates anywhere from roughly 8% to 16% depending on the loan vintage and sample analyzed, with per-brand default rates ranging from close to 0% at the strongest systems to above 20% at the weakest. Ask any franchisor directly for their brand's SBA default rate; a franchisor that will not share it is telling you something.
Sources
International Franchise Association - 2026 Franchising Economic Outlook
FRANdata - U.S. franchising's 2026 economic outlook
VetMyFranchise - Franchise failure rates from 858 FDDs
VetMyFranchise - Royalty Burden Index
VetMyFranchise - SBA franchise loan default rates by brand
Lopes Law - Franchise law statistics 2026 (FDD litigation)
Federal Trade Commission - Franchise Rule Compliance Guide
VetMyFranchise - Franchise industry statistics, Item 19 data
FranchiseStack - Franchise royalty rates by category 2026
U.S. Small Business Administration - SBA Franchise Directory
Entrepreneur - Franchise 500 ranking


