



Table of contents
Public franchise native advertising statistics are not worth tracking because they do not exist; your own native data is, if you can separate it by brand, franchise development and local unit. The 2025 Annual Franchise Marketing Research study does not break out native, and no network publishes franchise results, so this page shows the figures franchisors can actually track.
Key Takeaways
- Digital ads took 42% of franchise marketing budgets in the 2025 AFMR study; social media 22%.
- 36% of budgets went to search PPC and 29% to social ads; native is not listed.
- 85% of brands recommend or require local marketing spend, but 48% leave tracking to franchisees.
- 90% of brands monitor online reviews, up from 75% a year earlier.
- IFA expects franchise units to grow from 832,521 to 845,000 in 2026 (+1.5%).
- Locations appear in the Google 3-Pack 35.9% of the time; ChatGPT recommends 1.2% (SOCi 2026).
- FTC rules require a disclosure document at least 14 calendar-days before signing or payment.
- No public franchise native CTR, CPL or conversion rate exists.
What a franchisor can and cannot track
The first test of whether a statistic is worth tracking is whether it exists and whether you control it. The table sorts franchise native metrics on both counts.
| Metric | Public franchise benchmark? | Who can measure it | Worth tracking? |
|---|---|---|---|
| Native CTR | No | Network dashboard, per account | Yes, as a creative signal only |
| Native cost per lead | No | Franchisor CRM | Yes, split by campaign type |
| Native share of budget | No (not in AFMR) | Franchisor finance | Yes, against the 42% digital share |
| Local listing visibility | Yes, SOCi 2026 | Brand or listings vendor | Yes, the post-click base |
| Franchise unit growth | Yes, IFA 2026 | Public | Context only |
Where native would sit in the franchise budget
The AFMR results, reported by Franchising.com in October 2025, show digital ads accounting for 42% of total marketing budgets, social media 22%, websites 12%, print 8%, PR 8%, broadcast TV and radio 7%, streaming TV and radio 7%, events 7% and direct mail 3%. Within digital, search PPC took 36% and social media advertising 29%. Native is not named in any line, so any native spend is folded into "digital ads" and cannot be separated from the published figures.
That is the core tracking problem. A franchisor who wants to know whether native earns its place has to tag it separately from the start, because no external benchmark will split it out later.
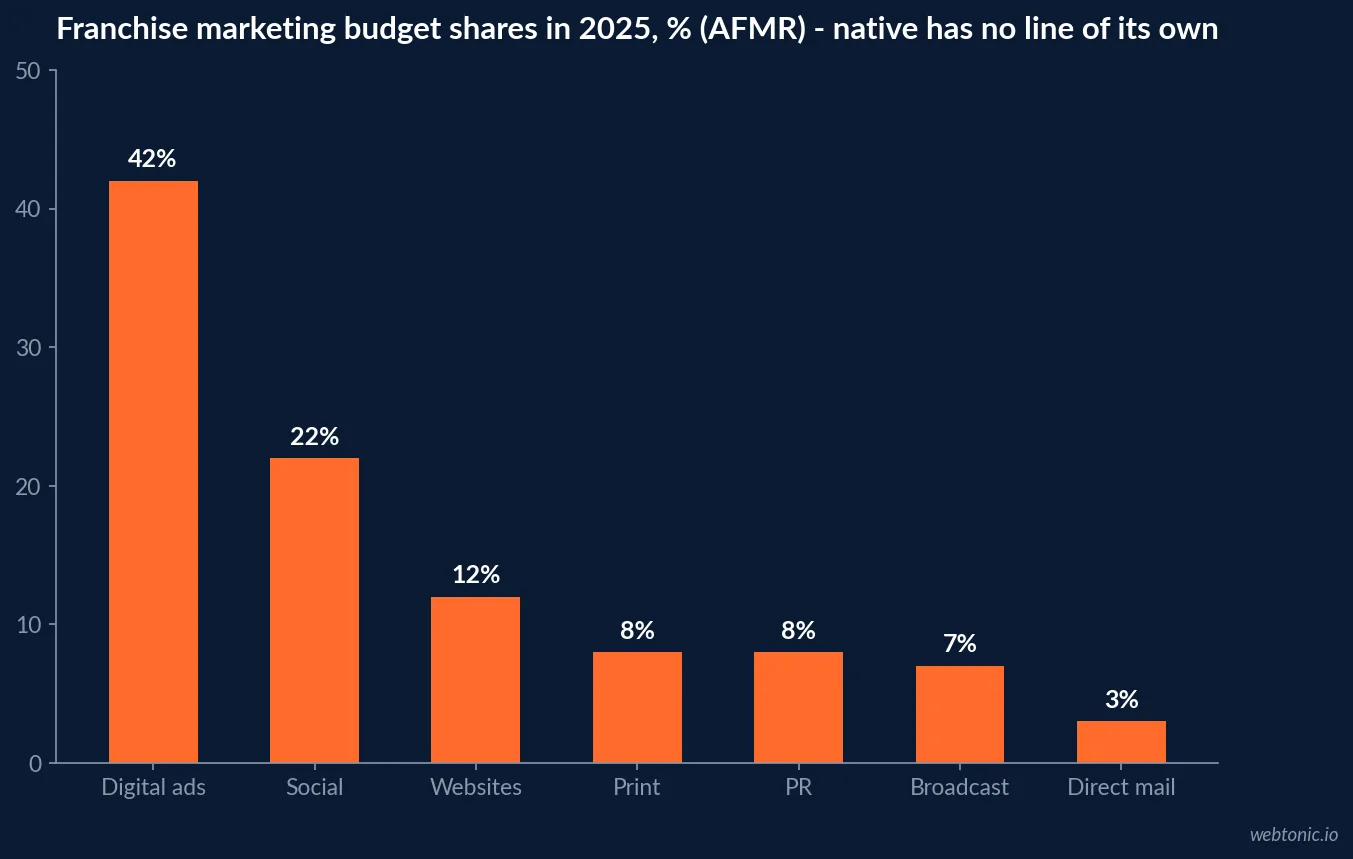
| Budget line, 2025 AFMR | Share of total budget | Native included? |
|---|---|---|
| Digital ads | 42% | Possibly, not broken out |
| Social media | 22% | No |
| Websites | 12% | No |
| 8% | No | |
| PR | 8% | Sponsored content may sit here |
| Streaming TV and radio | 7% | No |
| Direct mail | 3% | No |
The local tracking gap
The same study found 85% of respondents recommend or require franchisees to invest in local marketing, yet 48% leave it to franchisees to track and manage that effort independently. About 21% of brands saw a dip in leads and traffic compared with the previous year. For native, the gap is practical: if a franchisee buys a local native campaign with its own account, the franchisor sees neither the spend nor the leads. Native data is only worth tracking when the system has a single place to collect it.
Reputation tracking shows what is possible when brands commit: 90% of brands now monitor online reviews, up from 75% the year before, 68% use review monitoring platforms and 59% social media monitoring tools. No comparable share is reported for native measurement.
Franchise market growth in 2026
The IFA's 2026 Franchising Economic Outlook projects establishments growing from 832,521 to 845,000 units, an increase of 1.5%, output rising from USD 907.3 billion to USD 921.4 billion (+1.6%), employment up more than 150,000 jobs to nearly 8.9 million, and franchise GDP rising 1.8% to USD 558.4 billion. IFA names child services and commercial and residential services as the fastest-growing industries, and Texas, Florida, Georgia, Arizona and North Carolina lead its top 10 states. Growth of about 12,500 net new units is the size of the franchise development market native recruitment ads compete for.
| IFA 2026 outlook figure | 2025 | 2026 forecast | Change |
|---|---|---|---|
| Franchise establishments | 832,521 | 845,000 | +1.5% |
| Franchise output | USD 907.3B | USD 921.4B | +1.6% |
| Franchise GDP | USD 549.9B | USD 558.4B | +1.8% |
| Franchise employment | Not stated | Nearly 8.9M | +1.8% |
Earnings claims in recruitment advertorials
Franchise development is where native advertorials are most common and where the law is most specific. The FTC Franchise Rule at 16 CFR part 436 defines a financial performance representation as any representation, "including a representation in the general media", that states a specific level or range of actual or potential sales, income or profits. Section 436.9(c) makes it unfair or deceptive to disseminate one unless the franchisor has a reasonable basis and written substantiation and the figure is in Item 19 of the disclosure document, and the seller must add a clear and conspicuous admonition that a new franchisee's results may differ. Section 436.2 requires the disclosure document at least 14 calendar-days before a prospect signs or pays.
A sponsored article headlined with an average unit volume is therefore an Item 19 claim. The FTC's Franchise Rule compliance guide is the plain-language reference for building those units.
Franchisee testimonials and the Endorsement Guides
Native recruitment ads often quote a franchisee. Under the Endorsement Guides, 16 CFR part 255 (revised 2023), an endorsement about a consumer's experience on a key attribute "will likely be interpreted as representing that the endorser's experience is representative" of what others will achieve, so the advertiser needs substantiation that it is. A franchisee saying they paid off their loan in a year is a representativeness claim as well as a possible financial performance representation.
| Rule | Citation | What it means for native units |
|---|---|---|
| Financial performance representation | 16 CFR 436.1(e) | Covers general media, so advertorials count |
| Item 19 requirement | 16 CFR 436.9(c) | Earnings figures must be in Item 19, with admonition |
| Disclosure timing | 16 CFR 436.2 | Document 14 calendar-days before signing or payment |
| Typical results | 16 CFR 255.2 | Testimonials imply representative results |
| Ad identification | FTC 2015 policy statement | Label advertorials before the click |
Labelling sponsored franchise content
The FTC native advertising guide states that a native ad is deceptive if it is not readily identifiable as advertising and that disclosures must be clear and prominent. The underlying Enforcement Policy Statement on Deceptively Formatted Advertisements dates from December 2015. A "top franchises to buy" article paid for by one of the listed brands needs a visible Sponsored or Ad label; without it, both the native rule and the Franchise Rule are in play.
Local visibility: the metric that decides post-click value
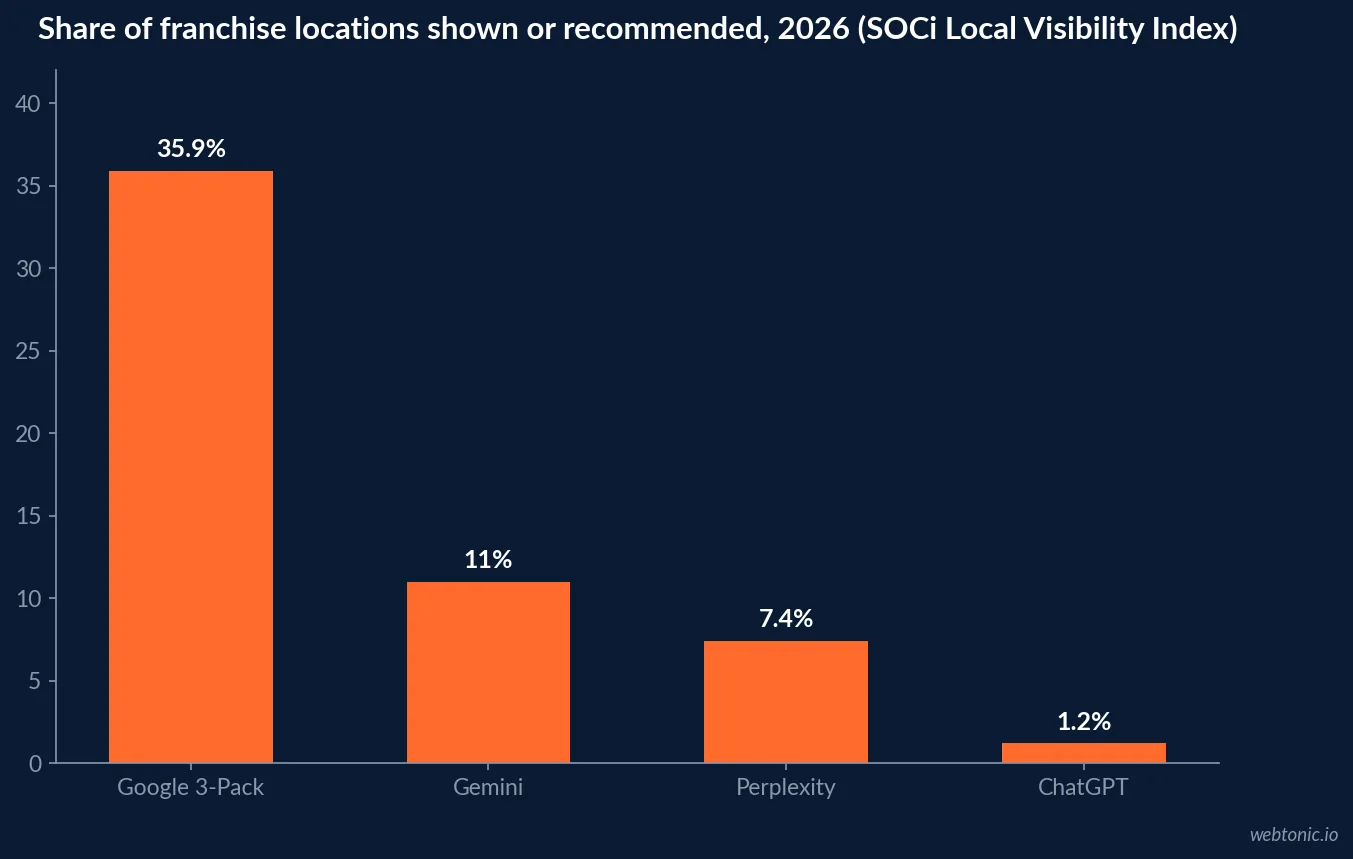
For consumer-side franchise native, the click usually ends at a location page or a map listing. SOCi's 2026 Local Visibility Index (vendor data, 2,751 multi-location brands, about 350,000 US locations) found 97.9% of locations claimed on Google, 86.6% profile completeness, a 35.9% appearance rate in the Google 3-Pack for the category and only 2.7% of local pages on page one. Only 53.4% of locations found on Google had a Facebook presence. In AI search, SOCi reports ChatGPT recommends 1.2% of locations, Gemini 11.0% and Perplexity 7.4%.
Those figures are worth tracking because they are measured per location. Native data without them tells a franchisor how many people clicked, not whether the local unit was findable afterwards.
| SOCi 2026 benchmark | Value | Why it matters for native |
|---|---|---|
| Locations claimed on Google | 97.9% | Baseline for any local landing |
| Profile completeness | 86.6% | Incomplete profiles waste clicks |
| Google 3-Pack appearance | 35.9% | Post-click competition |
| Local pages on page one | 2.7% | Location pages rarely rank |
| Locations on Facebook vs Google | 53.4% | Social retargeting base |
Comparators to judge native cost per lead
With no franchise native benchmark, a cost per lead needs an outside reference. WordStream's 2026 search benchmarks (over 13,000 campaigns, April 2025 to March 2026) put the all-industry average cost per lead at USD 66.69, the first decline in five years, and business services, the closest category to franchise development, at USD 93.69. These are paid-search comparators, not franchise or native figures. OpenAdLibrary, a native-ad intelligence vendor, states there is no trustworthy universal native conversion rate and recommends computing a breakeven rate: cost per click divided by allowable cost per acquisition. At a USD 0.60 click and a USD 93.69 allowable lead cost, breakeven is about 0.64%; that is arithmetic, not an observed result.
Three franchise native programmes, three sets of numbers
Franchise systems usually run native for three different jobs, and mixing their results is the most common reason native data looks worthless. A national brand campaign is judged on reach and branded search lift, a franchise development campaign on qualified candidate inquiries that reach disclosure, and a local campaign on calls and bookings at a specific unit. A franchise development lead that takes months to reach the 14-day disclosure window cannot be compared with a local booking made the same afternoon. Tracking is only worth the effort when each programme has its own key metric, its own landing page and its own holdout, and when the franchisor, not each franchisee, owns the reporting. With 48% of brands leaving local tracking to franchisees, that last condition is the one most systems fail.
| Native programme | Primary metric to track | Public benchmark | Rule to check |
|---|---|---|---|
| National brand | Branded search and direct traffic lift | None for franchise | FTC ad identification |
| Franchise development | Inquiries reaching disclosure | None | 16 CFR 436.9(c) and 436.2 |
| Local unit | Calls and bookings per location | None; SOCi local visibility as context | Endorsement Guides 255.2 |
| All three | Cost per qualified lead vs holdout | Search comparators USD 66.69 to 93.69 | Item 19 for any earnings figure |
US digital advertising reached USD 294.6 billion in 2025, a 13.9% increase, according to the IAB/PwC Internet Advertising Revenue Report. Native is not reported as a separate line in that release, so even the market-level native trend is hard to track from public data. Franchise brands, which put 42% of budgets into digital, sit inside that growth without a native-specific benchmark.
A tracking plan that makes native data worth having
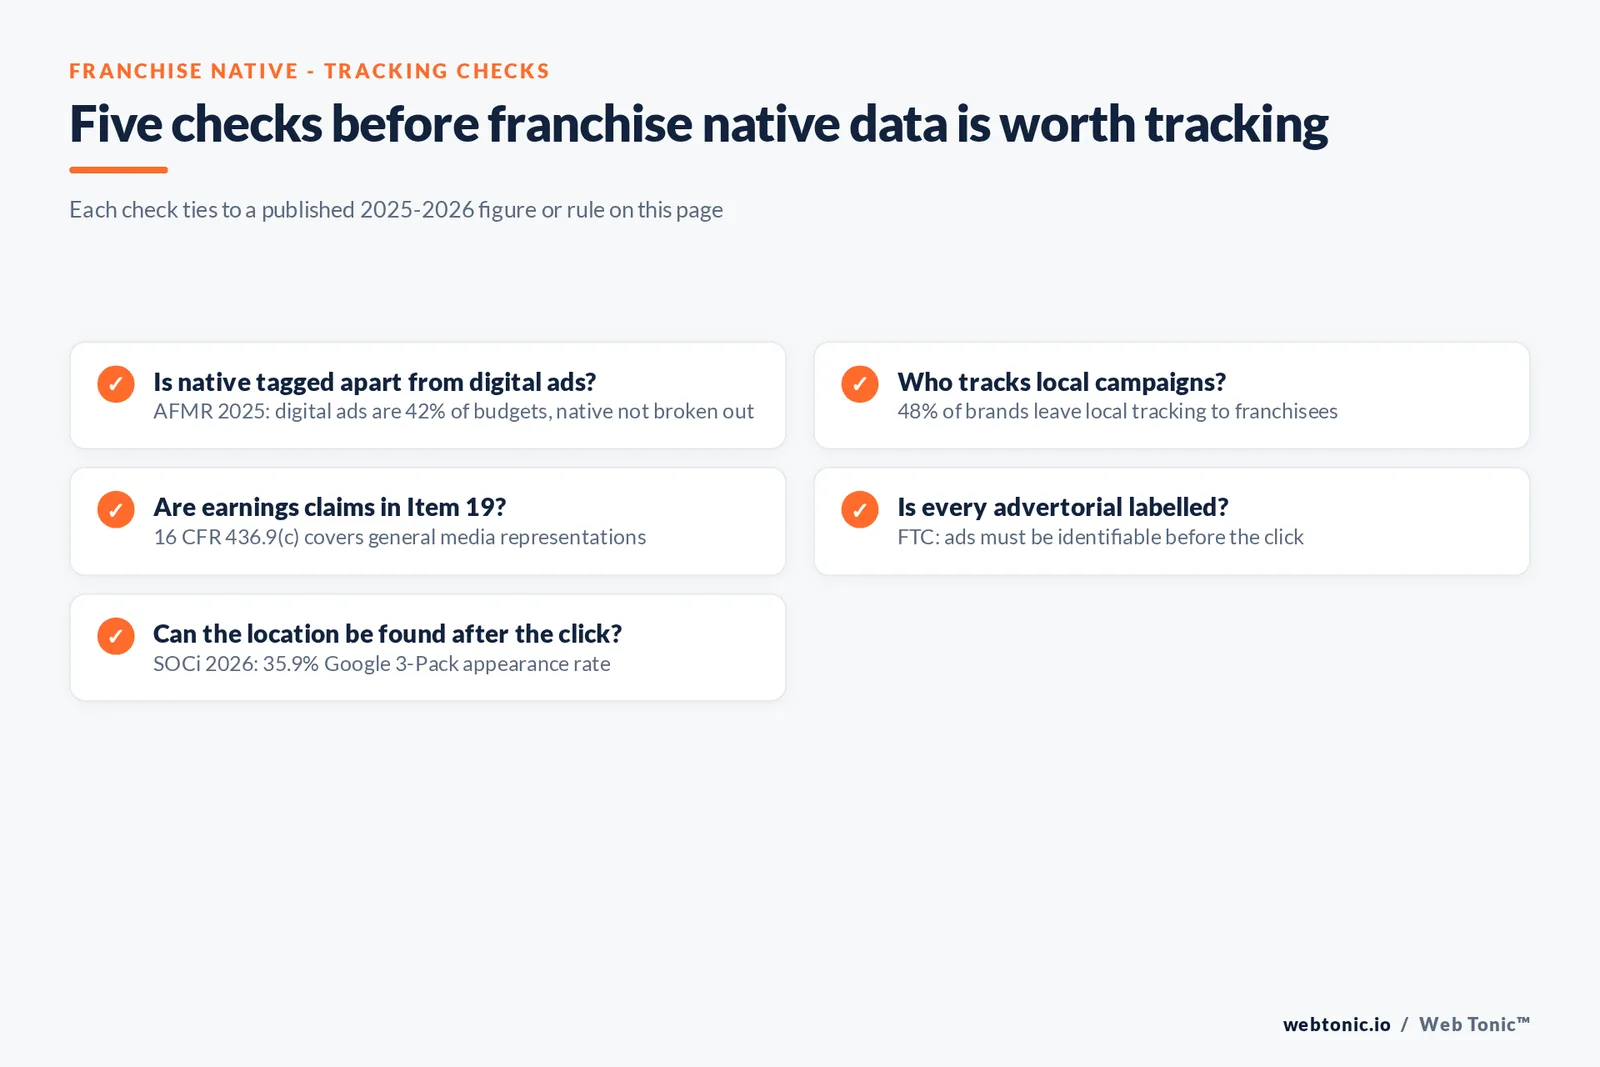
- Tag native separately from the 42% digital-ads line in your own budget.
- Split brand, franchise development and local campaigns; their leads are not comparable.
- Centralise local data, since 48% of brands leave tracking to franchisees.
- Keep earnings figures in Item 19 and add the admonition to every unit.
- Pair native reports with local visibility, the 35.9% 3-Pack base.
- Judge cost per lead against USD 66.69 to 93.69 search comparators, with a holdout.
For cross-industry data see our native advertising statistics. Franchise search data is in our franchise Google Ads statistics and organic data in our franchise enterprise SEO statistics. Our data intelligence team can build the tracking layer.
Frequently Asked Questions
Are franchise native advertising statistics worth tracking?
Your own are. Public franchise native benchmarks do not exist: no network or association publishes a franchise native CTR, cost per lead or conversion rate. What is worth tracking is your own native data split by brand campaign, franchise development campaign and local units, measured against a holdout.
How do franchise brands split their marketing budgets?
The 2025 Annual Franchise Marketing Research study reported digital ads at 42% of total marketing budgets, social media 22%, websites 12%, print 8%, PR 8%, broadcast TV and radio 7% and streaming TV and radio 7%. Within digital, 36% went to search PPC and 29% to social ads. Native is not reported as its own line.
Can a franchise recruitment advertorial mention franchisee earnings?
Only under the FTC Franchise Rule. 16 CFR 436.9(c) prohibits disseminating financial performance representations unless the franchisor has a reasonable basis and written substantiation and the figure is in Item 19 of the disclosure document, with a clear admonition that individual results may differ. The rule's definition explicitly covers representations in the general media.
What should franchisors track besides native clicks?
Local visibility. SOCi's 2026 Local Visibility Index of about 350,000 locations found locations appear in the Google 3-Pack for their category 35.9% of the time, while ChatGPT recommends 1.2% of locations. Native spend that sends people to weak local listings loses value after the click.
Sources
Franchising.com, 2025 AFMR findings
IFA, 2026 Franchising Economic Outlook
eCFR, 16 CFR part 436 Franchise Rule
FTC, Franchise Rule Compliance Guide
eCFR, 16 CFR part 255 Endorsement Guides
FTC, Native Advertising: A Guide for Businesses
FTC, Enforcement Policy Statement on Deceptively Formatted Advertisements
SOCi, Local listings benchmarks for franchises 2026
SOCi, 2026 Local Visibility Index release
WordStream, Google Ads Benchmarks 2026
OpenAdLibrary, Native Ads Conversion Rate Benchmarks (vendor, Aug 2026)
IAB/PwC, Internet Advertising Revenue Report 2025


