



Table of contents
Franchise Analytics & Tracking Statistics: Data-Driven Benchmarks for 2026
Data-driven franchise systems grow unit counts 2.3× faster than intuition-led peers (Autymate, 2026). Here are the benchmarks that matter.
Key Takeaways
- 87.2% of franchisors now disclose unit-level financial performance in their FDD — the largest year-over-year jump on record (FDDIQ, 2026).
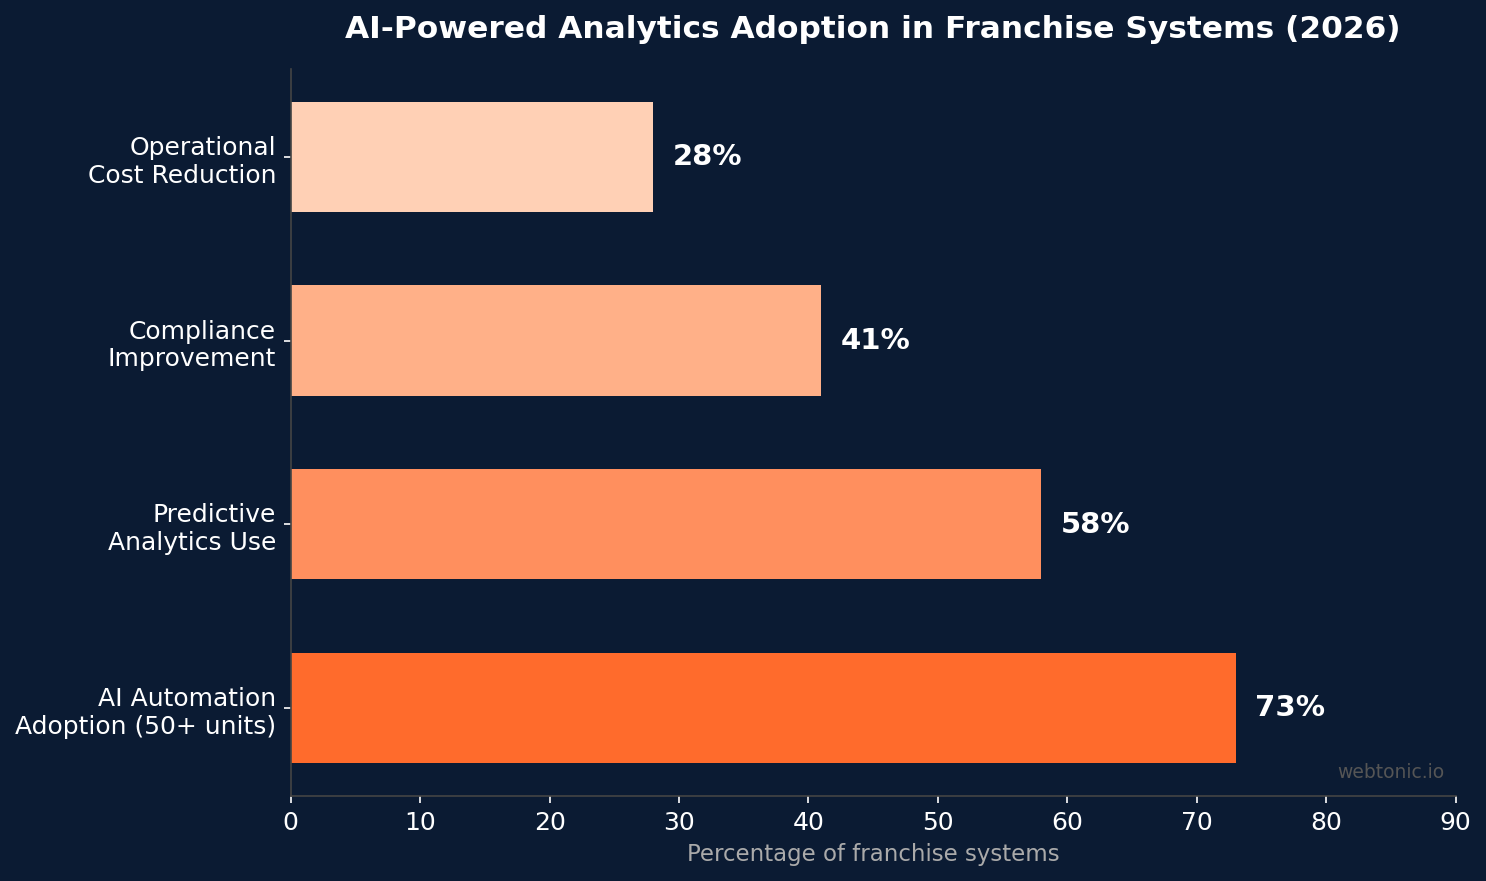
- 73% of franchise systems with 50+ locations use AI automation for performance tracking, compliance monitoring, or territory management (AI Business OS, 2026).
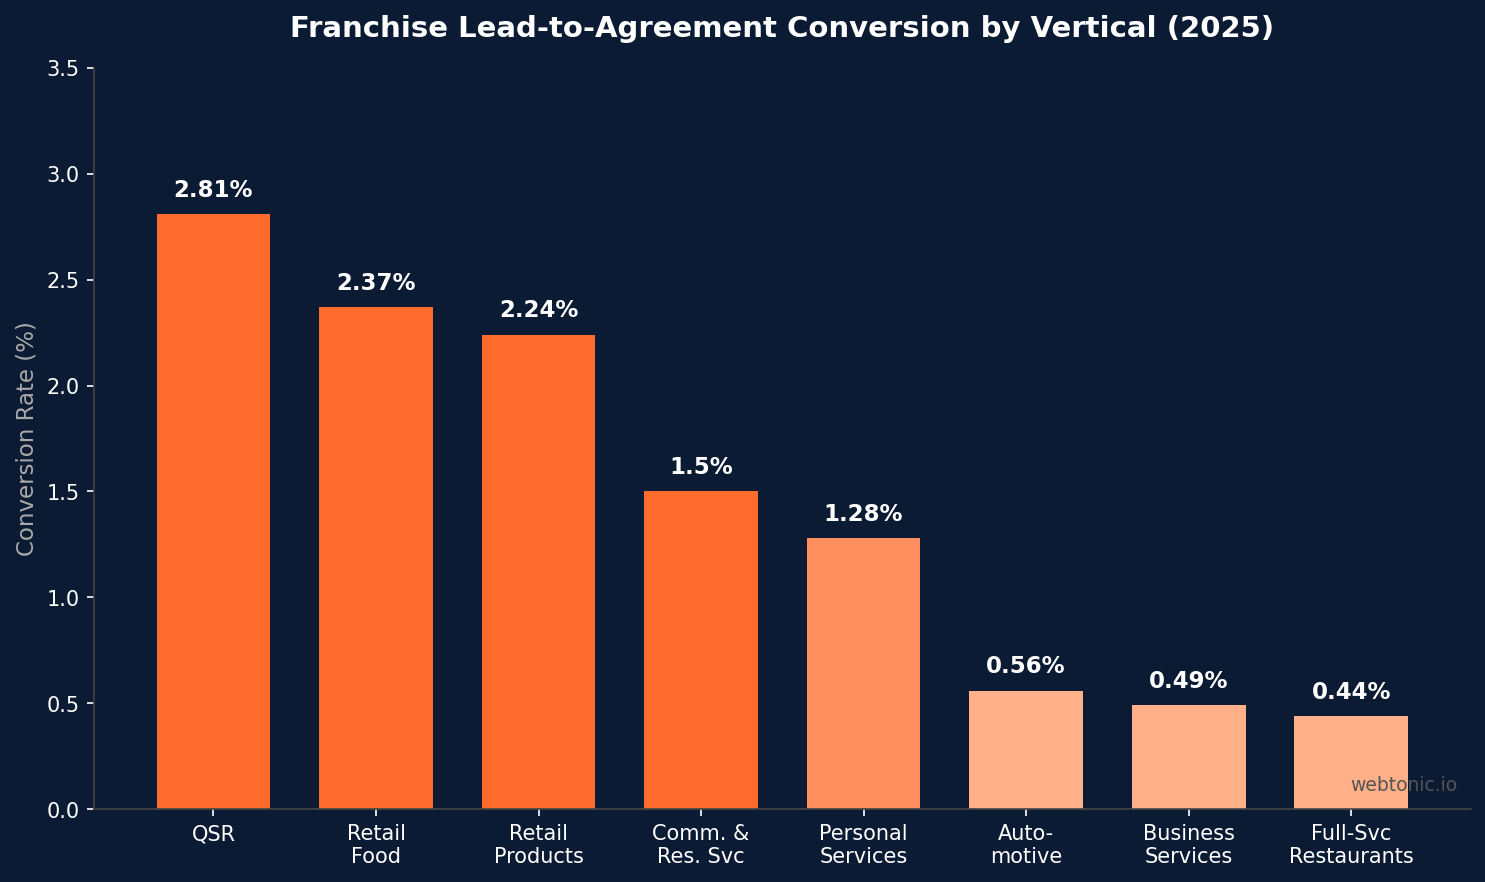
- Lead-to-agreement conversion nearly doubled from 0.76% in 2023 to 1.50% in 2025, driven by analytics — not more ad spend (FranConnect Sales Index, 2025).
- 58% of franchise systems have deployed predictive analytics for demand forecasting, territory optimization, and franchisee performance prediction (AI Business OS, 2026).
- Franchise output is forecast to surpass $920 billion in total economic output across nearly 845,000 U.S. establishments in 2026 (IFA/FRANdata).
- Brands using data-driven marketing attribution report 28% lower operational costs within 18 months of deployment (AI Business OS, 2026).
Franchise Analytics Adoption at a Glance
Table 1 — Franchise analytics adoption and transparency benchmarks (2025–2026)
| Metric | Value | Source |
|---|---|---|
| Franchisors disclosing Item 19 (unit-level financials) | 87.2% | FDDIQ 2026 |
| YoY jump in Item 19 disclosures | Largest on record | FDDIQ 2026 |
| Franchise systems (50+ units) using AI automation | 73% | AI Business OS |
| Systems deploying predictive analytics | 58% | AI Business OS |
| Avg operational cost reduction from AI analytics | 28% | AI Business OS |
| Compliance improvement rate after AI deployment | 41% | AI Business OS |
| Lead-to-agreement conversion rate (2025) | 1.50% | FranConnect |
| Lead-to-agreement conversion rate (2023) | 0.76% | FranConnect |
| FDD filings analyzed (2026 dataset) | 20,066 | FDDIQ 2026 |
| Total franchise brands tracked | 5,800 | FDDIQ 2026 |
Unit-Level Economics: The KPIs That Separate Winners from Laggards
The shift toward unit-level economics (ULE) transparency is the defining analytics trend of 2026. With 87.2% of franchisors now publishing Item 19 financial performance representations, prospective franchisees have more data than ever — and existing operators are expected to benchmark against it.
According to FDDIQ's State of Franchising 2026 report covering 5,800 brands and 20,066 FDD filings, brands in the $100K–$250K minimum investment tier grew net unit count by an average of 26.9% — the fastest-growing segment in the industry. The investment-to-earnings ratio benchmark is 3:1 or better (recouping investment within three years).
Autymate's analytics guide highlights the essential KPIs every data-driven franchisor tracks weekly:
- Labor Cost Percentage — even a 1% improvement across a 50-location network translates to significant annual savings.
- Cost of Goods Sold (COGS) % — the primary profitability lever at the unit level.
- Same-store sales growth — the clearest signal of operational health across the franchise network.
- Customer acquisition cost (CAC) — tracked per location and per marketing channel.
AI and Predictive Analytics Adoption in Franchise Operations
AI has moved from experimental pilots to core infrastructure for multi-location franchise brands. According to AI Business OS's 2026 franchise AI report, 73% of franchise systems operating 50+ locations now use some form of AI automation — up from an estimated 45% two years ago.
The most common AI applications in franchise analytics include:
- Franchisee performance tracking — automated scorecards comparing each unit against network averages.
- Compliance monitoring — AI-driven audits of operational standards, reducing manual inspection costs by up to 41%.
- Territory management — predictive models that identify under-penetrated markets and optimal expansion corridors.
- Demand forecasting — 58% of systems use predictive models integrating POS, weather, local events, and foot-traffic data.
Franchises deploying these analytics systems report 28% average operational cost reductions and 41% compliance improvement rates within the first 18 months, suggesting that the ROI case for AI-powered tracking is no longer theoretical.
Marketing Attribution and Lead Conversion Analytics
Franchise marketing analytics evolved dramatically between 2023 and 2025. FranConnect's 2025 Franchise Sales Index reveals that lead-to-agreement conversion nearly doubled — from 0.76% to 1.50% — while lead volume grew just 7%. The gains came entirely from better analytics and qualification, not higher spend.
Conversion rates vary dramatically by franchise vertical:
Table 2 — Lead-to-agreement conversion rates by franchise vertical (2025)
| Franchise Vertical | Conversion Rate | Relative Index |
|---|---|---|
| QSR (Quick-Service Restaurants) | 2.81% | 6.4x vs FSR |
| Retail Food | 2.37% | 5.4x vs FSR |
| Retail Products | 2.24% | 5.1x vs FSR |
| Commercial and Residential Services | 1.50% | 3.4x vs FSR |
| Personal Services | 1.28% | 2.9x vs FSR |
| Automotive | 0.56% | 1.3x vs FSR |
| Business Services | 0.49% | 1.1x vs FSR |
| Full-Service Restaurants | 0.44% | 1.0x (baseline) |
The most common reason leads die is non-response, not rejection — and that category fell 30% over three years as franchise systems deployed automated lead-nurture sequences and pipeline analytics dashboards.
Franchise Marketing Spend and Channel Attribution Data
72% of franchise systems now allocate at least 40% of their marketing budgets to local SEO, according to MarketingLTB's 2026 franchise marketing report. Industry practitioners recommend moving toward a 60/40 national-to-local ratio to improve overall efficiency.
Key marketing attribution benchmarks for franchise systems:
- Average PPC ROI: 3.5x — making paid search one of the most predictable franchise lead channels (MarketingLTB, 2026).
- Email marketing ROI: 595% — the highest-ROI digital channel for franchise brands (email marketing benchmarks).
- Local SEO ROI: 274% — growing as multi-location brands invest in local visibility.
- 87% of franchise systems use Google Ads as a primary lead source (MarketingLTB, 2026).
The data reinforces that franchises tracking channel-level attribution outperform those using blended metrics — particularly when distinguishing between franchise development leads (selling units) and consumer leads (driving foot traffic to existing locations). Strategic Google Ads management requires separate attribution models for each funnel.
Data Infrastructure and Platform Adoption
The franchise analytics technology stack is consolidating around purpose-built platforms. FranConnect, the largest franchise management platform, provides centralized analytics across operations, development, and marketing — serving as the single source of truth for multi-unit operators.
Key infrastructure trends for 2026:
- POS-integrated dashboards — real-time sales data flowing into unified analytics platforms replaces monthly spreadsheet reviews.
- Automated compliance scoring — replacing manual field inspections with data-driven audit triggers.
- Cross-location benchmarking — side-by-side unit comparison reveals operational best practices and identifies struggling locations before they become critical.
- Predictive territory modeling — AI systems integrating demographic data, competitor density, and foot-traffic patterns to score expansion opportunities.
Brands that invest in structured data intelligence gain a measurable advantage over competitors still relying on quarterly reports and manual analysis.
The Franchise Performance Benchmarking Framework
According to VetMyFranchise's 2026 performance benchmarks, the most effective franchise analytics programs follow a structured benchmarking framework:
- Investment-to-earnings ratio of 3:1 or better — recouping total initial investment within three years is the baseline signal of a healthy franchise unit.
- Ratios above 5:1 deserve scrutiny — analytics-savvy systems flag these units for operational review before they become liabilities.
- Net unit growth of +26.9% in the 100K–250K investment tier — the fastest-growing segment, driven by data-backed expansion decisions (FDDIQ, 2026).
These benchmarks underscore why franchises that track unit-level economics consistently outperform those that rely on system-wide averages. The granularity of the data determines the precision of the decisions.
Best Practices for Franchise Analytics Implementation
- Start with unit-level economics — track COGS %, labor %, and same-store sales weekly, not monthly. Small efficiency gains compound across the network.
- Separate development and consumer attribution — franchise development leads and end-consumer leads require different tracking models, KPIs, and dashboards.
- Deploy AI-driven compliance monitoring — automated audits catch deviations 41% faster than manual inspection cycles.
- Benchmark by vertical, not system-wide — QSR conversion rates (2.81%) differ 6.4x from full-service restaurants (0.44%). Using the wrong benchmark leads to wrong decisions.
- Track lead death causes, not just conversion — non-response is the #1 reason franchise leads die; analytics that flag stalled leads within 24 hours recover significantly more pipeline.
- Implement predictive territory scoring — 58% of large franchise systems already use predictive models; the competitive gap for non-adopters is widening every quarter.
Franchise Data Maturity: Where Most Systems Fall Short
Despite the headline adoption numbers, most franchise systems are still operating at early data maturity levels. The gap between collecting data and acting on it remains the single biggest analytics challenge for multi-location brands in 2026.
Franchise.com's performance metrics analysis identifies three distinct data maturity stages across franchise networks:
- Stage 1 — Reactive (est. 35% of systems): Data is collected but reviewed monthly or quarterly. Decisions are made after problems surface, not before. Most emerging franchise brands with fewer than 25 locations operate here.
- Stage 2 — Proactive (est. 45% of systems): Weekly dashboards with automated alerts highlight deviations. Unit-level benchmarking is active. This is where most franchise brands with 25–200 locations operate today.
- Stage 3 — Predictive (est. 20% of systems): AI models forecast performance, compliance risks, and territory opportunities. Real-time data flows from POS, CRM, and marketing platforms into a unified analytics layer. Primarily franchise systems with 200+ locations and dedicated analytics teams.
The critical insight is that data maturity correlates more strongly with franchise growth than total marketing spend. FDDIQ's 2026 dataset shows that brands with structured analytics programs — regardless of system size — achieve unit-level profitability 18–24 months faster than comparable brands operating without systematic tracking.
Multi-Unit Operator Analytics: The Overlooked Growth Lever
Multi-unit operators (MUOs) represent a disproportionate share of franchise growth. FranConnect's 2025 Sales Index shows that trade show leads convert at 13.5% while broker leads convert at just 3.9% — a 3.5x difference that data-driven franchise systems exploit by reallocating development resources toward higher-converting channels.
Analytics-enabled franchise brands track MUO performance at a granular level, including:
- Portfolio-level same-store sales — comparing MUO performance against single-unit operators to identify management efficiency patterns.
- Expansion velocity metrics — tracking time from signed agreement to open unit, where optimized development marketing accelerates the pipeline.
- Cross-unit labor optimization — MUOs with shared analytics visibility can redistribute staffing across locations based on demand forecasting.
- Aggregate purchasing data — multi-unit supply chain analytics that reduce per-unit COGS by leveraging volume across the portfolio.
The franchise systems investing most heavily in MUO-specific analytics dashboards are seeing faster expansion rates and lower franchisee churn, according to industry data from the 2025 Annual Franchise Marketing Report (AFMR).
Related reading
- Tracking Powersports Leads at Car Dealerships
- Evaluating Auto Repair Tracking and Analytics Software
- Key Metrics for Landscaping Analytics and Performance Tracking
- Marketing Analytics services at Web Tonic
Frequently Asked Questions
What KPIs should franchise systems track for unit-level analytics?
The essential franchise KPIs include labor cost percentage, COGS %, same-store sales growth, customer acquisition cost (CAC), and investment-to-earnings ratio. The 2026 benchmark for a healthy franchise unit is a 3:1 or better investment-to-earnings ratio, meaning the initial investment is recouped within three years. Tracking these weekly rather than monthly provides the operational agility to correct issues before they compound across the network.
How widely have franchise systems adopted AI-powered analytics?
According to AI Business OS research, 73% of franchise systems with 50+ locations now use some form of AI automation for analytics. The most common applications are franchisee performance tracking, automated compliance monitoring, and predictive territory management. Early adopters report 28% average operational cost reductions within 18 months of deployment.
What is a good franchise lead-to-agreement conversion rate?
The overall average is 1.50% as of 2025 (nearly double the 0.76% recorded in 2023), but rates vary widely by vertical. QSR franchises convert at 2.81%, while full-service restaurants convert at just 0.44%. The right benchmark is always your specific vertical rather than the industry-wide average, and improvements come primarily from better analytics and lead qualification — not more lead volume.
How does marketing attribution differ for franchise systems?
Franchise marketing attribution requires two separate models: one for franchise development (selling units to prospective franchisees) and one for consumer marketing (driving foot traffic and revenue to existing locations). Blending these two funnels in a single dashboard creates misleading ROI calculations. The best-performing franchise brands maintain distinct attribution pipelines with vertical-specific benchmarks.
What percentage of franchise marketing budgets goes to local channels?
72% of franchise systems allocate at least 40% of their marketing budgets to local SEO and local marketing channels. Industry practitioners recommend a 60/40 national-to-local ratio to balance brand awareness with local lead generation. Franchise brands tracking channel-level attribution at the local level report significantly higher marketing ROI than those using only system-wide blended metrics.
Sources
fddiq.com — State of Franchising 2026
franconnect.com — Franchise Lead Conversion Rate
franconnect.com — 2025 Franchise Sales Index
osforyour.business — AI Adoption in Franchise Operations
autymate.com — Franchise Analytics Guide 2026
marketingltb.com — Franchise Marketing Statistics 2026
vetmyfranchise.com — Franchise Performance Benchmarks 2026
franchise.com — Franchise Performance Metrics


