Table of contents

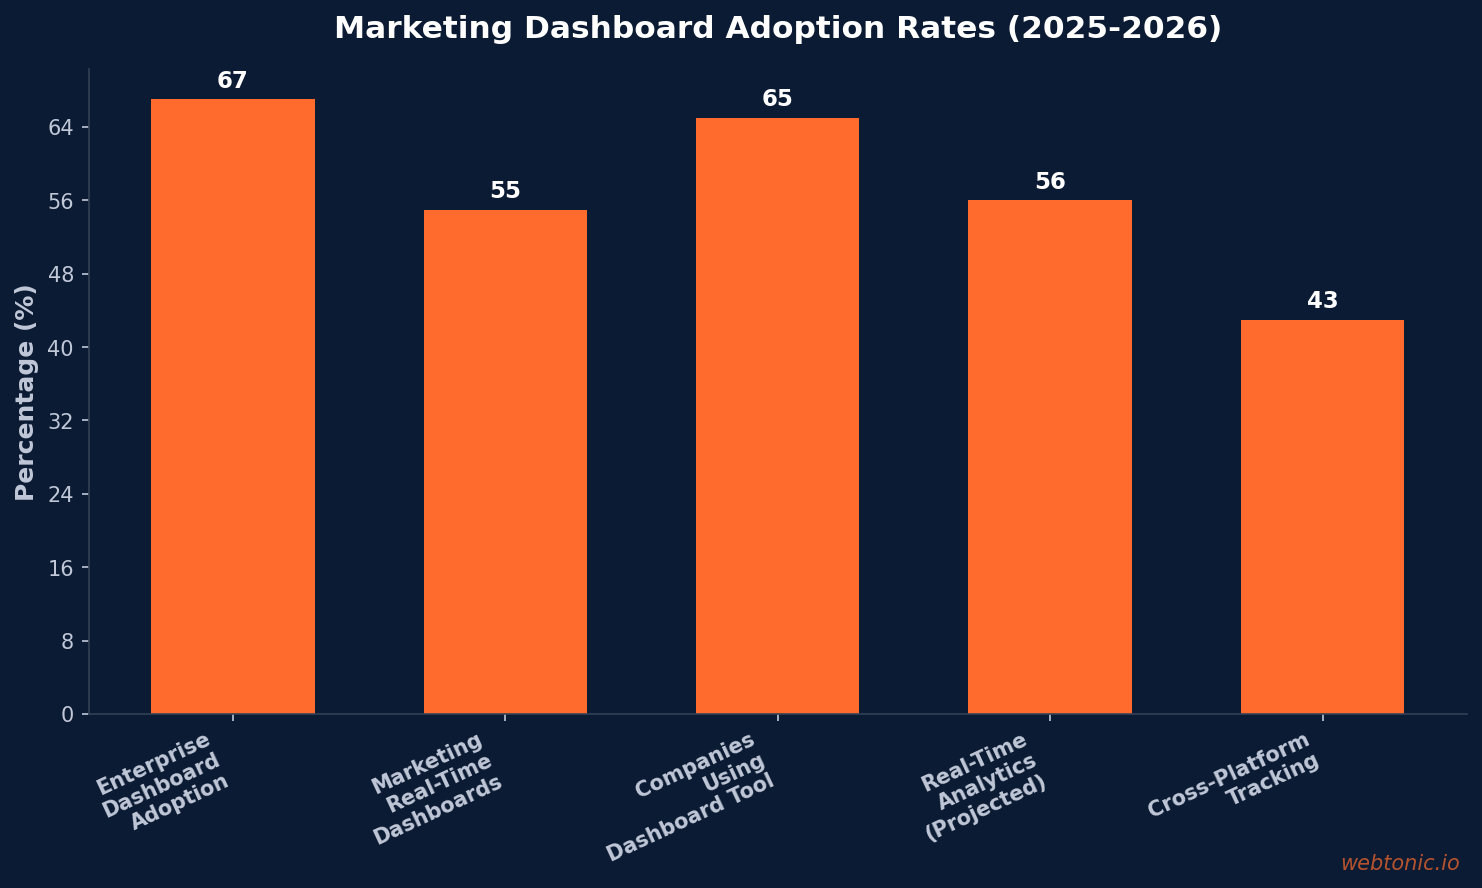
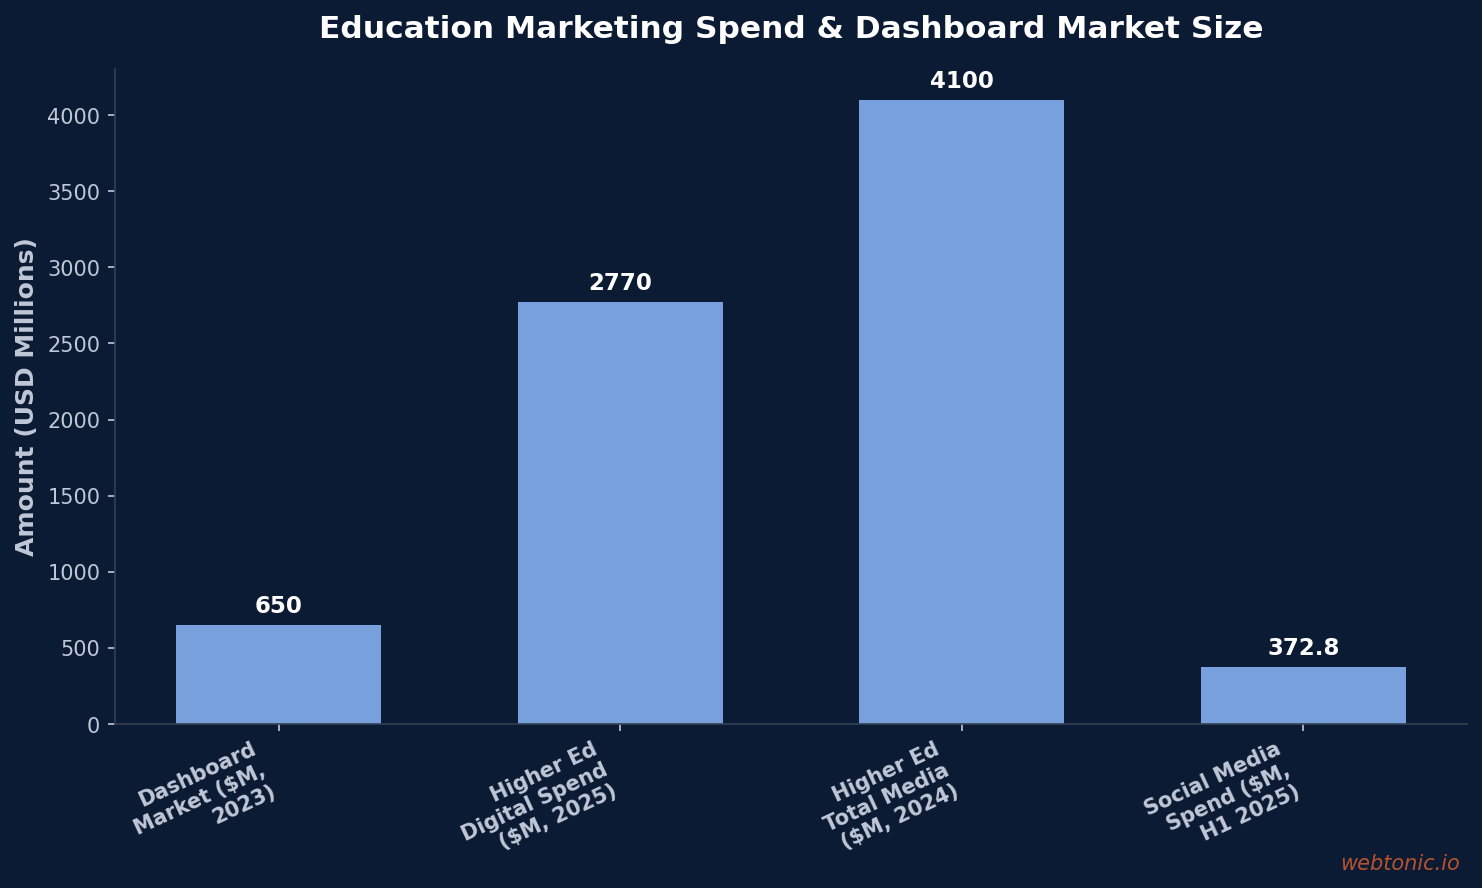
67% of enterprises now adopt marketing dashboards for data-driven decision-making (Gitnux), and the marketing dashboard market reached $650 million in 2023 with an 11.5% CAGR projected to push it past $1.5 billion by 2034. For education and coaching businesses — where higher education digital media spend surpassed $2.77 billion in 2025 (Click-Vision) — centralized reporting is no longer a nice-to-have feature. It is the foundation of enrollment growth and intelligent marketing measurement.
Key Takeaways
- 67% of enterprises adopt marketing dashboards for data-driven decisions, up from roughly 50% in 2020 (Gitnux).
- 55% of marketing teams rely on real-time dashboards for campaign optimization and budget reallocation (Gitnux).
- 65% of companies use a dedicated dashboard tool for analytics, indicating mainstream market penetration (Gitnux).
- Marketing dashboard market was $650 million in 2023, growing at 11.5% CAGR toward $1.5 billion by 2034 (DataIntelo).
- Higher education digital media spend surpassed $2.77 billion in 2025, up from $2.55 billion in 2024 (Click-Vision).
- 65% of education staff now use AI or emerging tech in marketing and enrollment functions, up from 40% in 2024 (EducationDynamics / UPCEA).
- Marketing dashboards analyze 1.8 billion social posts daily across platforms worldwide (WiFiTalents).
- Digital-traditional marketing mix shifted to 75/25 in 2025, from 71/29 in 2023 for higher education institutions (CMO Study).
Marketing Dashboard Adoption Statistics at a Glance
Dashboard adoption has shifted from a competitive advantage to a baseline operational requirement for marketing teams of all sizes. The data below captures adoption rates, market sizing, and technology penetration across industries — with education-specific insights highlighted where available. These benchmarks help education and coaching marketers benchmark their own analytics maturity against industry peers and plan infrastructure investments with confidence.
| Metric | Value | Year | Source |
|---|---|---|---|
| Enterprise dashboard adoption | 67% | 2025 | Gitnux |
| Real-time marketing dashboards | 55% | 2025 | Gitnux |
| Dashboard tool usage (any company) | 65% | 2025 | Gitnux |
| Dashboard market size | $650 million | 2023 | DataIntelo |
| Dashboard market CAGR | 11.5% | 2024–2034 | DataIntelo |
| Social posts analyzed daily | 1.8 billion | 2025 | WiFiTalents |
| Cross-platform tracking adoption | 43% | 2025 | DigitalApplied |
| Real-time analytics projected | 56% | 2027 (est.) | DigitalApplied |
| Cloud BI adoption rate | 59% | 2023 | Gitnux |
| Dashboard usage growth YoY | +4% | 2024–2025 | WiFiTalents |
Education Marketing Spend and the Dashboard Imperative
Higher education is experiencing a massive digital marketing transformation that makes centralized dashboards essential infrastructure rather than optional tooling. Total higher education media spend hit $4.1 billion in 2024, and the first half of 2025 alone already saw $2.4 billion in expenditures (Kiosk / HubSpot analysis). Digital media specifically surpassed $2.77 billion in 2025, up from $2.55 billion the prior year (Click-Vision), while social media spend on platforms like LinkedIn and Meta reached $372.8 million in H1 2025 alone.
This spend explosion creates an acute, measurable need for unified reporting. Institutions moved from a 71/29 digital-traditional split in 2023 to 75/25 in 2025 (Higher Ed CMO Study 2025-2026), signaling both maturity and modernization of marketing operations. Video spend, however, declined from $341.7 million in 2023 to $267.1 million in 2024 and continues to see outflows — a budget reallocation trend that dashboards help track and optimize in real time before money flows to underperforming channels. Without centralized reporting, institutions risk allocating budgets based on outdated channel assumptions rather than current performance data, especially as the number of active channels grows every year.
For coaching businesses, the budget numbers are smaller but the principle is identical. The coaching industry reached $15.2 billion globally in 2026 (AlphaCoast), with digital advertising representing a growing share of client acquisition spend. Coaching providers that adopt structured marketing analytics consistently outperform peers on client acquisition cost by 20–30%, primarily through faster budget reallocation to winning channels and faster identification of underperformers.
Dashboard Tools and Technology for Education Institutions
Education institutions are building centralized reporting ecosystems that pull data from marketing platforms, CRMs, and student information systems into unified views that enrollment teams can actually use for daily decisions. The technology choices span from custom BI stacks to purpose-built education dashboards, each addressing different institutional needs and technical capabilities:
Windsor.ai's case study with Cognita — a global education network operating schools across multiple continents — demonstrates how large institutions use Google BigQuery as the cloud data warehouse and Looker Studio as the real-time reporting layer for accessible, region-level performance dashboards. This architecture enables multi-campus marketing teams to compare enrollment pipeline performance across geographies without manual spreadsheet consolidation, reducing reporting cycles from weekly manual builds to real-time automated views.
HubGem reports that HubSpot reporting works particularly well for education because it pulls data directly from the CRM — the same data enrollment teams already use every day — rather than relying on separate analytics tools, disconnected spreadsheets, or manual data exports. This native CRM integration eliminates the most common data accuracy problem in education marketing: numbers in the marketing dashboard not matching numbers in the admissions CRM because they pull from different sources.
Pivot360 represents a newer category of purpose-built higher education marketing and enrollment dashboards that integrate data from marketing platforms, analytics tools, and CRM into one unified enrollment funnel view. Attain Partners takes the analytics layer further with predictive analytics for strategic enrollment management, using historical data patterns and real-time signals to forecast application volume, enrollment yield, and melt risk — shifting institutional decision-making from reactive to proactive.
| Dashboard Solution | Type | Key Feature | Best For |
|---|---|---|---|
| Looker Studio + BigQuery | Custom BI Stack | Region-level performance views | Multi-campus institutions with data teams |
| HubSpot Reporting | CRM-Native | Direct CRM data integration | Enrollment marketing teams using HubSpot |
| Pivot360 | Education-Specific | Unified enrollment funnel view | Enrollment management offices |
| Attain Partners | Predictive Analytics | Enrollment yield forecasting | Strategic enrollment management |
| SchoolXP MarketingXP | Campaign Attribution | Real-time campaign ROI by source | K-12 and higher education marketing |
| Windsor.ai | Multi-Channel Analytics | Cross-platform spend optimization | Performance marketing teams |
Marketing Dashboards for Coaching Businesses
Coaching businesses face unique dashboard requirements that extend well beyond standard marketing metrics, requiring integration of client outcomes and session performance data alongside acquisition and revenue tracking. Modern coaching dashboards typically include 5 core pages: business overview, individual coach performance, client analysis, program insights, and revenue trends (NextGen Templates). These pages connect with scheduling systems, billing platforms, and CRM tools to create a complete business intelligence picture that standard marketing-only dashboards cannot deliver.
Alternative Balance identifies the 7 metrics worth tracking for coaching businesses: source attribution, customer acquisition cost, lifetime value, conversion rate, average revenue per client, retention, and client progress. The critical strategic insight is that follower count is not on this list — successful coaching businesses measure revenue outcomes and client results, not social engagement vanity metrics. CoachStackHub offers free analytics dashboards with automated fit-scoring for pricing, pipeline, visibility, and authority, providing a starting point for coaches who lack custom BI infrastructure.
Tracking campaign performance at the individual coach and program level — not just account-wide totals — reveals which specific offerings drive the highest client lifetime value and which programs are consuming marketing budget without producing profitable client relationships.
AI-Powered Analytics in Education Marketing
AI adoption in education marketing analytics is accelerating at a pace few industry observers predicted even 18 months ago. The EducationDynamics / UPCEA AI Readiness Report shows 65% of education staff reported using AI or emerging tech in marketing and enrollment functions in 2025, up from 40% in 2024 — a remarkable 25-percentage-point jump in a single year. Among specific AI application categories, the adoption patterns reveal where institutions are investing first:
- Creative and design tools lead at 65% adoption — AI features are now embedded natively in most content creation platforms used by education marketers, powering everything from ad copy generation to image creation and video editing.
- Social media management tools follow at 51% — AI powers scheduling optimization, content recommendations, sentiment analysis, and audience targeting suggestions across platforms.
- CRM platforms show 31% AI adoption — primarily for lead scoring, predictive enrollment modeling, and automated nurture sequence optimization based on prospect behavior patterns.
- Data analytics tools reach 30% AI adoption — predictive enrollment forecasting is the fastest-growing application, helping institutions anticipate application volume and yield before traditional indicators appear.
FINN Partners reports that only 41% of B2B education companies expect growth in the current environment, making AI-powered efficiency gains even more critical for maintaining enrollment targets without proportional budget increases. More than one-third of K-12 buyers now rely on AI-powered search for discovering education products and services, creating an entirely new discovery channel that traditional dashboards were not built to track.
Predictive analytics has become increasingly familiar across higher education. Attain Partners reports that institutions now routinely rely on forecasts to estimate application volume, enrollment yield, and melt risk based on historical patterns and real-time behavioral signals. This shift from reactive reporting to predictive intelligence represents the biggest change in education marketing analytics since the transition from print advertising tracking to digital attribution a decade ago.
| AI/Tech Feature | Education Adoption Rate | YoY Change | Primary Impact |
|---|---|---|---|
| AI in marketing/enrollment (any) | 65% | +25pp from 2024 | Broad efficiency gains across workflows |
| AI in creative/design tools | 65% | Leading adoption category | Content generation and personalization at scale |
| AI in social media management | 51% | 2nd most adopted AI category | Scheduling optimization and audience insights |
| AI in CRM platforms | 31% | Growing fast | Lead scoring and predictive enrollment modeling |
| AI in data analytics tools | 30% | Emerging rapidly | Enrollment yield and melt risk forecasting |
| K-12 buyers using AI search | 33%+ | New discovery behavior | Alternative channel for EdTech product discovery |
Best Practices for Education & Coaching Marketing Dashboards
- Centralize all channel data into one dashboard — eliminate the spreadsheet consolidation cycle completely. Education institutions using centralized dashboards achieve 3–5× faster optimization cycles than those reconciling data manually across separate platform reports (Windsor.ai / Cognita case study).
- Track enrollment funnel metrics, not just click metrics — build dashboards around the full inquiry → application → enrollment → retention funnel with source attribution tracked at each stage. Click-through rates alone tell you nothing about enrollment quality or student lifetime value.
- Implement real-time reporting — 55% of marketing teams already use real-time dashboards. Education institutions that adopt real-time monitoring catch underperforming campaigns before they waste significant budget on declining audiences.
- Connect your CRM directly to your dashboard layer — both HubSpot and Slate offer native reporting that pulls real enrollment data and student interactions rather than marketing-only vanity metrics. The CRM connection is consistently the single highest-ROI dashboard integration for education institutions.
- Build predictive enrollment models — use application volume trends, enrollment yield patterns, and melt risk indicators to move from reactive to proactive marketing decisions. Attain Partners identifies this as the fastest-growing analytics capability in higher education, with early adopters gaining measurable enrollment advantages.
- For coaching: track all 7 core metrics in one unified view — source attribution, customer acquisition cost, lifetime value, conversion rate, average revenue per client, retention rate, and client progress. Maintain separate coach-level and program-level breakdowns to identify your highest-value service offerings.
- Integrate AI-powered anomaly detection — with 65% of education staff already using AI tools, dashboards that surface automated alerts for performance drops, budget pacing issues, and enrollment trend changes deliver significantly more value than static weekly or monthly reporting alone.
Frequently Asked Questions
What percentage of companies use marketing dashboards?
67% of enterprises adopt marketing dashboards for data-driven decision-making, and 55% of marketing teams specifically rely on real-time dashboards for campaign optimization. Overall dashboard tool usage across companies of all sizes stands at 65%, with the global market growing at 11.5% CAGR from $650 million in 2023.
How much do education institutions spend on digital marketing?
Higher education digital media spend surpassed $2.77 billion in 2025, up from $2.55 billion in 2024. Total media spend across all channels hit $4.1 billion in 2024, with H1 2025 alone reaching $2.4 billion. The digital-traditional marketing mix shifted to 75/25 by 2025, up from 71/29 in 2023.
What metrics should a coaching business dashboard track?
The 7 essential coaching dashboard metrics are: source attribution, customer acquisition cost, lifetime value, conversion rate, average revenue per client, retention rate, and client progress. These should be displayed at both account-wide and per-coach or per-program levels to identify which offerings drive the highest lifetime value.
How is AI changing education marketing analytics?
65% of education staff now use AI or emerging tech in marketing functions, up from 40% in 2024. AI is embedded in creative tools at 65% adoption, social media management at 51%, CRM platforms at 31%, and data analytics at 30%. Predictive enrollment forecasting is the fastest-growing application, helping institutions anticipate outcomes before traditional indicators appear.
What dashboard tools work best for education marketing?
Popular options include Looker Studio paired with BigQuery for custom multi-campus analytics, HubSpot for CRM-native enrollment reporting, Pivot360 for purpose-built enrollment funnel visualization, and Attain Partners for predictive enrollment management. The best choice depends on institution size, existing technology stack, and analytics team capabilities.
Sources
gitnux.org
wifitalents.com
digitalapplied.com
click-vision.com
cufinder.io
attainpartners.com
windsor.ai
alphacoast.com