



Table of contents
Restoration companies that track marketing KPIs through purpose-built dashboards are 2× more likely to increase revenue year over year than those relying on gut instinct. With the disaster restoration market projected to reach $89.1 billion by 2036, the gap between data-driven firms and everyone else is widening fast—here are the numbers behind the dashboards reshaping the industry.
Key Takeaways
- 55% of marketing teams rely on real-time dashboards for campaign decisions (Gitnux, 2026).
- Restoration companies using call tracking improve marketing ROI visibility by 61% (Marketing LTB).
- The healthy restoration marketing ROAS benchmark is $8–$12 return per dollar invested (Tygart Media).
- The restoration management software market is valued at $945 million with a 9.3% CAGR (Data Insights Market).
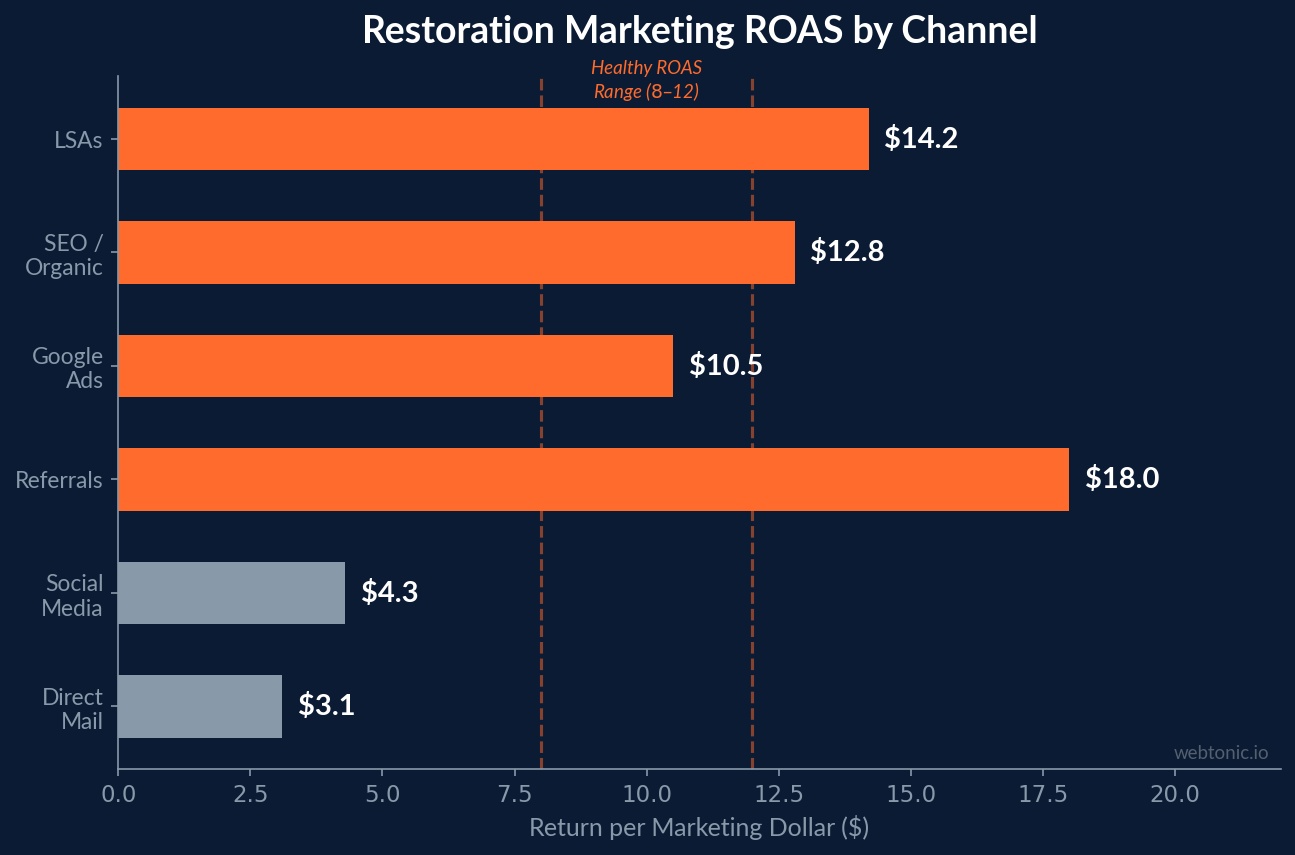
- 67% of enterprises have adopted business intelligence dashboards (Gitnux, 2026).
- Marketing dashboard market reached $650 million in 2023 and continues to grow (Gitnux).
- Companies tracking KPIs across channels see 2× faster decision-making (Restoration Marketers).
Disaster Restoration Dashboard Benchmarks at a Glance
| Metric | Benchmark | Source |
|---|---|---|
| Healthy ROAS | $8–$12 per dollar | Tygart Media |
| Avg. Cost per Qualified Call | $45–$120 (national) | Tygart Media |
| LSA Close Rate | 65–72% | Tygart Media |
| Residential Lead-to-Job Rate | 40–55% | Tygart Media |
| Call Tracking ROI Lift | +61% | Marketing LTB |
| Dashboard Adoption (Enterprises) | 67% | Gitnux |
| Real-Time Dashboard Reliance | 55% of marketing teams | Gitnux |
| Restoration Mgmt Software Market | $945M, 9.3% CAGR | Data Insights Market |
Why Dashboards Are Critical for Disaster Restoration Marketing
The disaster restoration industry operates on razor-thin margins with high-urgency, high-ticket jobs—a single water damage lead can generate $2,100 to $8,900 in revenue (Tygart Media). Without real-time visibility into which channels produce those leads, companies bleed budget into underperforming campaigns.
According to Gitnux, 67% of enterprises now use business intelligence dashboards, and the marketing dashboard market hit $650 million in 2023. For restoration firms, dashboards consolidate fragmented data from Google Ads, LSAs, Google Business Profile, call tracking, and CRM into one view—replacing the spreadsheet chaos that 54% of marketers still struggle with (Konabayev).
Restoration companies using analytics dashboards improve marketing decision-making speed and are 2× more likely to grow revenue, according to Marketing LTB's 2026 benchmark study. The fragmented nature of the industry—with approximately 62,582 damage-restoration businesses in the U.S. employing roughly 115,280 people (Proof.co)—means that the majority of competitors still rely on manual reporting, creating a significant competitive advantage for data-driven firms.
Essential KPIs Every Restoration Dashboard Should Track
Not all metrics matter equally. Tygart Media's restoration KPI framework identifies the dashboard metrics that actually move revenue:
| KPI Category | Key Metrics | Why It Matters |
|---|---|---|
| Lead Attribution | Lead source, cost per lead, lead-to-job rate | Reveals which channels deliver profitable work |
| Revenue Tracking | Monthly totals by job type, avg. job value, ROAS | Connects marketing spend to actual revenue |
| Cycle Time | FNOL to final invoice, avg. by job type | Identifies operational bottlenecks impacting cash flow |
| Call Analytics | Call volume, answer rate, missed-call rate, call duration | 85% of restoration leads come by phone |
| Channel Performance | Google Ads CPC, LSA CPL, organic sessions, referral leads | Enables data-backed budget reallocation |
| Customer Acquisition | CPA by service type, close rate, customer LTV | Reveals which services generate highest ROI |
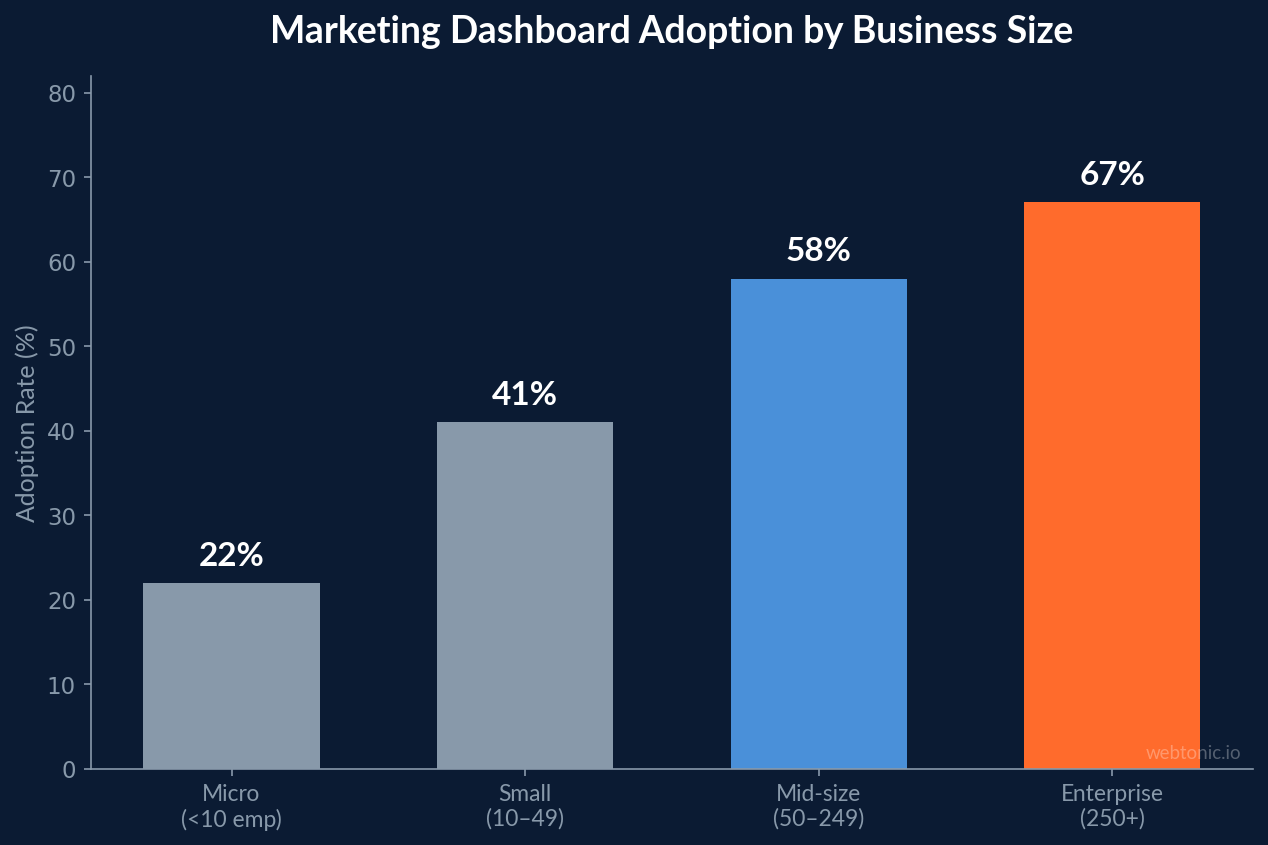
The benchmark for healthy restoration marketing is $8–$12 return per dollar invested. Channels consistently below $5 need optimization or reallocation; channels above $15 deserve more budget (Tygart Media Martech Stack Guide). Tracking these KPIs at the campaign level rather than in aggregate is what separates restoration companies that scale profitably from those that plateau.
Call Tracking and Analytics in Disaster Restoration
Phone calls dominate restoration lead flow—85% of restoration leads arrive by phone (Marketing LTB). Companies using call tracking improve marketing ROI visibility by 61%, yet many restoration firms still don't track which campaigns generate their calls.
Basic call tracking plans run $30–$60 per month for one number and 500 minutes. Restoration companies typically need $100–$200 per month for multiple local numbers and call recording (Tygart Media)—a fraction of the wasted ad spend without tracking.
Multi-stage attribution matters because restoration customers often call multiple times before committing. Marketing LTB notes that generic dashboards miss restoration-specific factors like seasonal fluctuations, emergency response windows, and insurance claim cycles—requiring customized reporting setups that map the full customer journey from first touch to completed job.
Dynamic number insertion (DNI) is the gold standard for restoration call tracking. By assigning unique phone numbers to each marketing channel, companies can attribute every inbound call to its source. The average cost per qualified call ranges from $45 to $120 nationally, with major metros averaging $90–$150 (Tygart Media). Without call tracking, these costs remain invisible, and budget decisions are based on guesswork rather than data.
Restoration Management Software Market Statistics
The tools powering restoration dashboards represent a fast-growing market. According to Data Insights Market, the restoration management software market is valued at $945 million with a 9.3% CAGR—driven by demand for integrated analytics, job management, and compliance documentation.
Key platform categories include:
- All-in-one restoration platforms (Xcelerate, DASH by Next Gear, Albiware) that combine job management with embedded analytics dashboards covering financial, sales, marketing, and operational reports.
- Business intelligence overlays (Lumina BI) that pull data from QuickBooks, CRMs, and field tools into visual dashboards tracking sales, gross profit, expenses, and KPIs by division.
- Marketing-specific dashboards that integrate Google Ads, LSA, and call tracking data into growth marketing performance views.
- Custom BI solutions using tools like Google Data Studio, Power BI, or Tableau that connect directly to advertising APIs and CRM databases for fully customized restoration reporting.
Marketing Dashboard Adoption Statistics
Dashboard adoption is accelerating across industries, and restoration companies that lag behind risk falling further behind competitors. Key adoption statistics include:
- Business intelligence dashboard adoption increased 45% among enterprises from 2020 to 2025 (Gitnux).
- 55% of marketing teams rely on real-time dashboards for campaign optimization decisions.
- 41% of marketers still cannot measure marketing effectiveness across channels (Konabayev).
- 75% of companies now use multi-touch attribution models—up from 30% in 2020 (Digital Applied).
- Marketing dashboards analyze 1.8 billion social posts daily across platforms.
- 48% of CMOs report their teams lack the analytical skills to fully leverage dashboard data.
For restoration companies, the gap between tracking everything in a unified dashboard versus relying on scattered spreadsheets translates directly to faster reallocation of ad spend, quicker identification of underperforming channels, and better alignment between marketing and operations teams. Given that restoration Google Ads CPCs have increased over 35% since 2022, the cost of misallocated budget is higher than ever.
Data-Driven Marketing Strategies for Restoration Companies
Marketing LTB outlines a practical framework for building a data-driven restoration marketing operation:
- Export 24 months of lead data from your CRM or phone system to establish baselines and identify seasonal patterns unique to your market.
- Connect call-tracking numbers, form submissions, and GBP actions into one dashboard—GA4 and a simple CRM handle most of this integration.
- Segment by service type (water, fire, mold, biohazard) since each service has different CPAs and close rates that require independent budget allocation.
- Review channel performance monthly: SpotOn Solutions recommends tracking cost per acquisition alongside job value, because higher-ticket commercial jobs justify higher CPAs.
- Automate weekly reports to surface anomalies before they drain budget, and set threshold alerts for KPIs that drift beyond acceptable ranges.
Companies that follow this process see marketing decision-making speed improve measurably, with lead source attribution becoming the single most valuable dashboard panel for restoration firms. The key insight from multiple industry sources is that revenue per marketing dollar by channel is the north-star metric—not vanity metrics like impressions or clicks.
Restoration vs. General Industry: Dashboard Usage Comparison
| Metric | Restoration Industry | General Industry Average |
|---|---|---|
| Dashboard Adoption | ~40% (estimated) | 67% (Gitnux) |
| Real-Time Reporting | Growing but lagging | 55% of teams (Gitnux) |
| Call Tracking Usage | High — 85% phone leads | Moderate |
| Multi-Touch Attribution | ~30% adoption | 75% (Digital Applied) |
| CRM Integration | Most use job mgmt software | Standard practice |
| Avg. ROAS Tracked | $8–$12 healthy benchmark | Varies widely by vertical |
Restoration companies generally trail the broader market in marketing analytics sophistication, but the ones that invest in proper dashboards disproportionately outperform—a pattern consistent with the 2× revenue growth advantage reported by Marketing LTB. The restoration industry's reliance on phone leads actually makes dashboard ROI higher than average, because call tracking creates a direct, measurable link between ad spend and revenue that many digital-first industries lack.
Best Practices for Restoration Marketing Dashboards
Based on industry benchmarks and practitioner insights, here are the reporting best practices that drive the strongest results:
- Build channel-specific views: separate dashboards for Google Ads, LSAs, SEO, and referrals prevent metrics from blending into meaningless averages. Each channel has different benchmarks and optimization levers.
- Track by service line: water damage, fire restoration, and mold remediation have vastly different average job values ($2,100–$8,900) and conversion rates (40–55% residential, 15–30% commercial).
- Set automated alerts: configure threshold-based notifications when cost per lead exceeds benchmarks, call answer rates drop, or daily spend deviates from targets.
- Review weekly, optimize monthly: weekly check-ins catch anomalies; monthly deep-dives drive strategic reallocation based on accumulated data.
- Include operational KPIs alongside marketing metrics: cycle time from FNOL to final invoice and crew utilization directly impact marketing ROI by affecting capacity and customer satisfaction.
Frequently Asked Questions
What KPIs should a restoration company dashboard track?
At minimum, track lead source attribution, cost per lead by channel, lead-to-job conversion rate, average job value, ROAS per channel, call volume and answer rate, and cycle time from first notice of loss to final invoice. Phone-based KPIs are especially critical since 85% of restoration leads arrive by phone.
How much does marketing dashboard software cost for restoration companies?
Basic call tracking starts at $30–$60 per month. Full restoration management platforms with embedded analytics range from $200 to $500+ per month depending on features and user count. Dedicated BI overlays like Lumina add $100–$300 per month on top of your existing tools.
What is a good ROAS for restoration marketing?
The industry benchmark is $8–$12 return per marketing dollar. Channels consistently below $5 need optimization or reallocation, while channels above $15 signal an opportunity to scale spend for additional growth.
How do restoration companies track marketing ROI?
The most effective approach combines call tracking with dynamic number insertion, CRM integration for job-level revenue attribution, and a unified dashboard that maps each closed job back to its original marketing source. Companies using this setup improve ROI visibility by 61%.
Are marketing dashboards worth it for small restoration businesses?
Yes. Even a basic dashboard connecting Google Ads, call tracking, and a CRM can reveal which channels produce profitable jobs versus those that burn budget. With average CPCs exceeding $35 for restoration keywords, wasted spend without tracking can cost thousands monthly.
Sources
marketingltb.com — Restoration Marketing Statistics 2026
tygartmedia.com — Restoration Business KPI Dashboard
tygartmedia.com — Restoration Company Martech Stack
gitnux.org — Dashboard Statistics 2026
konabayev.com — Marketing Analytics Statistics 2026
datainsightsmarket.com — Restoration Management Software Market
luminabi.com — Restoration Dashboard
spotonsolutions.com — 2026 Restoration Marketing Benchmarks
digitalapplied.com — Marketing Analytics Statistics 2026


