



Table of contents
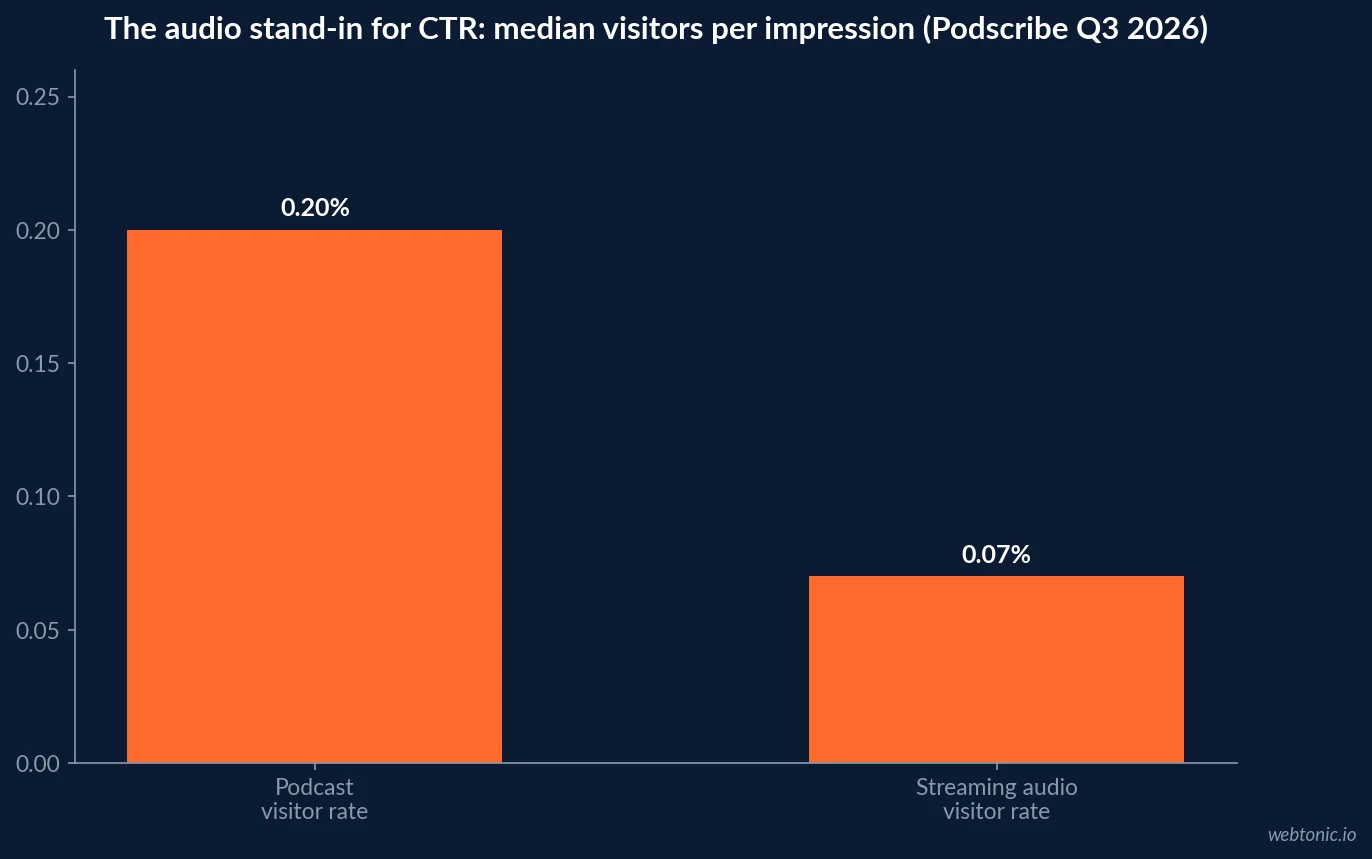
No published dataset reports a cost per lead or click-through rate for fitness podcast ads, so the honest answer is a set of cross-industry stand-ins, each labelled with who measured it. The most useful is Podscribe's median podcast visitor rate of 0.20% of impressions (vendor data, Q3 2026 report).
Key Takeaways
- Median podcast visitor rate is 0.20% of impressions, against 0.07% for streaming audio (Podscribe).
- Median podcast cost per visitor is USD 10.00; cost per acquisition is USD 168.
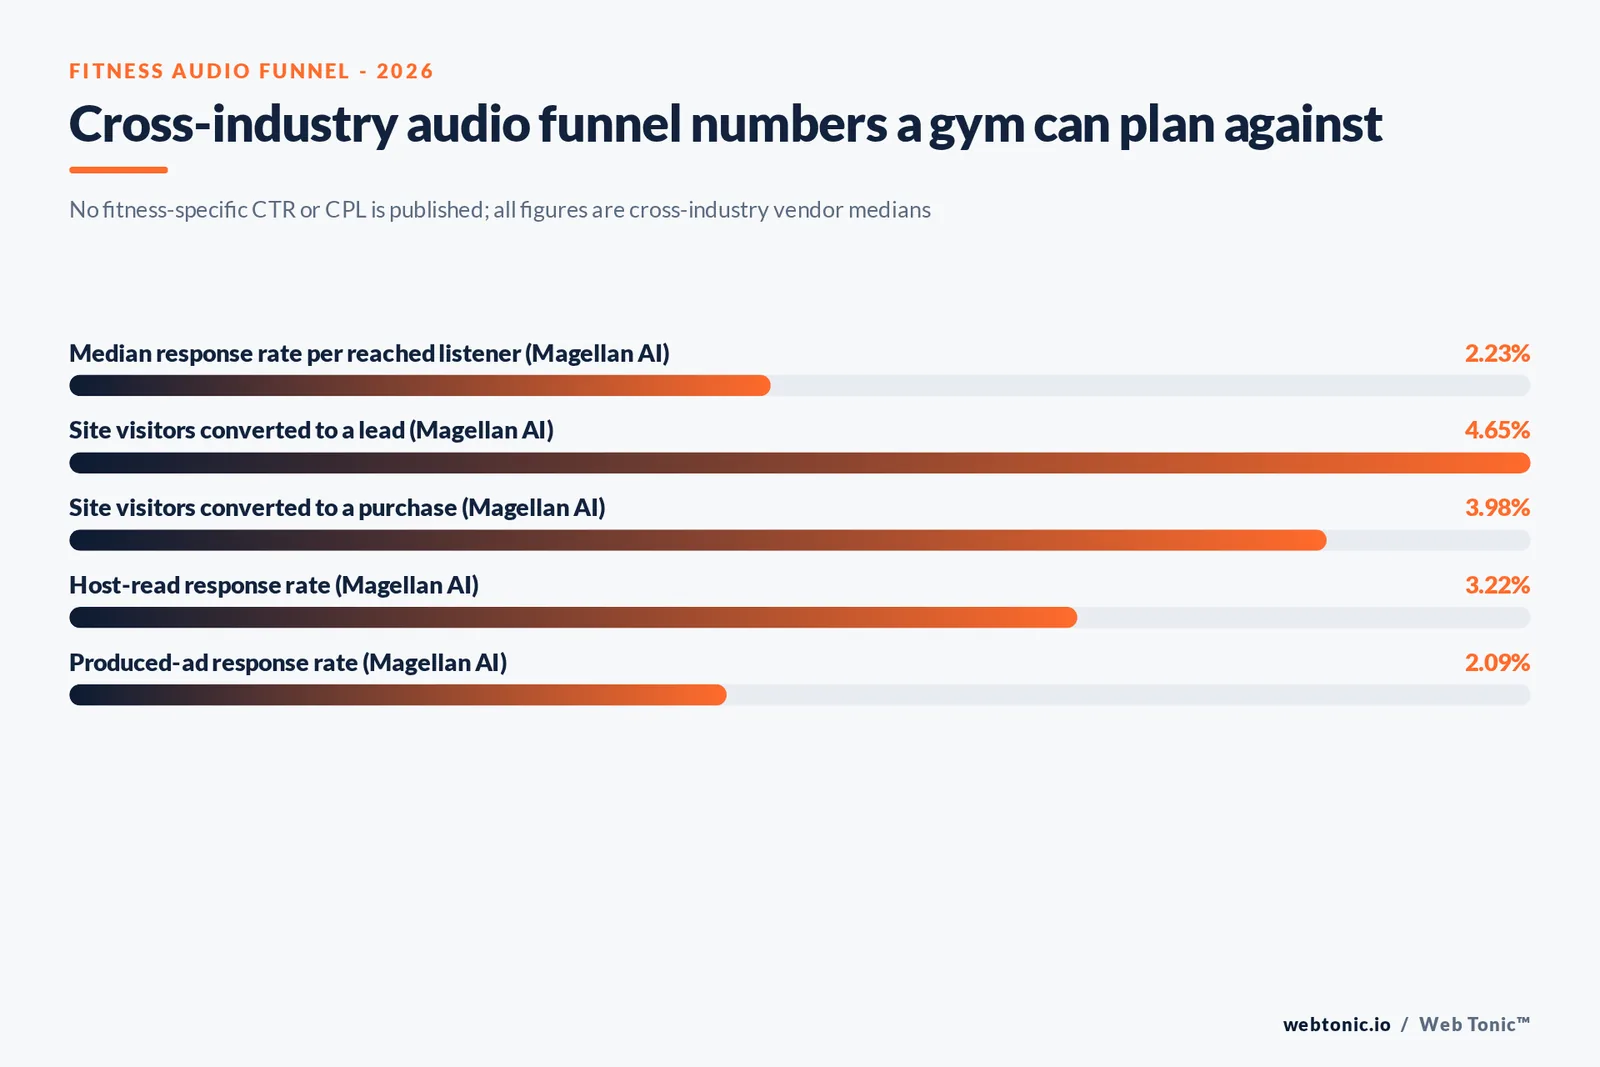
- The midpoint campaign put 2.23% of reached listeners on a site (Magellan AI, 30-day window).
- 4.65% of those visitors became leads and 3.98% became purchases.
- Health and fitness shows priced at USD 24 CPM in August 2024 (Libsyn Ads).
- Physical health and fitness shows took 1.8% of podcast ad revenue in 2023 (IAB/PwC).
- 81 million Americans held a fitness facility membership in 2025, up 5.2% (HFA).
- 36% of podcast listeners tried a lifestyle change because of a podcast (Pew).
- No fitness-specific podcast CPL or CTR is published by any dataset reviewed.
Why Audio Has No True CTR
Click-through rate assumes a clickable unit. A podcast ad is heard, often while the listener is driving, running or lifting, and response arrives later as a typed URL, a search or a code. Measurement vendors therefore report substitutes, and each uses a different denominator. Mixing them is the most common planning error.
| Metric | Definition | Denominator | Who reports it |
|---|---|---|---|
| Visitor rate | Site visitors divided by impressions | Impressions (includes frequency) | Podscribe |
| Response rate | Share of unique reached listeners who visit the site | Unique reach, 30-day lookback | Magellan AI |
| Lead conversion | Share of site visitors who become a lead | Site visitors | Magellan AI |
| Cost per visitor | Spend divided by visitors | Visitors | Podscribe |
| Cost per acquisition | Spend divided by purchases or defined actions | Purchases | Podscribe |
That is why a 0.20% visitor rate and a 2.23% response rate can both be true: one counts every impression, the other counts each listener once. Neither is a fitness figure.
Frequency widens the gap. Podscribe reports an average frequency of 1.2 for episodic buys and 2.1 for impression-based buys, and 9.6% of impression-based impressions reach a listener 15 or more times, against 0.6% for episodic buys. A per-impression rate therefore falls as frequency climbs even when the same people respond, while a per-listener rate does not. When a network quotes a "click-through rate" for an audio campaign, it is usually the companion banner in a streaming app, a different unit again. Ask which denominator sits under any number a seller shows you, and compare your gym's results only with benchmarks built on the same base.
Cross-Industry Podcast and Streaming Audio Medians
Podscribe's Q3 2026 Performance Benchmark Report covers August 2025 to July 2026, more than 105,000 campaigns, 700-plus advertisers and 36 billion impressions, using a median of advertiser medians. It is vendor data, US campaigns only, with a 10,000-impression minimum per campaign.
| Metric (median) | Podcast | Streaming audio |
|---|---|---|
| Visitor rate | 0.20% | 0.07% |
| Cost per visitor | USD 10.00 | USD 8.00 |
| Conversion rate | 0.015% | 0.006% |
| Cost per acquisition | USD 168 | USD 204 |
| Attributed visitor conversion rate | 6.4% | 4.1% |
| Purchase incrementality | 26% | 19% |
Podcasts win on response per impression and on cost per acquisition; streaming audio is cheaper per visitor. For a gym chasing trial sign-ups, the podcast CPA line is the more relevant comparison, but it counts purchases across all categories, from retail to software.
From Listener to Lead: The Magellan AI Funnel
Magellan AI's Q2 2026 measurement report (vendor data, campaigns January to June 2026, medians) gives the closest thing to a lead benchmark. The midpoint campaign put 2.23% of unique reached listeners on an advertiser site within 30 days. Of those visitors, 4.65% converted to a lead and 3.98% to a purchase. Campaigns judged at seven days showed less than half of their eventual response.
For a studio, a "lead" might be a free-class booking and a "purchase" a membership, but the report covers all advertiser categories, so these are shape-of-funnel figures, not fitness targets.
| Funnel stage | Median | Base |
|---|---|---|
| Reached listeners who visit the site | 2.23% | Unique reach, 30-day lookback |
| Visitors who become a lead | 4.65% | Site visitors |
| Visitors who purchase | 3.98% | Site visitors |
| Host-read response rate | 3.22% | Unique reach |
| Produced-ad response rate | 2.09% | Unique reach |
| New podcast listeners who return | 55.5% | Listeners acquired via podcast promos |
Host Read, Producer Read or Announcer
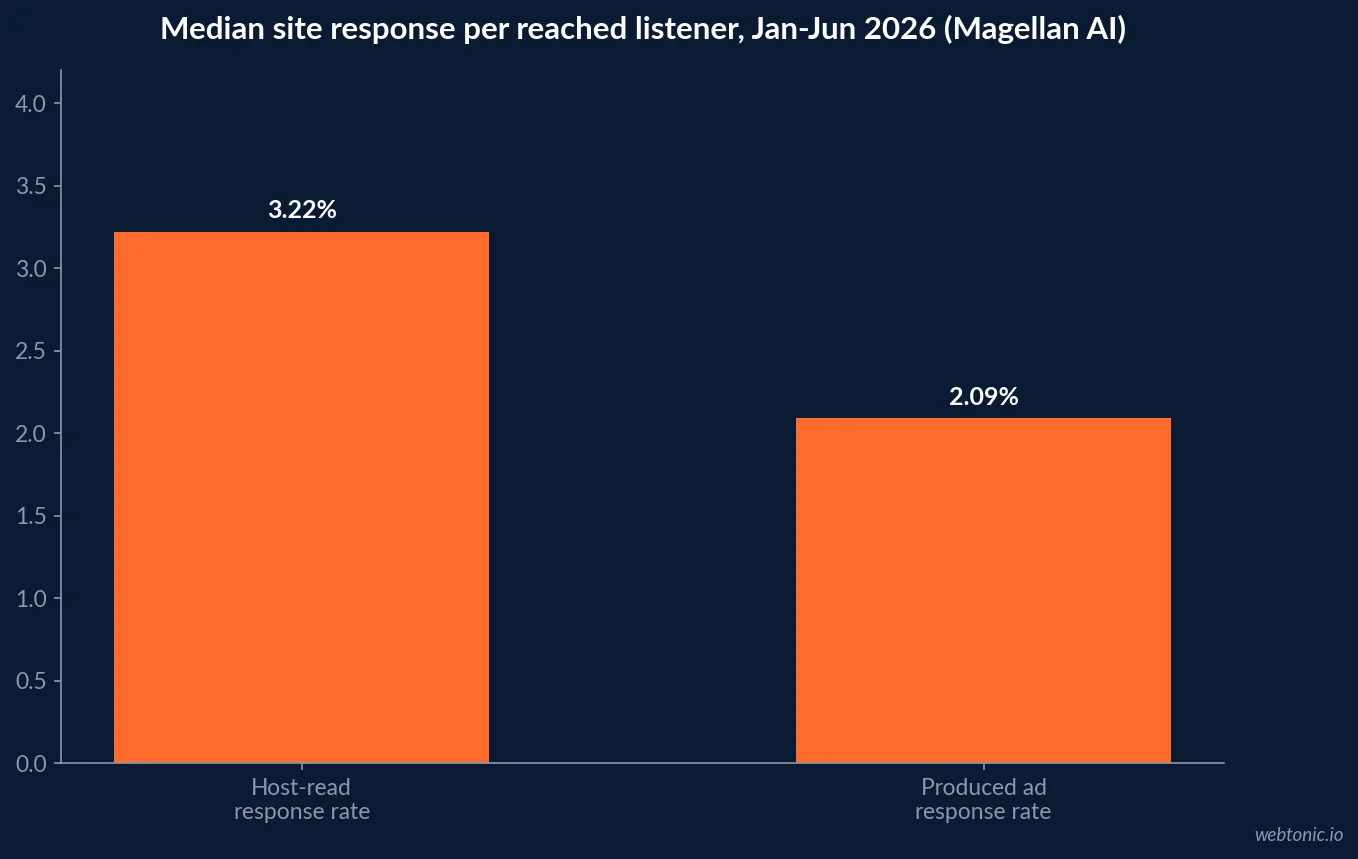
Trainer-hosted shows make host reads tempting for gyms. The evidence is mixed. Magellan AI finds host reads delivered a response rate 54% higher than produced ads (3.22% against 2.09%). Podscribe (originally published Q2 2026) finds host reads convert slightly better per impression, 0.018% against 0.016%, but cost more per acquisition, USD 137 against USD 123. A 2022 NPR and Veritonic test with 321 panelists found host and announcer reads scored within less than one point on recall and purchase intent.
Incrementality, Ad Load and Local Studios
Attributed conversions are not all new business. Podscribe estimates the share of attributed purchases actually caused by the ads: a median of 26% for podcast-only advertisers and 19% for streaming-only advertisers. Smaller brands with under one million monthly site visitors see far more, at 49% incremental lift on podcasts and 45% on streaming audio, likely because they reach audiences who had never heard of them. That profile fits an independent studio better than a national chain.
Timing matters as much. Podcast incrementality crosses the halfway mark around days 16 to 20 and remains measurable to 60 days, so a January membership push booked in late December will keep attributing sign-ups well into February. Clutter is the other variable: Podscribe puts average podcast ad load at 10.3% of content time in Q2 2026, up from 8.5% in Q3 2021, and reports that performance per impression declines as ad load rises. Shows with lighter ad breaks are worth a premium CPM for a response-driven gym offer. The same report ranks designated market area as the targeting factor with the largest effect on performance, ahead of recent site visits and household buying power.
What Fitness Shows Cost on a Published Card
Libsyn Ads published monthly CPMs from actual sales until 2024. In August 2024 the average 60-second CPM was USD 21.25; health and fitness shows averaged USD 24, the third-highest category behind government and technology at USD 29. True crime, sports and fiction ran in the high teens to low 20s. The series is now archived, so ask each network for its current card.
On the revenue side, the IAB/PwC podcast revenue study shows physical health and fitness shows took 1.8% of US podcast ad revenue in 2023 and mental and emotional health shows 0.9%. Health and wellness advertisers accounted for 3.5%. Total podcast ad revenue has since reached USD 2.9 billion in 2025 (IAB/PwC).
Buy Types and Their Efficiency
How the inventory is bought changes the cost line more than the show genre does. Podscribe data (originally published Q2 2026) splits podcast buys three ways.
| Buy type | Median visitor rate | Median purchase rate | Median CPA |
|---|---|---|---|
| Direct show | 0.25% | 0.027% | USD 98 |
| Direct run-of-network | 0.28% | 0.017% | USD 64 |
| Programmatic | 0.32% | 0.021% | USD 74 |
Episodic buys, where one ad runs in every play of an episode, posted a 0.017% purchase rate against 0.011% for impression-based buys, with the same USD 158 CPA. For a local gym, run-of-network or programmatic buys with geographic targeting are usually the realistic starting point.
The Fitness Audience Is Already Listening
Pew Research Center's survey of 5,132 US adults (December 2022, published 2023) found 49% had listened to a podcast in the past year. Among those listeners, 27% regularly listen to health and fitness podcasts, and 36% have tried a lifestyle change such as a workout routine, diet or journaling because of a podcast. 28% have bought something promoted or discussed on a podcast. Edison Research ranks wellness and self-improvement among the top 10 podcast topics in Q1 2026.
Gym Demand Behind the Audio Budget
| Fitness demand indicator | Figure | Source |
|---|---|---|
| Fitness facility members, 2025 | 81 million (+5.2%) | Health and Fitness Association |
| All facility users incl. non-members | More than 100 million | HFA 2026 consumer report |
| Highest membership penetration | 35.5% of adults 18-24 | HFA |
| Fastest-growing member cohort | 65+, up 8.6% | HFA |
| Average visits per location, 2025 | More than 184,000 (+4.2%) | HFA traffic tracker |
| Consecutive quarters of visit growth | 19 | HFA, Q4 2025 |
Demand is rising, but these are industry counts. They say nothing about how many members were won by audio, and no dataset reviewed links gym sign-ups to podcast exposure.
Results Claims and the FTC
Fitness copy leans on transformations, which the FTC Endorsement Guides address directly. A testimonial implying results must reflect what people can generally expect in similar circumstances or clearly disclose the generally expected result, and the advertiser needs substantiation. Trainers or hosts who get free memberships have a material connection that must be disclosed where the audience would not expect it.
Measurement Plan for a Gym Audio Test
- Pick one metric family and stick to it: visitor rate per impression or response rate per listener.
- Place a pixel on the booking page; promo codes alone miss most conversions.
- Define the lead (free class, guest pass) before launch so cost per lead is your own, not borrowed.
- Read results at 30 days, not seven.
- Compare against your other channels, such as fitness Google Ads data and fitness SMS marketing statistics.
See also our fitness influencer and UGC data, or ask Web Tonic to set up tracking before you buy.
Frequently Asked Questions
What is the CTR of podcast ads for gyms?
No fitness-specific figure exists, and audio has no click in the display sense. The closest cross-industry stand-in is Podscribe's median podcast visitor rate: 0.20% of impressions lead to a measured site visit (Q3 2026 report, August 2025 to July 2026, 105K+ campaigns). Streaming audio sits at 0.07%. Both are vendor medians across all industries.
What is a typical cost per lead for fitness podcast advertising?
None is published. Cross-industry, Podscribe reports a median podcast cost per visitor of USD 10.00 and cost per acquisition of USD 168, and Magellan AI reports that the midpoint campaign converted 4.65% of site visitors to a lead in January to June 2026. The two vendors measure differently, so do not multiply one by the other; test and measure your own cost per lead.
Do health and fitness podcasts cost more to advertise on?
Slightly, on the one published card. Libsyn Ads reported health and fitness shows at USD 24 CPM in August 2024, third-highest behind government and technology at USD 29, against a USD 21.25 average for a 60-second spot.
Do people act on fitness advice from podcasts?
Some do. Pew Research Center's December 2022 survey found 36% of podcast listeners had tried a lifestyle change, such as a workout routine or diet, because of a podcast, 27% regularly listen to health and fitness podcasts, and 28% had bought something promoted or discussed on a podcast.
Should a gym use host reads or produced spots?
Test both. Magellan AI reports host-read ads posted a 3.22% median response rate against 2.09% for produced ads, while an NPR and Veritonic test found host and announcer reads within one point on recall and purchase intent. Podscribe finds host reads convert slightly better per impression but cost more per acquisition.
Sources
Podscribe Performance Benchmark Report Q3 2026 (vendor)
Magellan AI Podcast Measurement Benchmark Report Q2 2026 (vendor)
Libsyn Ads, August 2024 Podcast Ad Rates (vendor)
IAB/PwC U.S. Podcast Advertising Revenue Study, FY2023
IAB/PwC Internet Advertising Revenue Report, Full Year 2025
Pew Research Center, How Americans use and engage with podcasts (2023)
Edison Research, The Podcast Consumer 2026
HFA, 81 Million Americans Were Members of a Fitness Facility in 2025
HFA, US Fitness Industry Extends Record Visitation Streak Through 2025
National Public Media and Veritonic, host vs announcer reads (2022)
16 CFR Part 255, FTC Endorsement Guides


