



Table of contents

No published dataset tracks where fitness brands put their native advertising budgets this year, so the honest answer to the title is: nobody has measured it. What is measured points to the pressures around that budget - a record 81 million US gym members in 2025, social ad revenue up 32.6%, and fitness search leads rising to USD 67.36. This page follows those signals and labels every cross-industry native figure as cross-industry.
Key Takeaways
- US fitness facility membership reached a record 81 million in 2025, up 5.2% (HFA).
- That equals 26.1% of Americans aged six and older; Gen Z adults sit at 35.5%.
- Americans made nearly 7 billion visits to gyms, clubs and studios in 2025.
- Planet Fitness ended 2025 with about 20.8 million members and 2,896 clubs.
- Its ad fund plus local requirements supported over USD 360 million of 2025 spend.
- Franchisees must spend 7% of monthly dues on local advertising.
- US social ad revenue grew 32.6% in 2025; search grew 11.0% (IAB/PwC).
- Taboola's 2025 ex-TAC gross profit grew 6.9% to USD 713.5 million.
- Fitness search leads rose from USD 62.80 to USD 67.36 between WordStream editions.
- Fitness Facebook lead campaigns cost USD 52.98 a lead in 2025.
- No fitness native CPL, CTR or budget share is published.
Why the budget question has no direct answer
Budget-direction claims need a time series of spend by channel for one industry. For fitness and native that series does not exist. The IAB/PwC FY2025 report has no native format line; Taboola and Teads report company-wide; and the Health and Fitness Association measures members and visits, not media mix. Planet Fitness, the largest US gym brand, reports a combined advertising figure in its 2025 annual report without a channel split.
What can be said is narrower: demand for fitness grew, the formats around native grew at different rates, and the costs of the channels fitness brands are known to use moved. Those are the signals below.
| Budget signal | Published figure | Who publishes it | Says anything about native? |
|---|---|---|---|
| US fitness members, 2025 | 81 million (+5.2%) | HFA | No - demand only |
| Planet Fitness combined ad spend, 2025 | Over USD 360 million | Planet Fitness annual report | No channel split |
| US social ad revenue growth, 2025 | +32.6% | IAB/PwC | No - native not broken out |
| Taboola ex-TAC gross profit growth, 2025 | +6.9% | Taboola | Network-wide, all verticals |
| Fitness search CPL change | USD 62.80 to USD 67.36 | WordStream | No - search only |
Demand is at a record
HFA's 2026 consumer report finds 81 million Americans held a fitness facility membership in 2025, a 5.2% increase, with more than 100 million engaging as members or non-member users. Penetration reached 26.1% of the population aged six and older and rose across every demographic tracked, with Gen Z adults (18 to 24) highest at 35.5%. Americans made nearly 7 billion visits to gyms, health clubs and studios.
Rising demand matters for budgets because it lifts competition for the same prospects in every paid channel. It does not tell a studio which channel to fund.
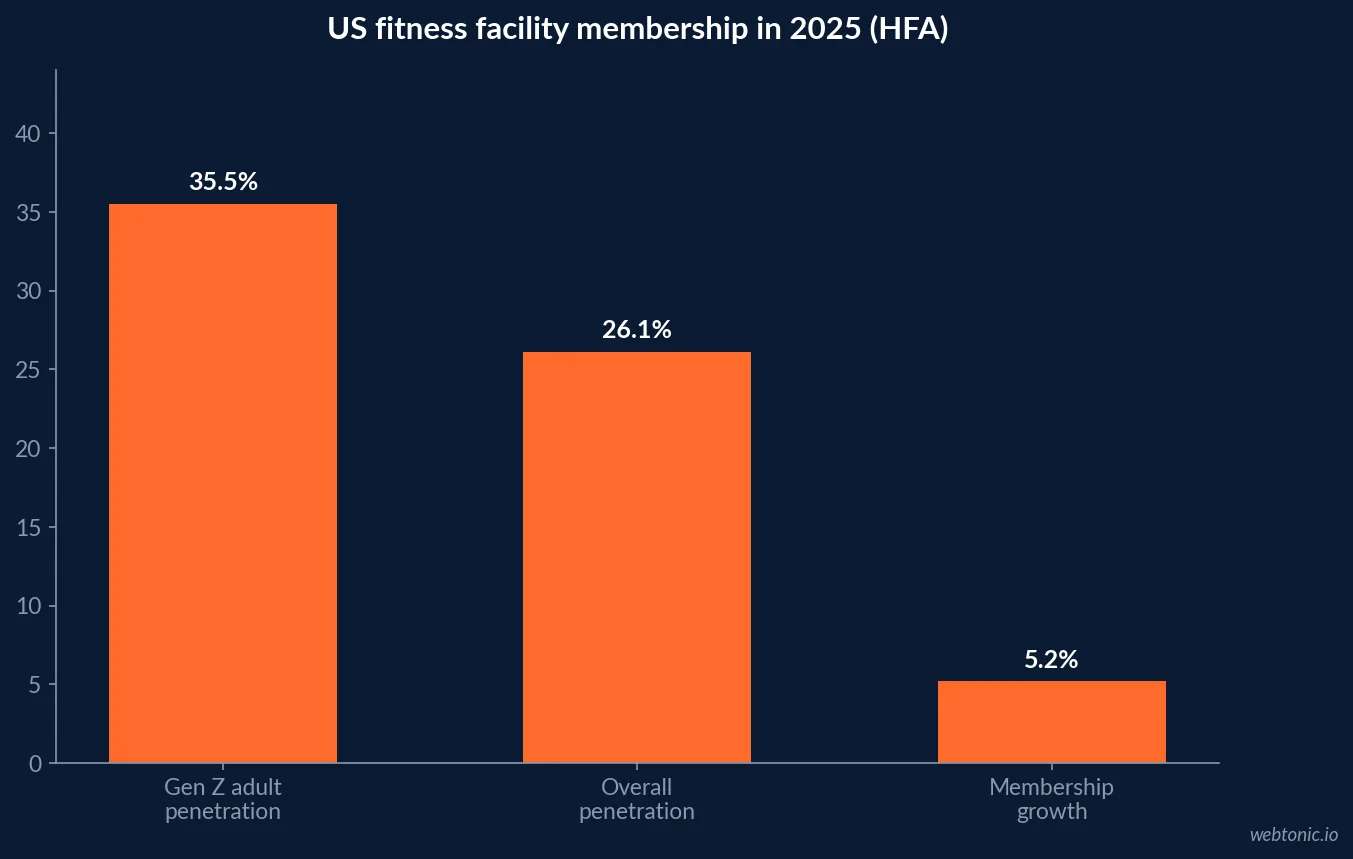
| HFA 2025 indicator | Figure |
|---|---|
| Fitness facility members | 81 million |
| Change from 2024 | +5.2% |
| Members or non-member users | More than 100 million |
| Penetration, ages six and older | 26.1% |
| Gen Z adult penetration (18-24) | 35.5% |
| Visits to gyms, clubs and studios | Nearly 7 billion |
The franchise ad fund model
Planet Fitness gives the clearest view of how a large fitness brand funds advertising. Its 2025 annual report estimates that the US national advertising fund, funded by franchisees and the company, "together with our requirement that franchisees spend 7% of their monthly membership dues on local advertising, enabled us and our franchisees to spend over $360 million combined in 2025." The brand ended the year with about 20.8 million members (up 1.1 million), 2,896 clubs and system-wide sales up 10% to USD 5.3 billion.
For a franchise studio, the practical point is that most media decisions above the local 7% sit with the national fund. A native test is a local-budget decision unless the brand runs it centrally.
Format growth around native, 2025
US internet advertising grew 13.9% to USD 294.6 billion in 2025 per IAB and PwC. Social media grew fastest of the large formats at 32.6% to USD 117.7 billion; search grew 11.0% to USD 114.2 billion. On the native networks, Taboola's 2025 results show ex-TAC gross profit up 6.9% to USD 713.5 million, while Teads' 2025 results show ex-TAC gross profit of USD 529.7 million, up 124% mainly because the Outbrain-Teads combination closed in February 2025 - a growth figure that reflects a merger, not organic demand.
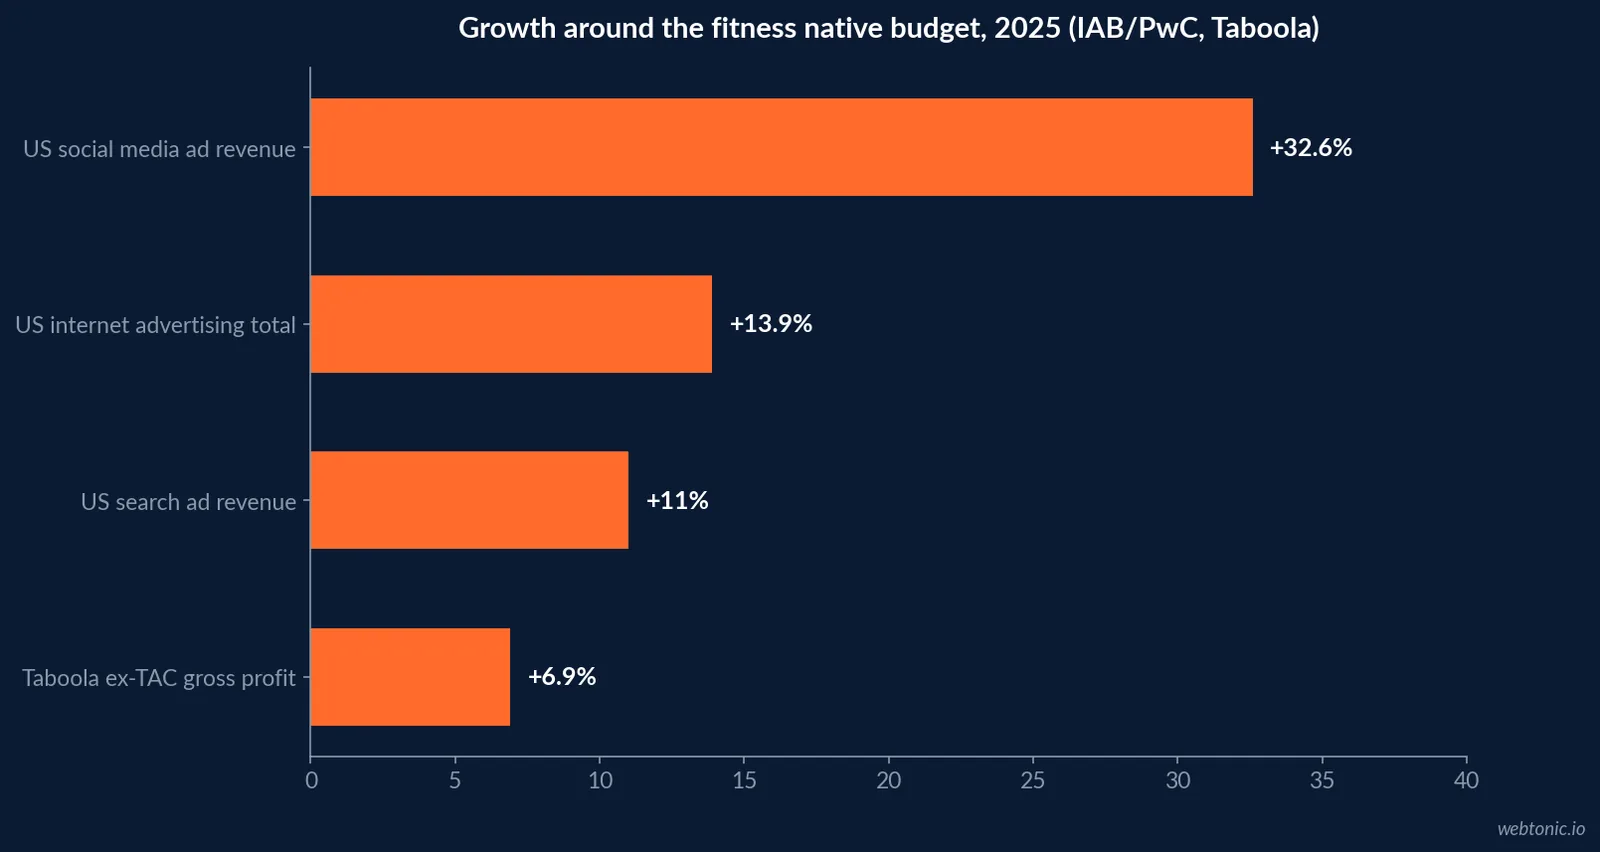
| 2025 line | Value | Growth | Caveat |
|---|---|---|---|
| US social media ad revenue | USD 117.7 billion | +32.6% | All industries |
| US search ad revenue | USD 114.2 billion | +11.0% | All industries |
| US internet advertising total | USD 294.6 billion | +13.9% | All industries |
| Taboola ex-TAC gross profit | USD 713.5 million | +6.9% | Global, all verticals |
| Teads ex-TAC gross profit | USD 529.7 million | +124% | Driven mainly by the acquisition |
Search costs for fitness moved up
Between WordStream's 2025 edition (April 2024 to March 2025) and its 2026 edition (April 2025 to March 2026), the Health and Fitness median moved from a 7.18% to a 5.81% click-through rate, from USD 5.00 to USD 6.17 per click and from USD 62.80 to USD 67.36 per lead, while conversion rose from 6.80% to 6.94%. Rising search costs are one of the published reasons a fitness marketer might look at other formats; they are not evidence that anyone did.
| Health and Fitness search median | 2025 edition | 2026 edition | Direction |
|---|---|---|---|
| Click-through rate | 7.18% | 5.81% | Down |
| Cost per click | USD 5.00 | USD 6.17 | Up |
| Conversion rate | 6.80% | 6.94% | Up slightly |
| Cost per lead | USD 62.80 | USD 67.36 | Up |
Meta as the comparator
WordStream's 2025 Facebook benchmarks put Health and Fitness lead campaigns at a 1.72% click-through rate, USD 2.64 per click, a 5.63% conversion rate and USD 52.98 per lead - the second-highest cost per lead of 15 industries. Traffic campaigns ran at a 1.63% click-through rate and USD 0.80 per click.
Against the all-industry Facebook lead medians - a 2.59% click-through rate, USD 1.92 per click and USD 27.66 per lead - fitness pays almost twice the average for a lead, and its click-through rate is lower. The traffic objective is a different story: at USD 0.80 a click it costs less than a seventh of the 2026 fitness search click at USD 6.17. That gap is the space native competes in. Native is sold mostly on clicks to content, like a Facebook traffic campaign, so the realistic comparison for a studio is cost per trial sign-up from a content click, not cost per lead from a search ad. No published source gives that figure for fitness, which is why it has to come from a studio's own test.
Our fitness Facebook ads statistics go further on that line, and fitness Google Ads statistics on search.
What a native test costs a studio
Because no fitness native benchmark exists, the useful number is the budget a test needs. Taboola's Realize help centre recommends a daily budget of 10 times the CPA goal, or at least USD 50. Google's Demand Gen guidance sets USD 100 a day as the minimum on Maximize conversions. Multiplying the 10x rule by the fitness lead costs measured elsewhere shows what full conversion optimisation would ask of a studio.
| CPA goal | Basis | Daily budget under the 10x rule | 30-day total |
|---|---|---|---|
| Below USD 5 (trial-page visit) | Network floor applies | USD 50 | USD 1,500 |
| USD 52.98 | Fitness Facebook leads median, 2025 | USD 529.80 | USD 15,894 |
| USD 67.36 | Fitness search median, 2026 | USD 673.60 | USD 20,208 |
A single studio will almost always sit in the first row, which is a learning budget rather than a performance campaign. A franchise system can fund the lead-level rows centrally, which is one reason native tests in fitness tend to belong to the brand's national fund rather than to a local owner. In either case the test needs a fixed end date and a cost-per-trial ceiling agreed before launch, because native clicks rarely get last-click credit and will look weak in a default attribution report.
What the native index shows (cross-industry)
OpenAdLibrary's State of Native Advertising report - the native-ad spy-tool vendor's own index of live placements - held 725,882 live native creatives from 29,257 advertisers across 49 networks in July 2026. Microsoft's audience network carried 281,839 and Taboola 206,145. The index does not publish a fitness vertical figure, so it cannot show fitness budgets moving; it shows how much creative a fitness ad competes with.
Disclosure for fitness creators and advertorials
Fitness marketing leans on trainers, members and creators. The Endorsement Guides at 16 CFR Part 255 make advertisers liable for failing to disclose "unexpected material connections" with endorsers - a free membership counts - and the FTC's native advertising guide requires sponsored articles to be identifiable as ads, with labels such as "Ad" or "Sponsored Advertising Content".
How to set this year's fitness budget
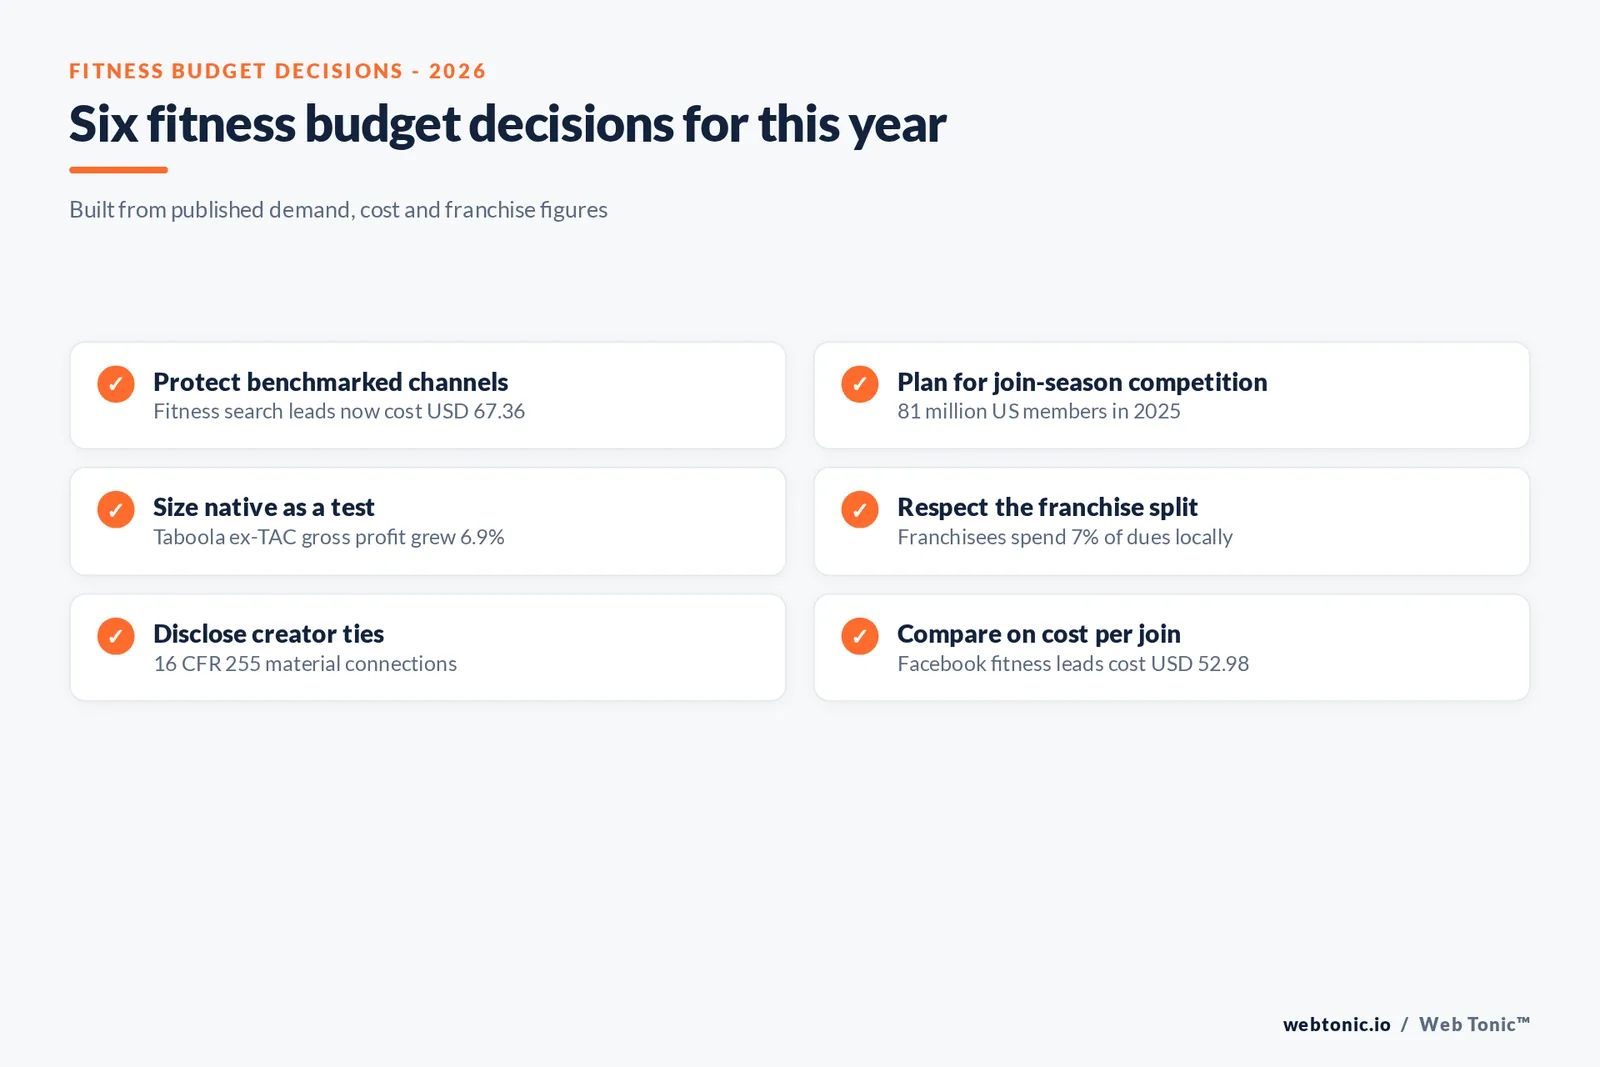
- Protect the channels with benchmarks. Search and Meta have measured fitness costs.
- Plan for January. Join-season demand lifts competition across every channel.
- Treat native as a test line. Fund it at the network's stated floor with an end date.
- Use content that fits a feed. Programme explainers, not discount banners.
- Disclose every creator tie. Free memberships are material connections.
- Measure on joins and trials. Compare cost per join, not cost per click.
For the channel overall, see our native advertising statistics.
What would settle the question
A fitness share of native spend, a fitness native cost per join, or a franchisor disclosure of digital channel mix would answer the title directly. None is published today. Until one is, read any claim that fitness budgets are "moving to native" as an opinion, and compare our fitness enterprise SEO statistics for the organic alternative.
Frequently Asked Questions
Are fitness brands moving budget into native advertising?
No published source shows it. Neither the Health and Fitness Association, IAB, Taboola nor Teads reports fitness spend on native ads. What is published is that US social ad revenue grew 32.6% in 2025, search 11.0%, and Taboola's ex-TAC gross profit 6.9% - growth rates that sit alongside fitness demand, not proof of where gyms spend.
How much do large gym brands spend on advertising?
Planet Fitness estimates that its US national advertising fund plus its requirement that franchisees spend 7% of monthly membership dues on local advertising enabled more than USD 360 million of combined spend in 2025. It does not split that by channel.
What does a fitness lead cost in search and on Meta?
WordStream's 2026 search data puts Health and Fitness at USD 6.17 a click and USD 67.36 a lead, up from USD 5.00 and USD 62.80 in the 2025 edition. Its 2025 Facebook data puts Health and Fitness lead campaigns at USD 2.64 a click and USD 52.98 a lead. There is no fitness native equivalent.
How big is US fitness demand?
The Health and Fitness Association counts a record 81 million US members in 2025, up 5.2%, equal to 26.1% of the population aged six and older, with Gen Z adults at 35.5% penetration and nearly 7 billion visits.
What rules apply to fitness influencer and advertorial content?
The FTC's Endorsement Guides at 16 CFR 255 require disclosure of material connections such as free memberships or payments, and the FTC's native advertising guidance requires sponsored articles to be identifiable as ads.
Sources
Health and Fitness Association - 2026 consumer report release
Planet Fitness - 2025 annual report
IAB/PwC - Internet Advertising Revenue Report FY2025
WordStream - Google Ads benchmarks 2026
WordStream - Google Ads benchmarks 2025
WordStream - Facebook ads benchmarks 2025
Taboola - Full year 2025 results
Teads - Full year 2025 results
OpenAdLibrary - State of native advertising 2026
eCFR - 16 CFR Part 255
FTC - Native advertising guide


