



Table of contents
A record 81 million Americans held a gym membership in 2025, but no published study benchmarks what fitness brands pay for connected TV. A January budget has to be built from demand data, viewing data and the budget floors the streaming platforms publish, and this page does exactly that.
Key Takeaways
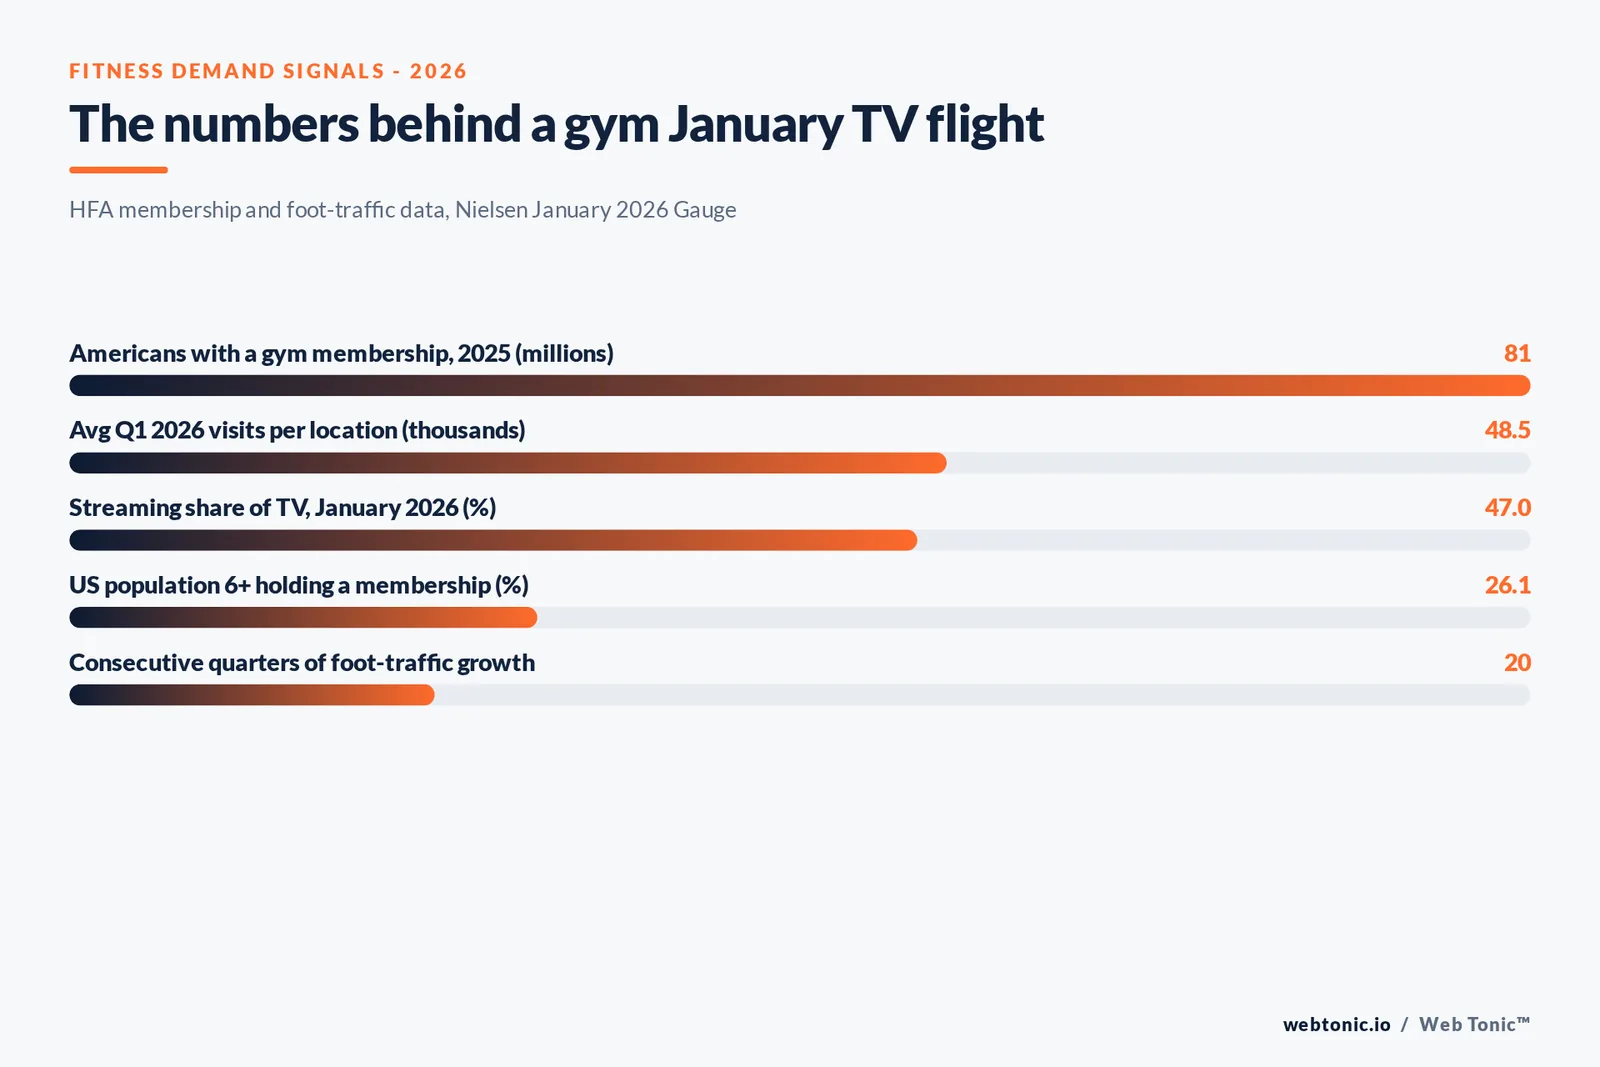
- 81 million Americans held a fitness facility membership in 2025, up 5.2% (HFA).
- 26.1% of Americans aged six and older were members.
- Gyms averaged more than 48,500 visits per location in Q1 2026, up 1.0%.
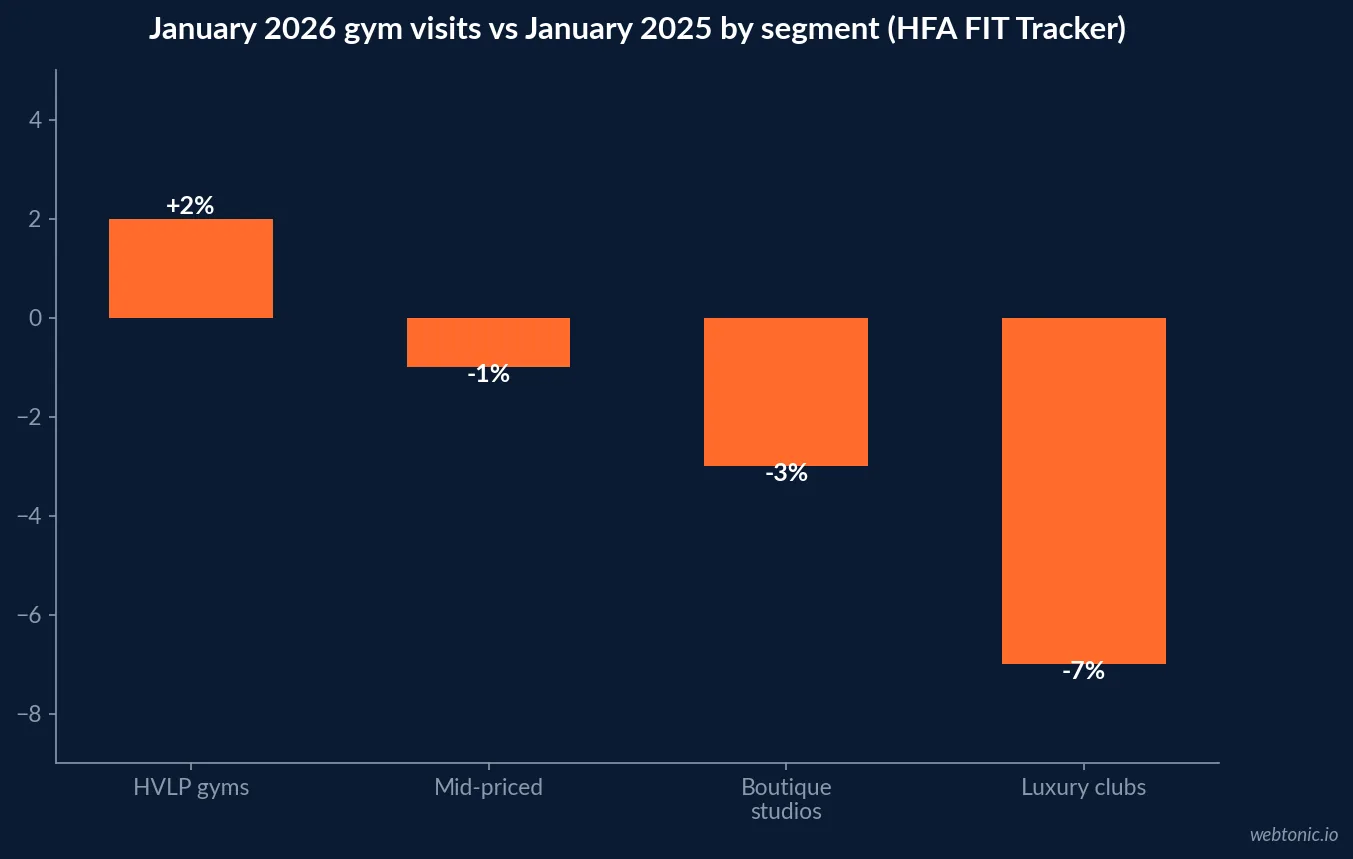
- January 2026 visits rose 2% at HVLP gyms but fell 7% at luxury clubs.
- Streaming took 47.0% of TV time in January 2026 (Nielsen).
- December 2025 set a streaming record at 47.5%.
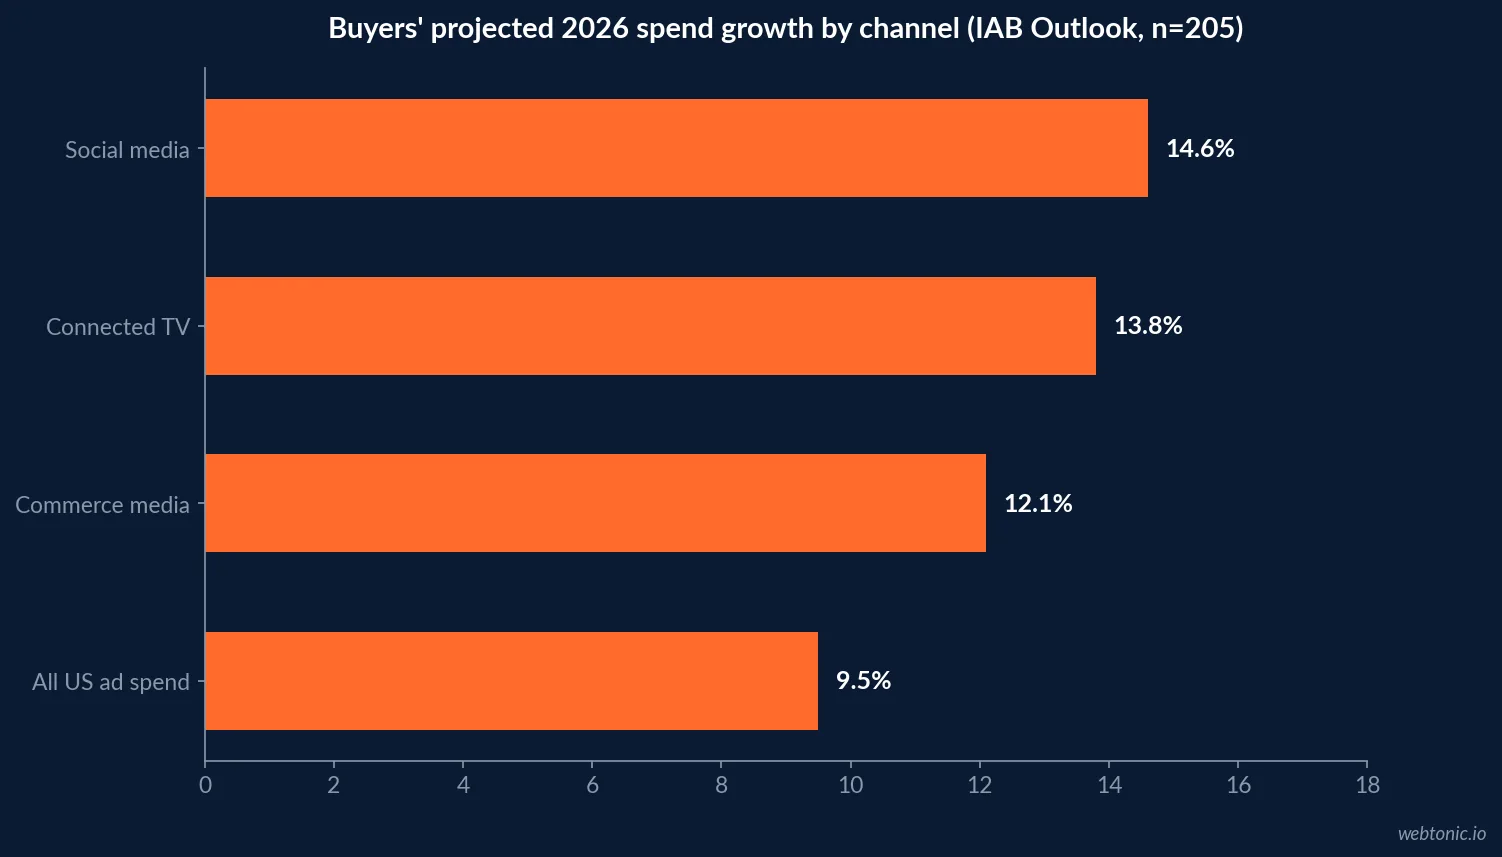
- Buyers expect CTV spend to grow 13.8% in 2026 (IAB Outlook).
- The average streaming 30-second CPM fell 16.7% in 2024 (Tatari).
- Tatari says CTV retargeting starts at USD 500 a week.
The demand a January flight is chasing
The Health & Fitness Association's 2026 US Health & Fitness Consumer Report counts 81 million members in 2025, an all-time high and a 5.2% rise on 2024, with more than 100 million people using a facility as members or non-member users. Membership penetration reached 26.1% of the population aged six and up. That is a large, already-motivated audience, and it is the pool a New Year campaign competes for.
| HFA metric | Figure | Report | Planning meaning |
|---|---|---|---|
| Fitness facility members, 2025 | 81 million | HFA 2026 Consumer Report | Record audience |
| Growth vs 2024 | +5.2% | HFA 2026 Consumer Report | Category still expanding |
| Members plus non-member users | More than 100 million | HFA 2026 Consumer Report | Day-pass users are prospects |
| Penetration, population 6+ | 26.1% | HFA 2026 Consumer Report | Most households are not members |
Is January still the month?
HFA's Q1 2026 FIT Tracker, built on anonymized foot traffic from more than 10,000 US locations, headlines a section "The January Effect Weakens as Visitation Patterns Normalize". Facilities averaged more than 48,500 visits per location in Q1, up 1.0% and the 20th straight quarter of year-over-year growth, but average monthly visits per visitor fell 1.3%. January performance split by segment.
| Segment | January 2026 YoY | February | March |
|---|---|---|---|
| High-volume, low-price gyms | +2% | Flat | Flat |
| Mid-priced facilities | -1% | -1% | -1% |
| Luxury clubs | -7% | -4% | -5% |
| Boutique studios | -3% | +2% | +3% |
The read-across for budgets: a boutique studio whose visits recovered in February and March may get more from a flight that runs past January, while an HVLP chain whose January still grew has a case for concentrating spend at the turn of the year. That is an inference from visitation, not a measured ad response.
Luxury operators face the hardest question. Their January visits fell 7% and kept falling through March, so a heavier New Year flight would be buying against a softer market rather than a surge. For them, a smaller January test paired with a spring flight is easier to justify from the data than a single large burst. Mid-priced facilities, down 1% in each month of the quarter, sit in between and have the least seasonal reason to front-load.
What viewers are doing in December and January
Nielsen's December 2025 Gauge recorded streaming's largest share of TV ever, at 47.5%, and Christmas Day reached 54% of daily TV usage. The January 2026 report showed total TV viewing at a 12-month high, with streaming time up 2.7% month on month and holding 47.0% of TV. Netflix alone took 8.8% of TV in January.
| Nielsen Gauge month | Streaming share of TV | Notable detail |
|---|---|---|
| December 2025 | 47.5% | Record share; Christmas Day at 54% |
| January 2026 | 47.0% | TV viewing at 12-month high |
| January 2026, Netflix | 8.8% of TV | Up 1% vs December |
Where ad budgets are heading in 2026
IAB's 2026 Outlook Study, a survey of 205 buyers, projects total US ad spend up 9.5% in 2026 after 5.7% in 2025, with social media at 14.6%, CTV at 13.8% and commerce media at 12.1%. IAB's later Digital Video Ad Spend report (May 2026) models CTV growth at 11%. The two differ because one is a January buyer survey and the other a spend estimate; both point the same way.
| Channel (IAB Outlook 2026) | Projected 2026 growth | Basis |
|---|---|---|
| Social media | +14.6% | Buyer survey, n=205 |
| Connected TV | +13.8% | Buyer survey, n=205 |
| Commerce media | +12.1% | Buyer survey, n=205 |
| Total US ad spend | +9.5% | Buyer survey, n=205 |
| CTV, spend model | +11% | IAB Digital Video Ad Spend report, May 2026 |
What a January flight can cost to start
The platforms publish their own floors. Roku requires a USD 500 lifetime budget per campaign. Tatari's retail playbook says CTV retargeting starts at USD 500 a week and meaningful pilots run USD 75K to 150K. MNTN markets small-business entry from USD 2,000, and Amazon recommends USD 10K for self-service streaming TV. A single-club January test and a franchise-wide New Year push sit at opposite ends of that range.
On price direction, Tatari's 2025 planning note reports the average streaming CPM for a 30-second spot fell 16.7% in 2024 as ad-supported inventory grew.
| Budget shape | Published figure | Source | Fits |
|---|---|---|---|
| One-club test | USD 500 lifetime minimum | Roku help center | Single location, one month |
| Weekly retargeting | From USD 500 a week | Tatari retail playbook | Re-engaging site visitors in January |
| Small-business flight | From USD 2,000 | MNTN | Local New Year promotion |
| Regional self-service | USD 10K recommended | Amazon Ads | Multi-club operator |
| Full TV pilot | USD 75K to 150K | Tatari retail playbook | Franchise or national brand |
Linear or streaming for a New Year push
Many gym chains still buy local broadcast in January, so the price gap matters. Tatari's analysis of its own client data from 2019 to 2023 found streaming CPMs typically three to four times higher than linear, about USD 9.50 against USD 2.50, and notes its streaming rates already sit below programmatic market rates. The same playbook argues linear and streaming work better together than either alone, which is a vendor claim rather than an independent test.
For a fitness brand the trade-off is geography. A linear spot reaches the whole market, including households far from any club, while a streaming buy can be restricted to the ZIP codes within a realistic drive of a location. A chain with dense club coverage in one metro may find broadcast efficient; a single boutique studio almost never will. None of the public data measures that trade-off for gyms, so treat it as a planning question to answer with a test.
| Cost reference | Figure | Scope | How to use it |
|---|---|---|---|
| Streaming CPM, Tatari clients 2019-2023 | About USD 9.50 | Cross-industry, one buyer | Upper-bound sense check |
| Linear CPM, Tatari clients 2019-2023 | About USD 2.50 | Cross-industry, one buyer | Market-wide reach cost |
| Streaming 30-second CPM change, 2024 | -16.7% | Tatari 2025 planning note | Prices eased as inventory grew |
| Roku pricing | Dynamic CPM with optional max bid | Platform help page | Cap cost in holiday auctions |
Protecting the budget from invalid traffic
The January auction is crowded, and some of the impressions sold are not seen by people. Pixalate's Q4 2025 CTV supply chain report measured 21% invalid traffic across global open programmatic CTV in the holiday quarter, with Amazon Fire TV lowest at 14% and Samsung Smart TV highest at 28%. Pixalate is a fraud-detection vendor and the figures cover open programmatic supply only. Ask any platform for delivery by app and device, prefer direct or curated inventory for the core of a New Year flight, and keep a holdout set of ZIP codes so the lift you report is not inflated by impressions that never reached a screen.
Creative rules for transformation ads
Fitness TV creative often leans on member results. The FTC's Endorsement Guides, 16 CFR 255, require endorsements to reflect the endorser's honest experience and a clear disclosure of typical results when a testimonial shows results most customers will not get. On a TV screen that means an on-screen disclosure long enough to read, not a fine-print flash at the end.
What no dataset tells you
We found no verified public benchmark for fitness CTV completion rates, cost per membership sale or return on ad spend. Vendor case studies exist but rarely disclose sample or method. The evidence supports a narrower plan: the audience is at a record size, January still matters but less uniformly than it used to, streaming holds nearly half of TV time in the winter months and entry budgets start in the hundreds of dollars. It also shows that CTV prices eased in 2024 even as buyer budgets for the channel keep growing, so the cost of a January impression is set by competition in your own market, not by a national average.
It also cannot tell you whether a January viewer who joins stays. HFA's own data shows visits per visitor slipping 1.3% in Q1 2026, which is a reminder that the cost of a TV-acquired member should be judged over the months they keep paying, not the week they sign up. Track joins by ZIP code, by offer and by segment, and compare exposed areas against similar unexposed ones before scaling a second flight.
A January planning checklist
- Decide whether your segment's demand peaks in January or recovers later in Q1.
- Book the flight to start in late December, when streaming share is at its seasonal high.
- Start at a published floor and set a maximum CPM so crowded holiday auctions cannot drain the test.
- Run retargeting to site visitors alongside prospecting in club ZIP codes.
- Add typical-results disclosures to any transformation creative.
- Measure joins and retention by exposed and unexposed ZIP code before scaling.
Related reading: our streaming media statistics, the fitness SMS marketing data for keeping January joiners engaged, and the advertising statistics roundup. Our growth marketing team plans seasonal media across channels.
Frequently Asked Questions
How much should a gym budget for a January CTV campaign?
No published benchmark sets a fitness CTV budget. Platform floors frame it: Roku requires a USD 500 lifetime budget, Tatari says CTV retargeting starts at USD 500 a week and cites meaningful pilots at USD 75K to 150K, MNTN markets entry from USD 2,000, and Amazon recommends USD 10K for self-service streaming TV.
Is January still the peak month for gyms?
It is still a demand window, but the Health & Fitness Association's Q1 2026 FIT Tracker describes the January effect as weakening: high-volume, low-price gyms grew visits 2% year on year in January while luxury clubs fell 7% and boutique studios 3%. Plan the flight by segment, not by calendar habit alone.
How many people watch streaming TV in January?
Nielsen's January 2026 Gauge put streaming at 47.0% of US TV time, after a record 47.5% in December 2025. Nielsen measures viewing across all US TV households, not gym prospects specifically.
Are CTV prices lower or higher than they were?
Tatari reports the average streaming CPM for a 30-second spot fell 16.7% in 2024, as more ad-supported inventory came to market. IAB's 2026 Outlook buyer survey expects CTV spend to grow 13.8% in 2026, so demand for inventory is still rising.
Can a gym show member transformation results in a TV ad?
Yes, with disclosure. The FTC's Endorsement Guides (16 CFR 255) require a clear disclosure of typical results when a testimonial shows results most customers will not achieve, and endorsements must reflect the endorser's honest experience.
Sources
HFA - 2026 US Health and Fitness Consumer Report
HFA - US Fitness Industry Traffic Tracker Q1 2026
Nielsen - December 2025 The Gauge
Nielsen - January 2026 The Gauge
IAB - 2026 Outlook Study
IAB - 2026 Digital Video Ad Spend report
Roku - Campaign budget and schedule
Tatari - How retail brands launch and scale TV
Tatari - How to plan and budget for TV in 2025
Tatari - Linear vs streaming CPMs
Pixalate - Q4 2025 CTV supply chain trends
MNTN - Go Big small business program
Amazon Ads - Streaming TV ads
eCFR - 16 CFR Part 255


