



Table of contents

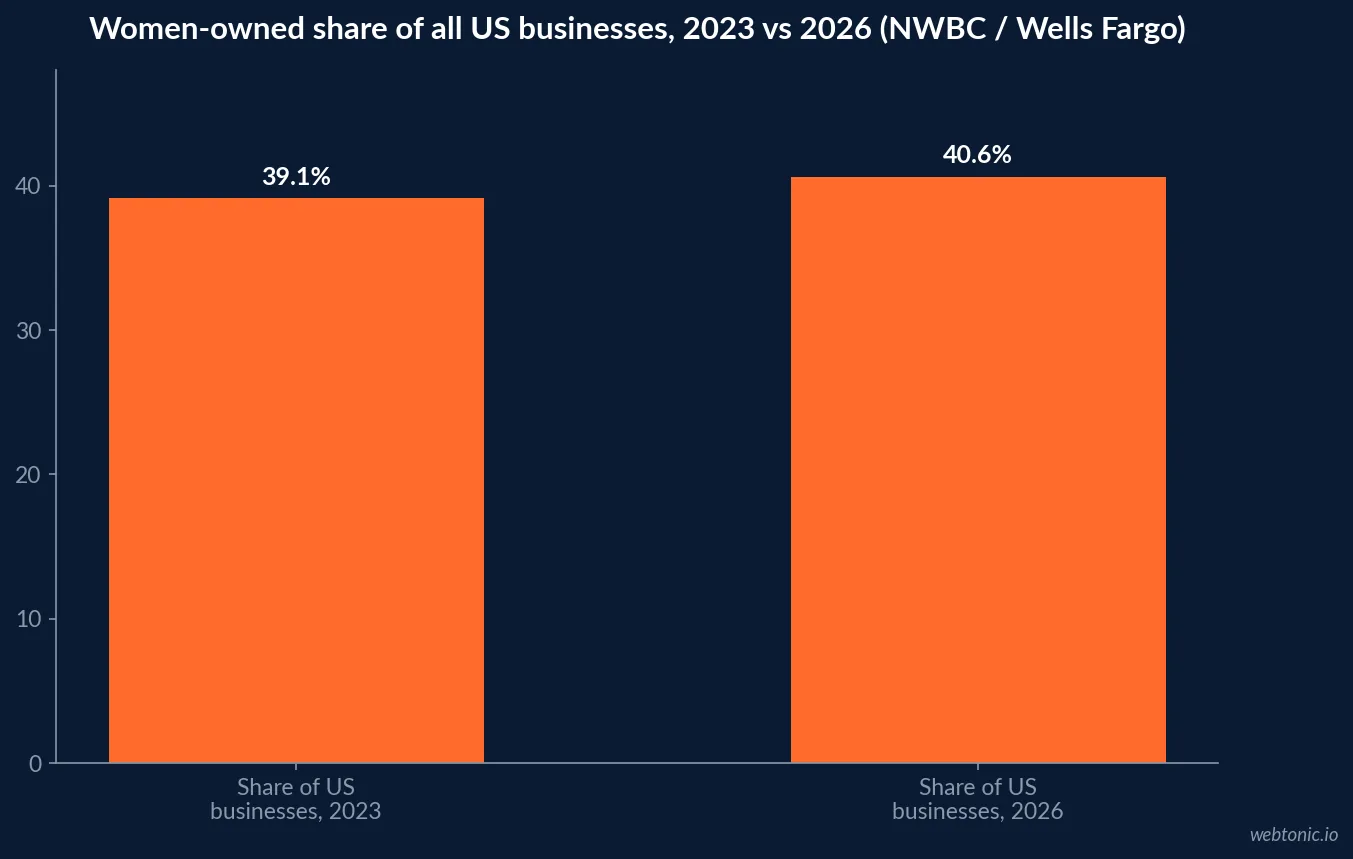
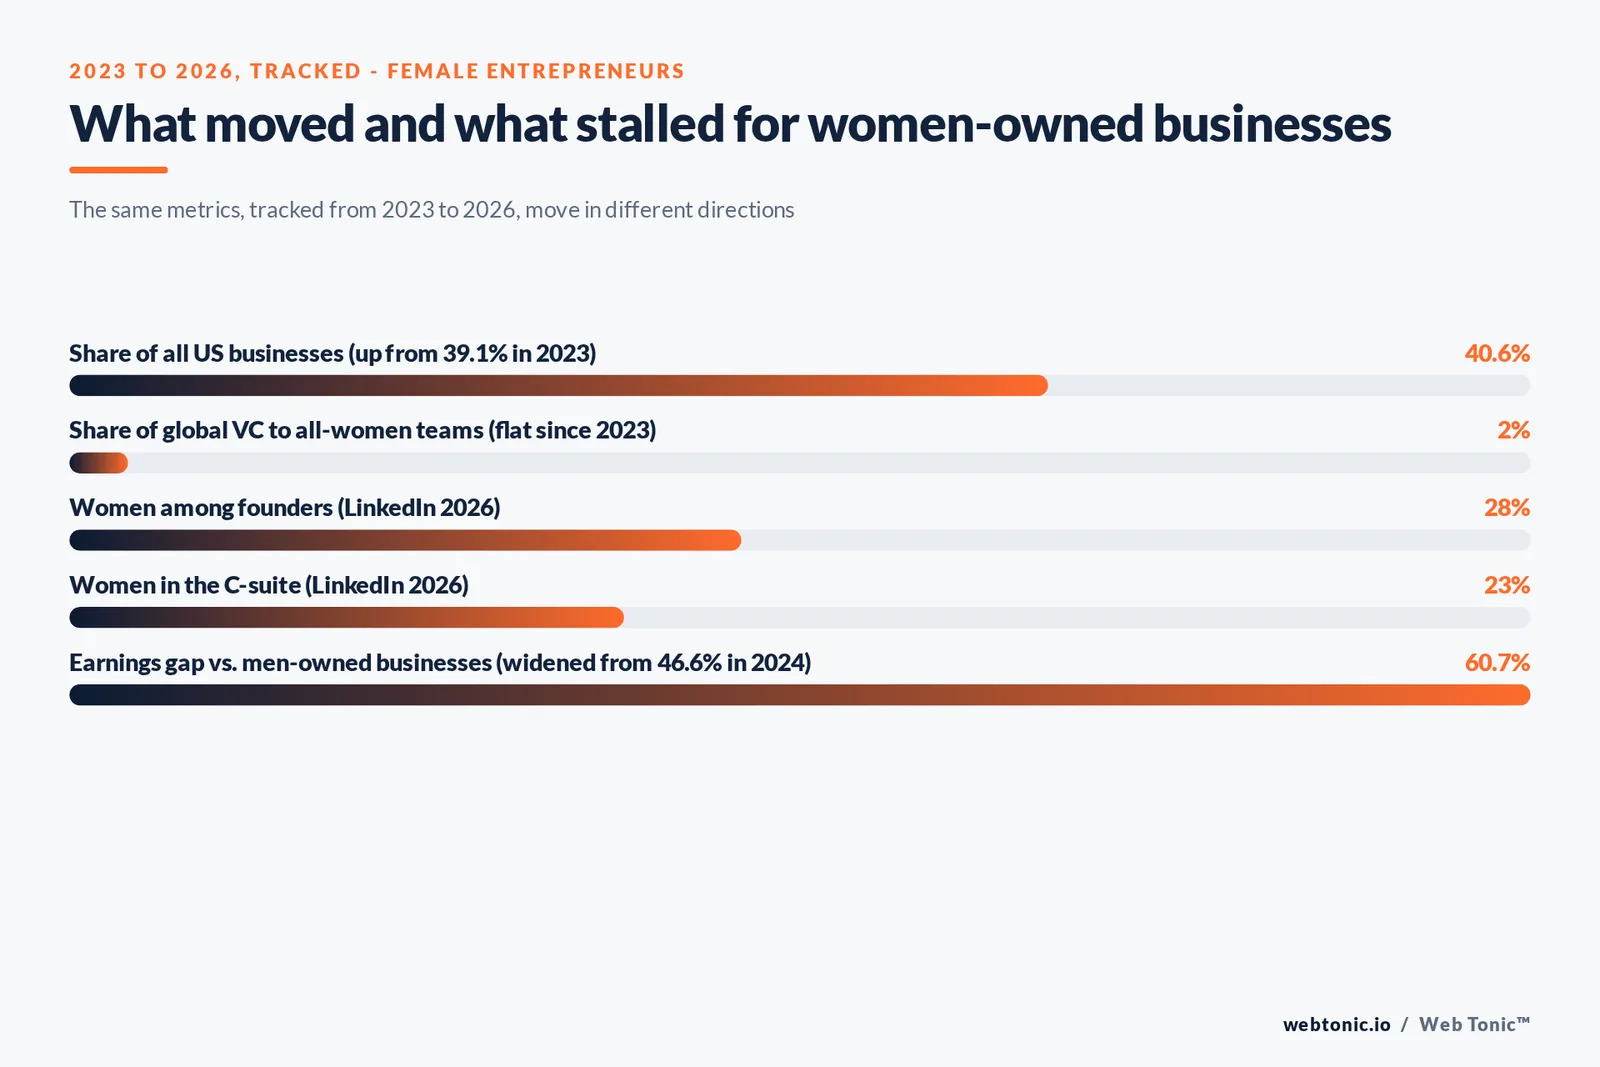
Women now own 15.7 million US businesses - 40.6% of all US businesses - up from 14 million and 39.1% in 2023, but the venture capital share going to all-women founding teams sat at just 2% in both years. This page tracks the same handful of metrics across 2023 and 2026 to show which parts of the picture actually moved and which stalled.
Key Takeaways
- Women-owned businesses grew from 14 million (2023) to 15.7 million (2026) (NWBC / Wells Fargo).
- Share of all US businesses rose from 39.1% to 40.6% in the same period.
- Women-owned businesses now employ 12.6 million people (Wells Fargo 2026).
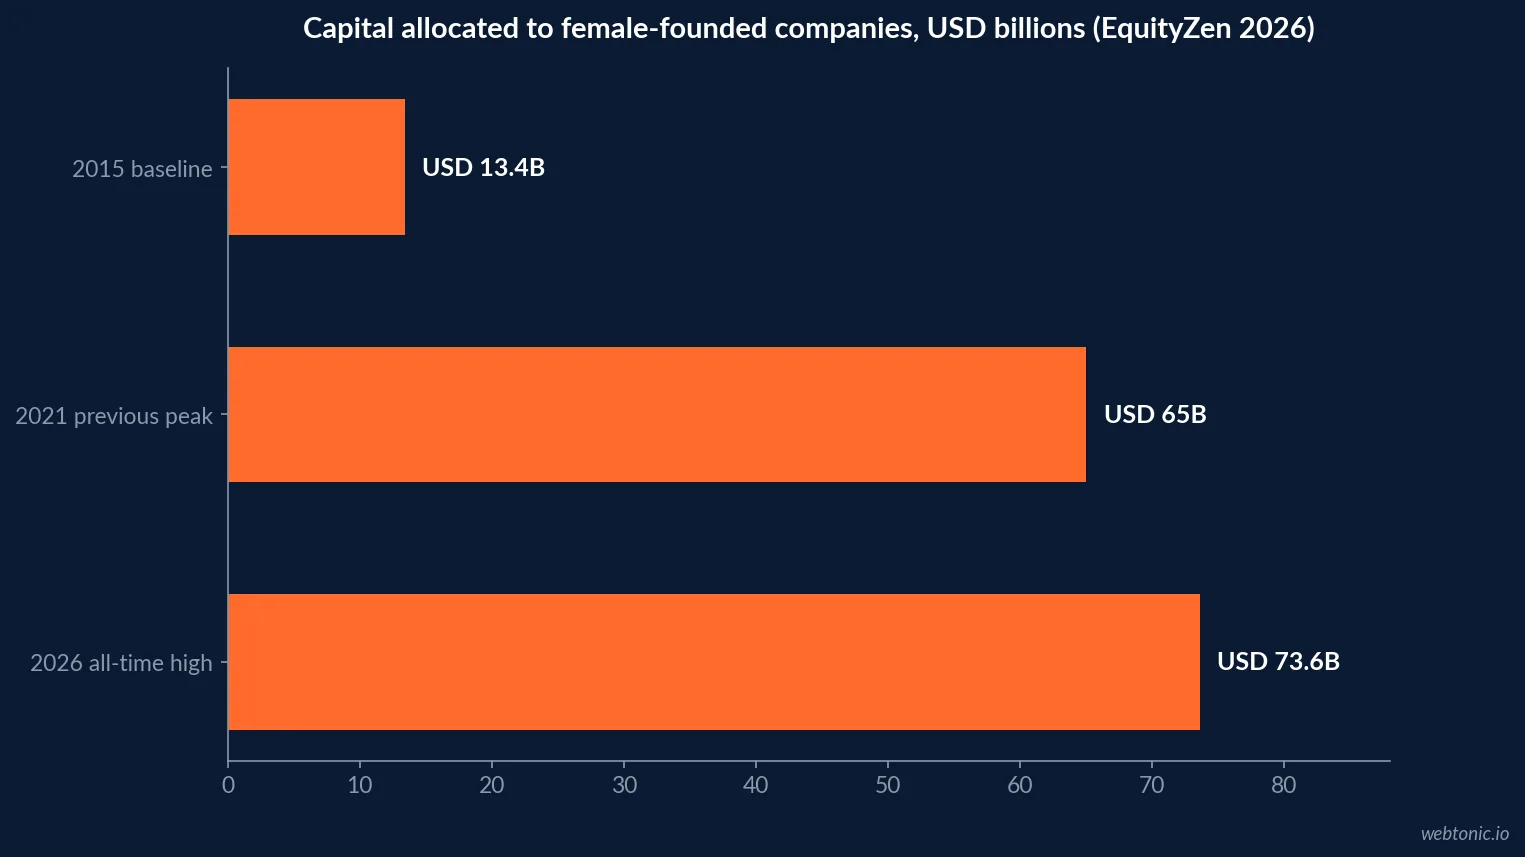
- VC capital to female-founded companies hit an all-time high of USD 73.6 billion (EquityZen 2026).
- That is up from roughly USD 65 billion at the 2021 peak, a 5.5x increase from 2015.
- All-women founding teams still received just 2% of global VC in 2025 (LinkedIn 2026).
- Average earnings for women-owned businesses fell 38.0% to USD 10,855 (Biz2Credit 2026).
- The earnings gap versus men-owned businesses widened from 46.6% to 60.7% in one year.
- Women make up 28% of founders and 23% of the C-suite (LinkedIn 2026).
- Women hold 31% of top management roles in venture capital and private equity (LinkedIn 2026).
- Employer firms owned by women reached 1,356,990, up 19.6% from 2017 (Axis Intelligence / Census).
- Women launched nearly half of all new US businesses started in recent data (Gusto, cited by Nav).
- Female-founded companies deliver 2.5x better returns per dollar invested in some comparisons.
- The top five female-founded startups accounted for 79% of all-female VC dollars in one 2026 review.
- Some states average over USD 2 million a year in revenue per women-owned business (Nav 2026).
Ownership and business count: a real, steady gain
This is the part of the picture that moved cleanly in the right direction. The U.S. Census Bureau's 2023 data and the National Women's Business Council's 2023 Annual Report counted 14 million women-owned businesses, representing 39.1% of all US businesses - a 13.6% increase from 2019 to 2023. By 2026, Wells Fargo's Impact of Women-Owned Businesses report puts the count at 15.7 million businesses, 40.6% of all US businesses, employing 12.6 million people.
That is roughly 1.7 million more businesses and 1.5 percentage points of overall share gained in about three years - a real, if incremental, shift rather than a plateau.
| Metric | 2023 | 2026 | Source |
|---|---|---|---|
| Number of women-owned US businesses | 14 million | 15.7 million | NWBC 2023 / Wells Fargo 2026 |
| Share of all US businesses | 39.1% | 40.6% | NWBC 2023 / Wells Fargo 2026 |
| Growth in businesses, 2019-2023 baseline | +13.6% | - | NWBC 2023 Annual Report |
| People employed by women-owned businesses | - | 12.6 million | Wells Fargo 2026 |
| Women-owned employer firms | 1,134,000 (2017 baseline cited) | 1,356,990, up 19.6% | Axis Intelligence / Census |
Venture funding: a record total that hides a flat share
Here the headline number and the real trend point in different directions. EquityZen's 2026 State of Female Founders report finds capital allocated to female-founded companies reached an all-time high of USD 73.6 billion, surpassing the 2021 peak of roughly USD 65 billion and representing a 5.5x increase from 2015 levels.
But that dollar growth tracks the overall VC market growing, not women's share of it improving. LinkedIn's 2026 workforce data reports just 2% of global venture capital went to founding teams made up entirely of women in 2025 - essentially unchanged from the 2% reported for 2023 in other PitchBook-based tallies. The all-time-high total and the flat share can both be true at once, and reporting only the dollar figure without the share hides the part of the story that has not moved.
| VC funding metric | 2023 (or nearest year) | 2025-2026 | Source |
|---|---|---|---|
| Capital allocated to female-founded companies | ~USD 65B (2021 peak, prior high) | USD 73.6B, all-time high | EquityZen 2026 |
| Share of global VC to all-women founding teams | ~2% | 2% | LinkedIn 2026 |
| Women in the C-suite | - | 23% | LinkedIn 2026 |
| Women among founders | - | 28% | LinkedIn 2026 |
| Women in VC/PE top management roles | - | 31% | LinkedIn 2026 |
Earnings: the metric that moved backward
Biz2Credit's 2026 Annual Women-Owned Business Study is the clearest evidence that ownership growth has not translated evenly into financial outcomes. Average earnings for women-owned businesses fell 38.0% to USD 10,855, and the earnings gap versus men-owned businesses widened from 46.6% in 2024 to 60.7% in 2025 - a one-year move in the wrong direction. The study ties this to rising costs of goods and wages hitting smaller, less-capitalized businesses harder, a category where women-owned firms are still overrepresented relative to their share of overall business count.
This is the number that should temper any narrative built purely on the ownership-count growth above: more businesses does not automatically mean more resilient businesses.
| Earnings metric | 2024 | 2025 | Source |
|---|---|---|---|
| Average earnings, women-owned business | Higher baseline | USD 10,855, down 38.0% | Biz2Credit 2026 |
| Earnings gap vs. men-owned businesses | 46.6% | 60.7% | Biz2Credit 2026 |
| Direction of change | - | Widening | Biz2Credit 2026 |
Where women-owned businesses are performing best
The state-level picture, drawn from Nav's 2026 analysis, shows real upside at the top end: the highest-performing state for women-owned business revenue averages over USD 2.5 million a year, with six states in total averaging more than USD 2 million. That spread matters for the earnings-gap number above - a national average of USD 10,855 blends a large base of small, newly formed businesses with a smaller cohort performing at a very different scale, and the state data is where that split becomes visible.
| 2026 state revenue data (Nav) | Average annual revenue |
|---|---|
| Highest-performing state | USD 2,554,521 |
| Second | USD 2,362,058 |
| Third | USD 2,321,355 |
| Fourth | USD 2,169,273 |
| Fifth | USD 2,132,053 |
How the US trend compares internationally
The US pattern - steady ownership gains, stalled funding share - shows up abroad too, with some encouraging exceptions. The Women Entrepreneurs in Europe report finds the number of women entrepreneurs in the EU-27 grew from 6.2 million in 2013 to 9.0 million in 2023, a 45.2% increase, compared with a smaller rise for men entrepreneurs over the same period (from 11.0 million to 13.0 million). The UK's 2026 Gender Index Report goes further on the growth side: female-led companies grew revenue by an average of 22.1% in 2025, ahead of both male-led companies at 18.0% and mixed-led companies at 17.8%.
But the same report flags the ceiling that shows up in the US venture data too: female-led companies remain under-represented among high-growth companies, making up only 13.2% of that group despite outgrowing male-led firms on average revenue growth. Faster average growth and a thin slice of the highest-growth tier can both be true - it is the same pattern as a record VC dollar total sitting on a flat funding share.
| International 2026 comparison point | Figure | Source |
|---|---|---|
| EU-27 women entrepreneurs, 2013 to 2023 | 6.2M to 9.0M, +45.2% | Women Entrepreneurs in Europe report |
| EU-27 men entrepreneurs, same period | 11.0M to 13.0M | Women Entrepreneurs in Europe report |
| UK female-led company revenue growth, 2025 | 22.1% | The Gender Index Report 2026 |
| UK male-led company revenue growth, 2025 | 18.0% | The Gender Index Report 2026 |
| UK female-led share of high-growth companies | 13.2% | The Gender Index Report 2026 |
What the 2023-2026 comparison actually recommends
- Stop treating "more women starting businesses" as the open problem. That metric moved from 39.1% to 40.6% of all US businesses without a targeted campaign - it is already improving on its own.
- Treat venture capital share as the stalled variable. A flat 2% share across both 2023 and 2025-2026, even as total dollars hit a record, is the number that needs the targeted intervention.
- Watch earnings, not just ownership counts. A 38.0% drop in average earnings in a single year is a bigger red flag than the multi-year ownership trend is a green one.
- Segment by business scale before drawing conclusions. The gap between a USD 10,855 national average and a USD 2.5 million top-state average shows why single national figures flatten a story that is really about access to growth capital past the first few years.
- Track leadership pipeline alongside founding rates. With women at just 31% of top management in VC and PE, the people deciding which founders get funded are still not representative of the founders themselves.
Marketing to and for women-led businesses
Brands and agencies serving this audience need positioning that reflects the real 2023-2026 data, not a flattened "on the rise" narrative that ignores the funding and earnings gaps above. Our growth marketing practice builds campaigns from verified benchmarks like these rather than a single favorable statistic, and our guide to building a paid search strategy that survives scrutiny applies the same evidence-first approach. Talk to us if you are building a campaign around this audience.
Frequently Asked Questions
Has the number of women-owned businesses actually grown since 2023?
Yes, and the pace is not small. The National Women's Business Council's 2023 Annual Report counted 14 million women-owned businesses at 39.1% of all US businesses, a 13.6% increase from 2019 to 2023. Wells Fargo's 2026 Impact of Women-Owned Businesses report puts the count at 15.7 million businesses, 40.6% of all US businesses, employing 12.6 million people. That is roughly 1.7 million more businesses and 1.5 percentage points of share gained in about three years.
Did venture capital funding for women improve between 2023 and 2026?
In total dollars, yes; in share of the market, no. EquityZen's 2026 State of Female Founders report finds capital allocated to female-founded companies reached an all-time high of USD 73.6 billion, surpassing the 2021 peak of roughly USD 65 billion. But LinkedIn's 2026 data shows just 2% of global venture capital went to all-women founding teams in 2025, down from 2% in 2023 per other PitchBook-based estimates - meaning the dollar total grew mostly because overall VC volume grew, not because women's share of it did.
What happened to earnings for women-owned businesses?
They fell, and the gap widened. Biz2Credit's 2026 Annual Women-Owned Business Study found average earnings for women-owned businesses dropped 38.0% to USD 10,855, with the earnings gap versus men-owned businesses widening from 46.6% in 2024 to 60.7% in 2025. The Federal Reserve data the study draws on ties this to rising costs of goods and wages hitting smaller, less-capitalized businesses harder - a category where women-owned firms are still overrepresented.
Are women better represented in leadership and founding roles now than in 2023?
Slightly, at the founder level; barely, in the C-suite. LinkedIn's 2026 workforce data finds women make up 28% of founders, up from prior years, but just 23% of the C-suite - a gap that has narrowed only slowly. Women hold 31% of top management roles in capital-markets activities like venture capital and private equity, against 40% in some other functions, which matters because those are the roles that decide which founders get funded.
What does the 2023-2026 data actually recommend for closing the gap?
Fund allocation and access to capital, not ownership counts, are the stalled variable. Ownership share, revenue and business counts have all moved in the right direction since 2023. Venture funding share and average earnings have not. Programs and marketing spend aimed narrowly at 'more women starting businesses' are targeting a metric that is already improving; the money is not reaching the businesses once they exist.
Sources
Wells Fargo - 2026 Impact of Women-Owned Businesses Report
U.S. Census Bureau - Women's History Month 2023: Women-Owned Employer Businesses
EquityZen - The State of Female Founders in 2026
LinkedIn - 2026 Data on Women in the C-Suite and Among Founders
Biz2Credit - 2026 Annual Women-Owned Business Study
Nav - Women-Owned Business Statistics: The Best States in 2026
Women's Entrepreneurship Institute - 2026 Wells Fargo Impact of Women-Owned Businesses Report
Women Entrepreneurs in Europe report
The Gender Index Report 2026


