Table of contents
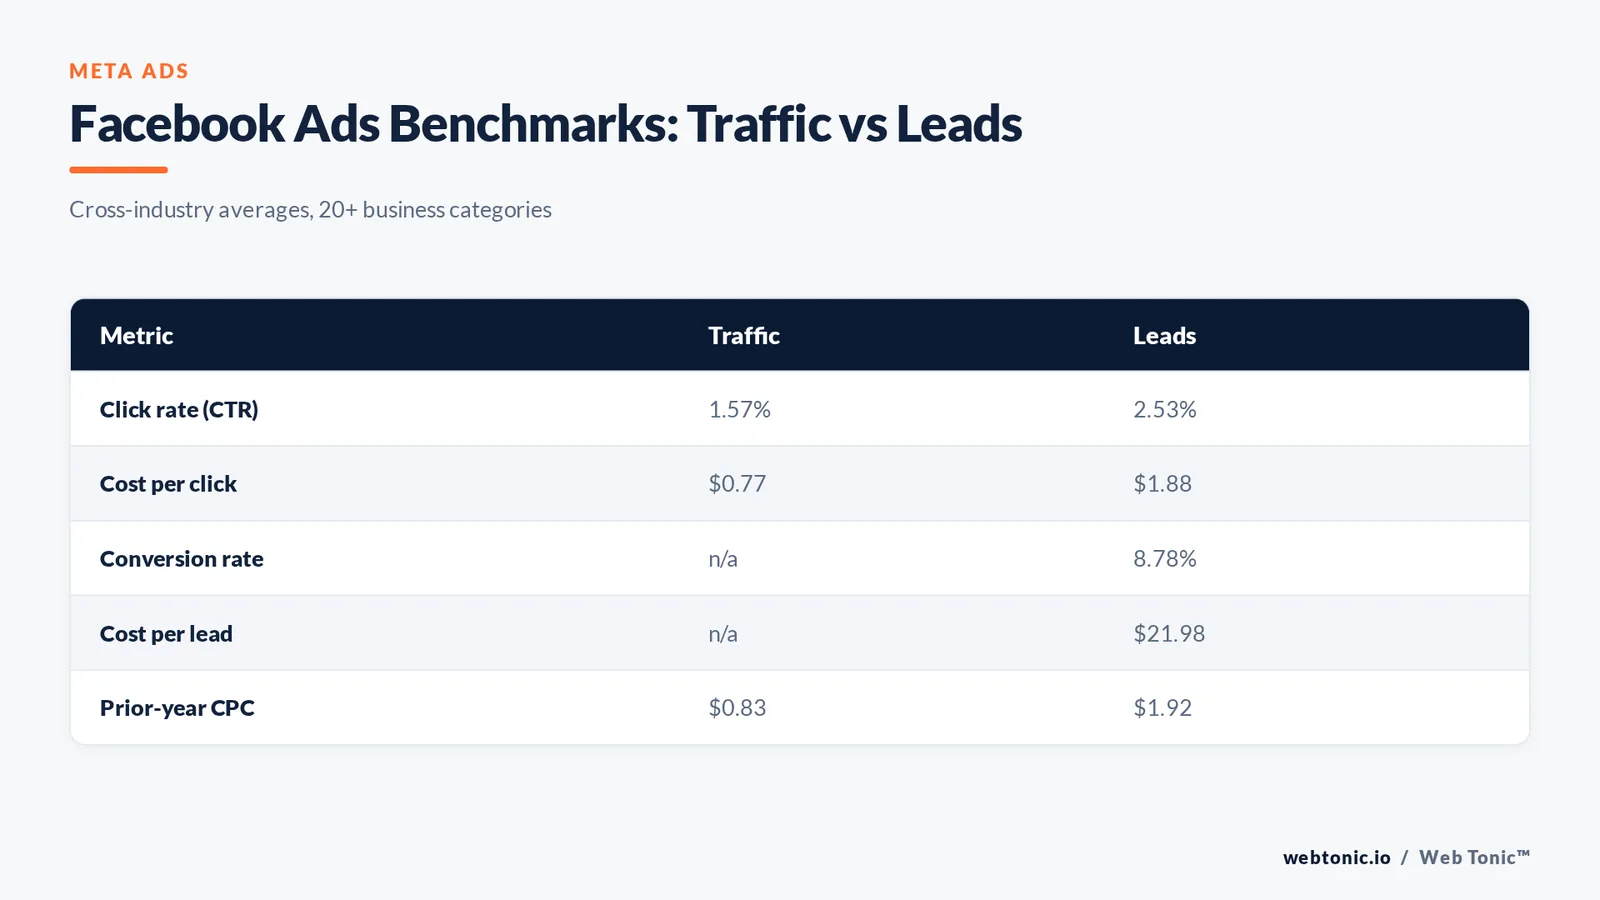
Facebook ads averaged a 1.57% click rate and $0.77 cost per click on traffic campaigns, and $21.98 cost per lead at an 8.78% conversion rate on lead campaigns, across 20-plus industries. Your industry number is what matters, so start with the tables below.
Key Takeaways
- Average Facebook ads CTR for traffic campaigns is 1.57%, up from 1.51% the prior year.
- Average cost per click for traffic campaigns is $0.77, down from $0.83.
- Lead campaigns average 2.53% CTR, $1.88 CPC, 8.78% CVR and $21.98 CPL.
- Facebook lead-ad CPC of $1.88 is roughly 2.5x cheaper than the $4.66 Google Ads equivalent.
- Industry spread is enormous: legal services pay $104.58 per lead while real estate pays $13.87.
- CTR rose or held for 15 of 23 industries, and CPC rose for 12 of 15 lead-gen industries.
Facebook ads benchmarks 2026: the five headline numbers
Two datasets matter when you benchmark Meta ads performance: traffic campaigns, where the optimisation event is a link click, and lead campaigns, where it is a form fill. Mixing them is the single most common benchmarking error we see in audits. The averages below come from the WordStream Facebook ads benchmarks study of more than 20 business categories, last refreshed in September 2025.
| Metric | Traffic campaigns | Leads campaigns | Prior year | Direction |
|---|---|---|---|---|
| Average click rate (CTR) | 1.57% | 2.53% | 1.51% / 2.50% | Improving |
| Average cost per click (CPC) | $0.77 | $1.88 | $0.83 / $1.92 | Cheaper |
| Average conversion rate (CVR) | Not reported | 8.78% | 8.25% | Improving |
| Average cost per lead (CPL) | Not applicable | $21.98 | $23.10 | Cheaper |
| Google Ads lead CPC for reference | $5.42 | $4.66 | - | Higher than Meta |
Read that table as a floor, not a target. An account at $0.77 CPC and 1.57% CTR is merely average, and average Facebook ads performance rarely clears a paid-social payback threshold on its own. Our performance creative team treats these figures as the line a new account must beat inside 60 days.
Average cost per click and click rate by industry: traffic campaigns
This is the dataset to use if your Facebook ads campaigns optimise for landing page views or link clicks. Travel is the cheapest traffic audience at $0.42 CPC, and real estate posts the highest CTR at 2.60%.
| Industry | Avg CPC | Avg CTR | Read |
|---|---|---|---|
| Animals & Pets | $0.58 | 1.87% | Cheap clicks, strong engagement |
| Apparel, Fashion & Jewelry | $1.07 | 1.14% | Creative-led, competitive auction |
| Arts & Entertainment | $0.43 | 2.59% | Best combined economics in the set |
| Attorneys & Legal Services | $1.09 | 0.99% | High intent, low click appetite |
| Automotive - For Sale | $0.79 | 1.02% | Long consideration cycle |
| Automotive - Repair & Parts | $0.96 | 1.10% | Local radius drives cost |
| Beauty & Personal Care | $0.94 | 1.51% | Video and creator formats win |
| Business Services | $0.84 | 1.16% | B2B on a consumer feed |
| Career & Employment | $0.67 | 1.41% | Special ad category limits targeting |
| Dentists & Dental Services | $1.07 | 0.88% | Lowest CTR in the dataset |
| Education & Instruction | $0.77 | 1.21% | Seasonal demand swings |
| Finance & Insurance | $1.05 | 0.85% | Restricted category, costly clicks |
| Furniture | $1.06 | 1.21% | Catalogue ads carry the category |
| Health & Fitness | $0.81 | 1.61% | High volume, high fatigue |
| Home & Home Improvement | $0.88 | 1.26% | Service-area targeting matters |
| Industrial & Commercial | $0.77 | 0.99% | Small audiences, narrow reach |
| Personal Services | $0.81 | 1.37% | Weddings, cleaning, local trades |
| Physicians & Surgeons | $0.96 | 1.07% | Compliance limits ad copy |
| Real Estate | $0.65 | 2.60% | Highest CTR of all industries |
| Restaurants & Food | $0.51 | 2.19% | Cheap reach, offer-driven |
| Shopping, Collectibles & Gifts | $0.68 | 1.67% | Gifting seasonality |
| Sports & Recreation | $0.72 | 1.27% | Community-led audiences |
| Travel | $0.42 | 2.20% | Cheapest cost per click at $0.42 |
Note the pattern: the six industries above a 1.6% CTR also sit under $0.85 CPC. On Meta, a click rate problem is usually a cost problem, because relevance feeds directly back into auction pricing.
Facebook lead ads benchmarks by industry
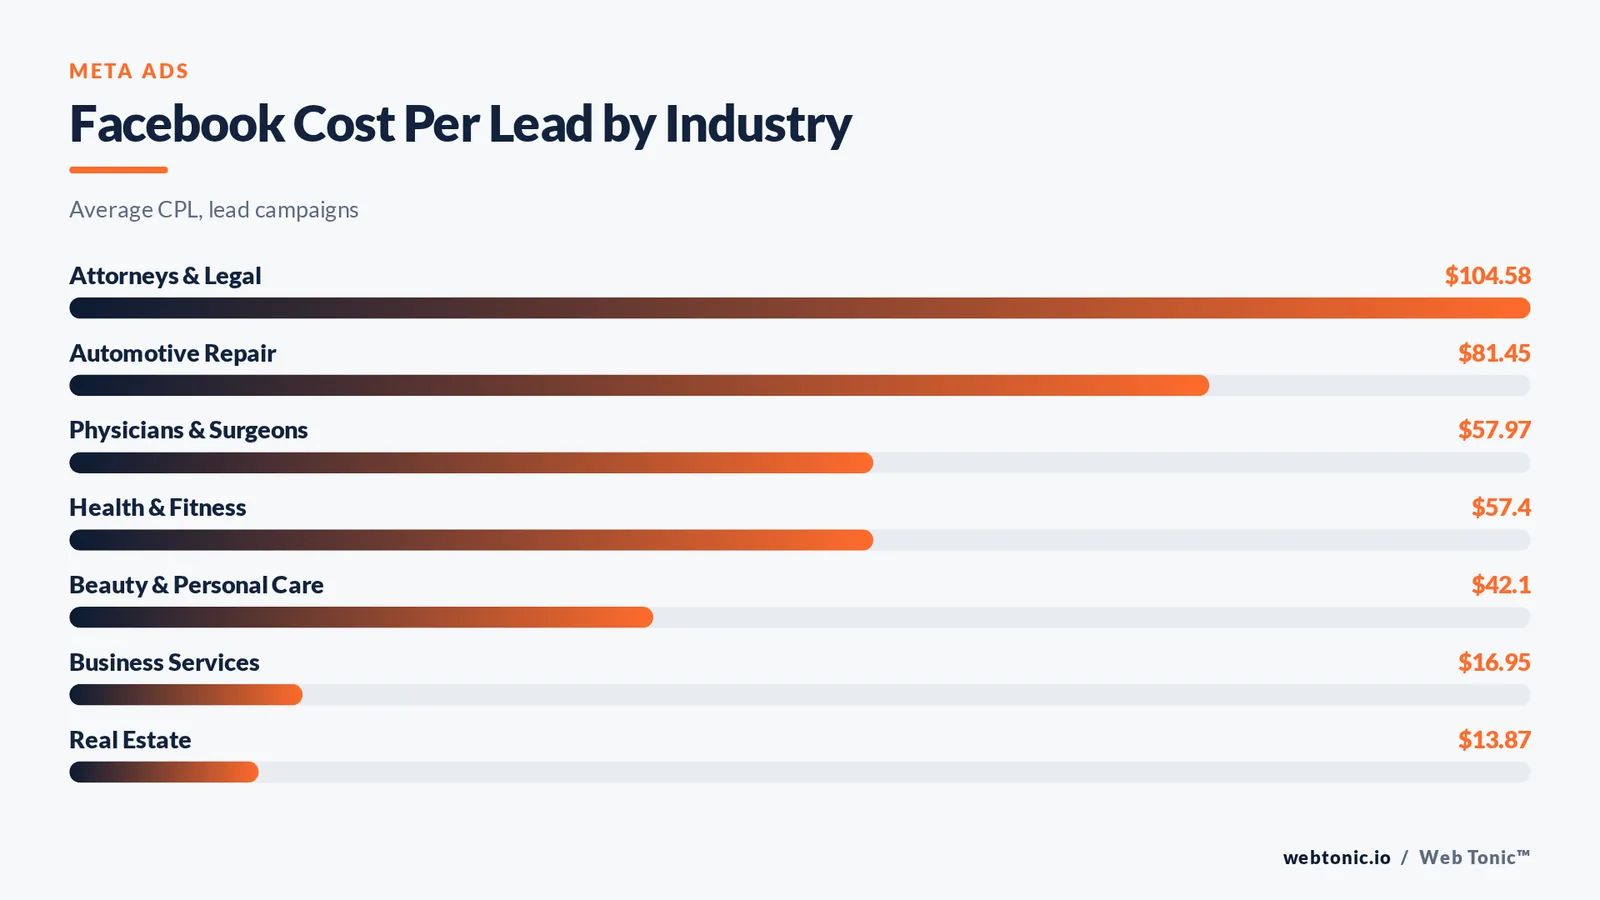
Lead campaigns are a different auction with different economics. Average cost per lead across industries is $21.98, but the range runs from $13.87 to $104.58 - a 7.5x spread that makes a blended "good CPL" meaningless.
| Industry | Avg CPC | Avg CPL | Avg CTR | Avg CVR |
|---|---|---|---|---|
| Attorneys & Legal Services | $8.50 | $104.58 | 1.61% | 7.57% |
| Automotive - Repair & Parts | $3.82 | $81.45 | 1.08% | 4.86% |
| Beauty & Personal Care | $2.44 | $42.10 | 2.26% | 5.93% |
| Business Services | $1.52 | $16.95 | 2.70% | 8.34% |
| Dentists & Dental Services | $4.10 | $32.46 | 1.54% | 9.83% |
| Education & Instruction | $2.03 | $31.82 | 2.32% | 8.49% |
| Finance & Insurance | $4.57 | $38.09 | 1.84% | 5.98% |
| Furniture | $2.10 | $39.25 | 2.36% | 6.11% |
| Health & Fitness | $3.29 | $57.40 | 1.46% | 5.78% |
| Home & Home Improvement | $2.18 | $24.29 | 1.78% | 8.87% |
| Industrial & Commercial | $2.77 | $24.53 | 1.48% | 12.03% |
| Personal Services | $1.93 | $20.49 | 2.56% | 9.19% |
| Physicians & Surgeons | $2.83 | $57.97 | 2.43% | 4.81% |
| Real Estate | $1.36 | $13.87 | 3.71% | 9.70% |
| Sports & Recreation | $1.20 | $14.59 | 3.74% | 8.87% |
Industrial and commercial advertisers convert best at 12.03%, while physicians and surgeons convert worst at 4.81% despite a healthy 2.43% click rate. That gap is almost always a form-length and follow-up problem rather than a targeting one. Historical benchmark data shows the same industries clustering year after year.
Facebook ads benchmarks by campaign objective
Meta's objective choice resets the auction, the optimisation event and therefore every benchmark. Use this table to pick the comparison set before you judge performance. Our breakdown of Facebook ad objectives covers the selection logic in depth.
| Objective | Optimisation event | Primary benchmark | Typical range | Watch out for |
|---|---|---|---|---|
| Awareness | Reach or impressions | CPM | $5-$15 CPM | Frequency above 3 in 7 days |
| Traffic | Link click or landing page view | CPC and CTR | $0.42-$1.09 CPC | Clicks that never load the page |
| Engagement | Post engagement | Cost per engagement | Under $0.20 | Vanity engagement with no revenue |
| Leads (instant form) | Form submit on Meta | CPL | $13.87-$104.58 | Lead quality collapse |
| Leads (website form) | Off-site conversion | CPL and CVR | 1.3-2x instant-form CPL | Signal loss without the API |
| Sales (catalogue) | Purchase | ROAS and CPA | $18.68 blended CPA reference | Retargeting cannibalisation |
| App promotion | Install or in-app event | CPI | Category dependent | Post-install churn |
Instant forms typically undercut website forms by 30% to 50% on CPL and lose ground on lead quality, which is why the CPL number alone never settles the objective debate.
Facebook ads benchmarks by placement
Meta reports one blended number, but placements behave nothing alike. Rather than invent placement averages, use this table to compare each surface against the right creative spec and the right metric. Roughly 80% of video ad views happen with the sound off, which is why the caption rule appears in every row.
| Placement | Creative spec | Metric that matters | Common failure |
|---|---|---|---|
| Facebook Feed | 1:1 or 4:5, ~125 characters primary text | CTR and outbound CTR | Text-heavy static creative |
| Instagram Feed | 4:5, ~40-character headline | Cost per outbound click | Reused Facebook crop |
| Stories | 9:16 full bleed, safe zones | Completion rate and CPC | Cropped logos and CTAs |
| Reels | 9:16 with a hook in 3 seconds | Hook rate and hold rate | Ads that look like ads |
| Right column | Small static, desktop only | CPM efficiency | Judged on CTR unfairly |
| Audience Network | Repurposed feed assets | Post-click quality | Accidental clicks inflating volume |
| Advantage+ placements | One asset set, auto-adapted | Blended CPA | No placement asset customisation |
Meta reported 3.58 billion daily active people and $200.97 billion of 2025 revenue in its full-year results, with the average price per ad up 9% year over year. Rising ad prices are the backdrop to every benchmark on this page.
Facebook ads versus Google Ads benchmarks
Advertisers rarely choose one channel; they choose a split. This comparison sets expectations for each. Search benchmarks come from LocaliQ's search advertising study, and our Google Ads benchmarks page carries the full industry tables.
| Metric | Facebook ads | Google Ads search | Why the gap |
|---|---|---|---|
| Average CTR | 1.57% traffic / 2.53% leads | 6.64% | Search captures existing demand |
| Average CPC | $0.77 traffic / $1.88 leads | $5.42 | Feed inventory is far larger |
| Average CVR | 8.78% on instant forms | 8.18% | Instant forms remove friction |
| Average CPL | $21.98 | $66.69 | Cheaper clicks, colder intent |
| Demand type | Created demand | Captured demand | Different funnel positions |
| Creative dependency | Very high | Moderate | Feed ads compete with organic content |
Meta wins on cost per lead by roughly 3x, Google wins on lead quality in most audits we run. The honest read is that a $21.98 Facebook lead and a $66.69 search lead can carry identical value per dollar once close rates are applied. See the platform data for audience context.
What pushes your numbers away from the benchmark
Before you rebuild anything, work out which of these six factors explains the gap. In our experience most of a benchmark miss traces back to two of them.
| Factor | Effect on CPC | Effect on CVR | First check |
|---|---|---|---|
| Creative fatigue | Up 20-60% | Down | Frequency and 7-day CTR trend |
| Audience size under 500,000 | Up sharply | Flat | Reach and frequency by ad set |
| Missing Conversions API | Flat | Down 10-30% | Event Match Quality score |
| Landing page speed | Flat | Down | Largest Contentful Paint |
| Special ad category | Up | Down | Category flag on the campaign |
| Over-segmented account | Up | Down | Ad sets stuck in learning |
Landing speed is the most ignored one. Google's Core Web Vitals guidance puts a good Largest Contentful Paint at 2.5 seconds or less, and paid-social traffic is far less patient than search traffic. Fixing measurement first is the job of our data intelligence practice.
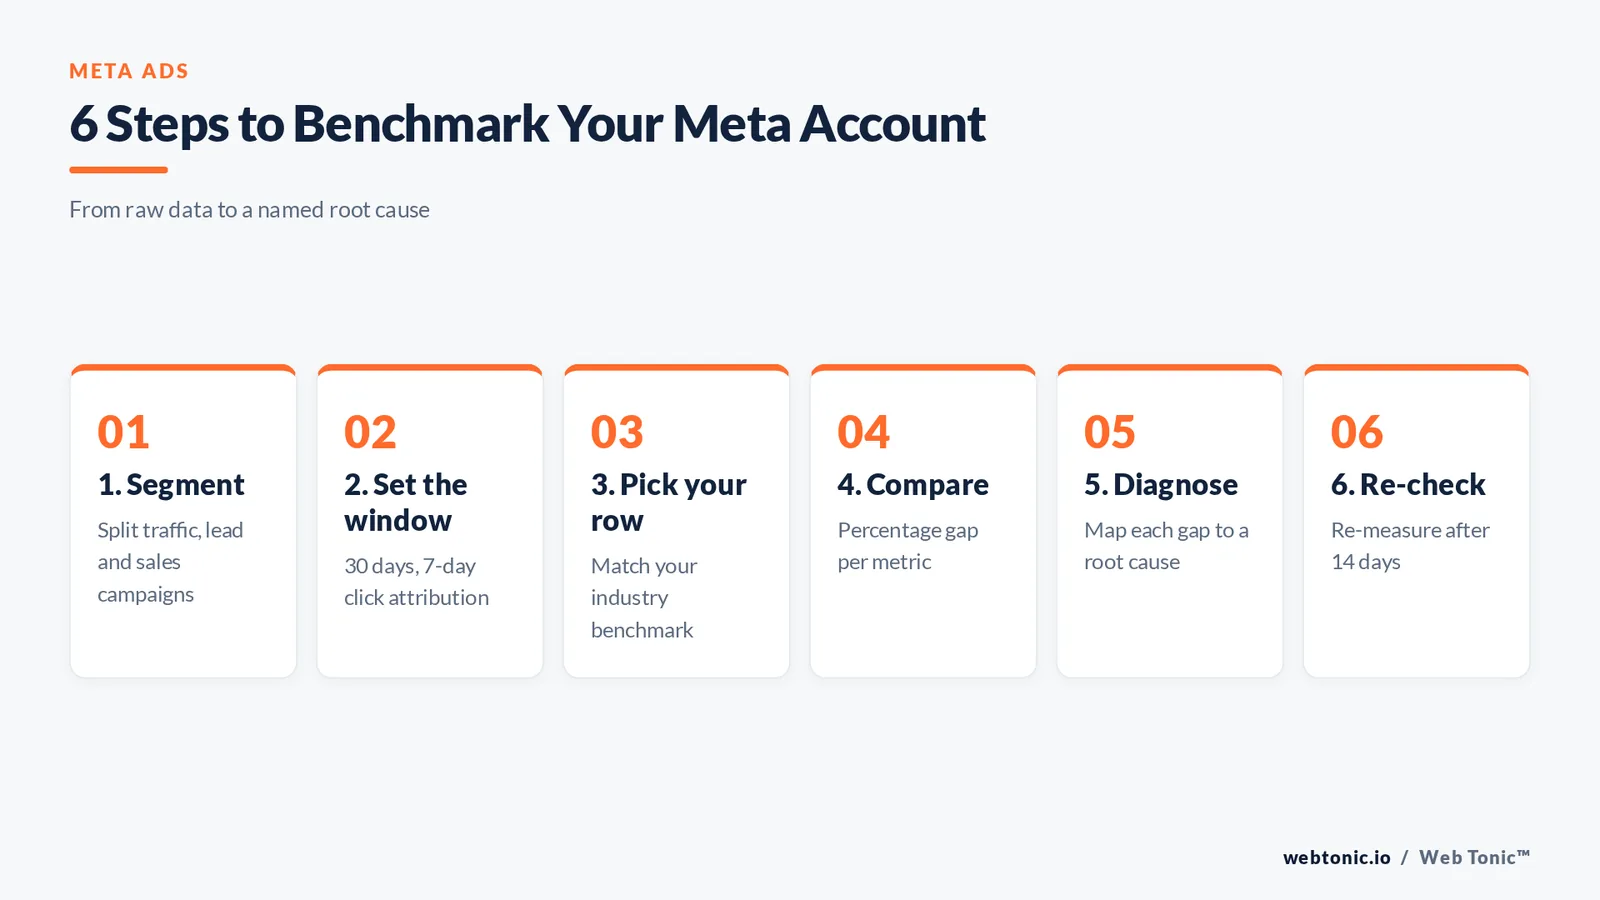
How to benchmark your own Meta ads account in six steps
Follow this in order. Each step takes minutes and stops the most common false conclusions.
| Step | Action | Output | Time |
|---|---|---|---|
| 1. Segment | Split traffic, lead and sales campaigns | Three comparison sets | 10 minutes |
| 2. Set the window | Use a 30-day range, 7-day click attribution | Stable data | 5 minutes |
| 3. Pick your row | Match your industry in the tables above | Target CPC, CTR, CPL | 5 minutes |
| 4. Compare | Calculate percentage gap per metric | Ranked gap list | 15 minutes |
| 5. Diagnose | Map each gap to the factor table | Named root cause | 30 minutes |
| 6. Re-check | Re-measure after 14 days, not 2 | Trend, not noise | Ongoing |
Step 2 breaks most audits: comparing a 1-day-click account to a 7-day-click benchmark understates conversions by a wide margin. The FTC's advertising guidance is also worth a read before you copy claims from a competitor's high-CTR ad.
What to do when you are behind the benchmark
Symptom-first triage, in the order that returns results fastest.
| Symptom | Likely cause | Action | Expected effect |
|---|---|---|---|
| CTR under 1% on traffic | Weak hook or wrong crop | Ship 5 new hooks in 9:16 | CTR up 30-80% |
| CPC 50% above your row | Narrow audience or fatigue | Broaden audience, refresh creative | CPC down 15-40% |
| CVR under 5% on lead forms | Too many fields | Cut to name, email, phone | CVR up 20-50% |
| CPL double your row | Bad objective match | Test website form plus API | CPL down 20-35% |
| Good CPL, bad sales | Lead quality | Add a qualifying question | Fewer, better leads |
| Volatile week to week | Budget under $50 per day | Consolidate ad sets | Faster learning exit |
Creative is the biggest lever by far. Steal structure, not wording, from our Facebook ad copy examples, then test against your own control.

The benchmarks that matter more than these
Platform averages are a diagnostic, not a goal. These four business metrics decide whether Facebook ads work for you.
| Metric | Definition | Why it beats a platform benchmark |
|---|---|---|
| MER | Total revenue divided by total ad spend | Immune to attribution drift |
| Contribution margin per lead | Gross margin minus fulfilment | Tells you the CPL you can afford |
| Lead-to-close rate | Closed deals divided by leads | Turns $21.98 CPL into cost per sale |
| Payback period | Months to recover acquisition cost | Sets the scaling ceiling |
Industry commentary from PPC Land, MediaPost and the IAB is useful for context, while Nielsen research remains the reference point on incrementality. Meta's own newsroom is where placement and product changes land first, and Statista's audience series tracks the user base behind the auction.
FAQ
What is a good CTR for Facebook ads?
Above 1.57% on traffic campaigns and above 2.53% on lead campaigns puts you ahead of the cross-industry average. In high-CTR categories such as real estate at 2.60% or arts and entertainment at 2.59%, the bar is much higher, so always compare against your own industry row rather than the blended figure.
What is the average cost per click on Facebook in 2026?
Traffic campaigns average $0.77 per click and lead campaigns average $1.88. Both improved year over year, even though Meta reported a 9% rise in average ad price, because click volume grew faster than cost.
Why is my Facebook cost per lead so much higher than $21.98?
Three reasons dominate: your industry may simply be expensive, as legal services at $104.58 shows; you may be running website forms rather than instant forms; or your Conversions API setup may be starving the algorithm of signal. Check the category first, then measurement, then creative.
Are Facebook ads cheaper than Google Ads?
Per click and per lead, yes. Facebook lead ads average $1.88 per click against $4.66 for the Google Ads equivalent, and $21.98 per lead against $66.69. Search leads usually close at a higher rate, so compare cost per sale rather than cost per lead.
How often should I re-benchmark?
Review your own trend monthly and re-check against published industry benchmarks twice a year. Benchmark studies are refreshed annually, so month-to-month comparison against a static table tells you more about seasonality than about performance.
Sources
WordStream, Facebook Ads Benchmarks (last updated September 2025) · WordStream, Facebook Advertising Benchmarks · LocaliQ, Search Advertising Benchmarks · Meta Platforms, Fourth Quarter and Full Year 2025 Results, investor.atmeta.com · Meta Newsroom, about.fb.com · Statista, Facebook monthly active users · FTC, Online Advertising and Marketing guidance · web.dev, Core Web Vitals · Nielsen Insights · IAB Insights · PPC Land · MediaPost. All figures verified against the linked sources; industry tables are cross-industry averages, not guarantees.