Table of contents

Facebook ads reached 2.28 billion users in January 2025, and Meta's family of apps averaged 3.58 billion daily active people in December 2025. These are the Facebook facts that hold up to a source check — scale, countries, demographics, money and history.
Key Takeaways
- Facebook's reported ad reach was 2.28 billion users in January 2025 — equal to 27.9% of the world's total population.
- Meta reported 3.58 billion family daily active people for December 2025, up 7% year over year across Facebook, Instagram, WhatsApp and Messenger.
- India is Facebook's largest single market at 384 million users, nearly double the United States' 197 million.
- Meta earned $200.97 billion in 2025 revenue, almost all of it advertising, with average price per ad up 9% for the year.
- Facebook launched on 4 February 2004 as "TheFacebook", funded by two students putting in $1,000 each.
Facebook by the Numbers
Every figure below is drawn from Meta's own investor reporting or from Kepios's analysis of Meta's advertising tools, published by DataReportal. Advertising reach is not the same measure as monthly active users, so the two are labelled separately throughout this page.
| Facebook fact | Figure | Period | Measure type |
|---|---|---|---|
| Users reachable with Facebook ads | 2.28 billion | January 2025 | Reported ad reach |
| Meta family daily active people | 3.58 billion | December 2025 | Daily active people |
| Share of total world population | 27.9% | January 2025 | Reported ad reach |
| Share of the world's internet users | 41.1% | January 2025 | Reported ad reach |
| Share of adults aged 18 and above | 39.4% | January 2025 | Reported ad reach |
| Eligible adoption rate excluding China | 43.7% | January 2025 | Reported ad reach |
| Annual growth in reachable users | +93.3 million (+4.3%) | Jan 2024 to Jan 2025 | Reported ad reach |
| Quarterly growth in reachable users | +62.3 million (+2.8%) | Oct 2024 to Jan 2025 | Reported ad reach |
DataReportal's Facebook statistics page is explicit that these advertising audience numbers may include duplicate and non-human accounts, which is why they run below the monthly active users figures Meta publishes in earnings materials.
How Many People Use Facebook?
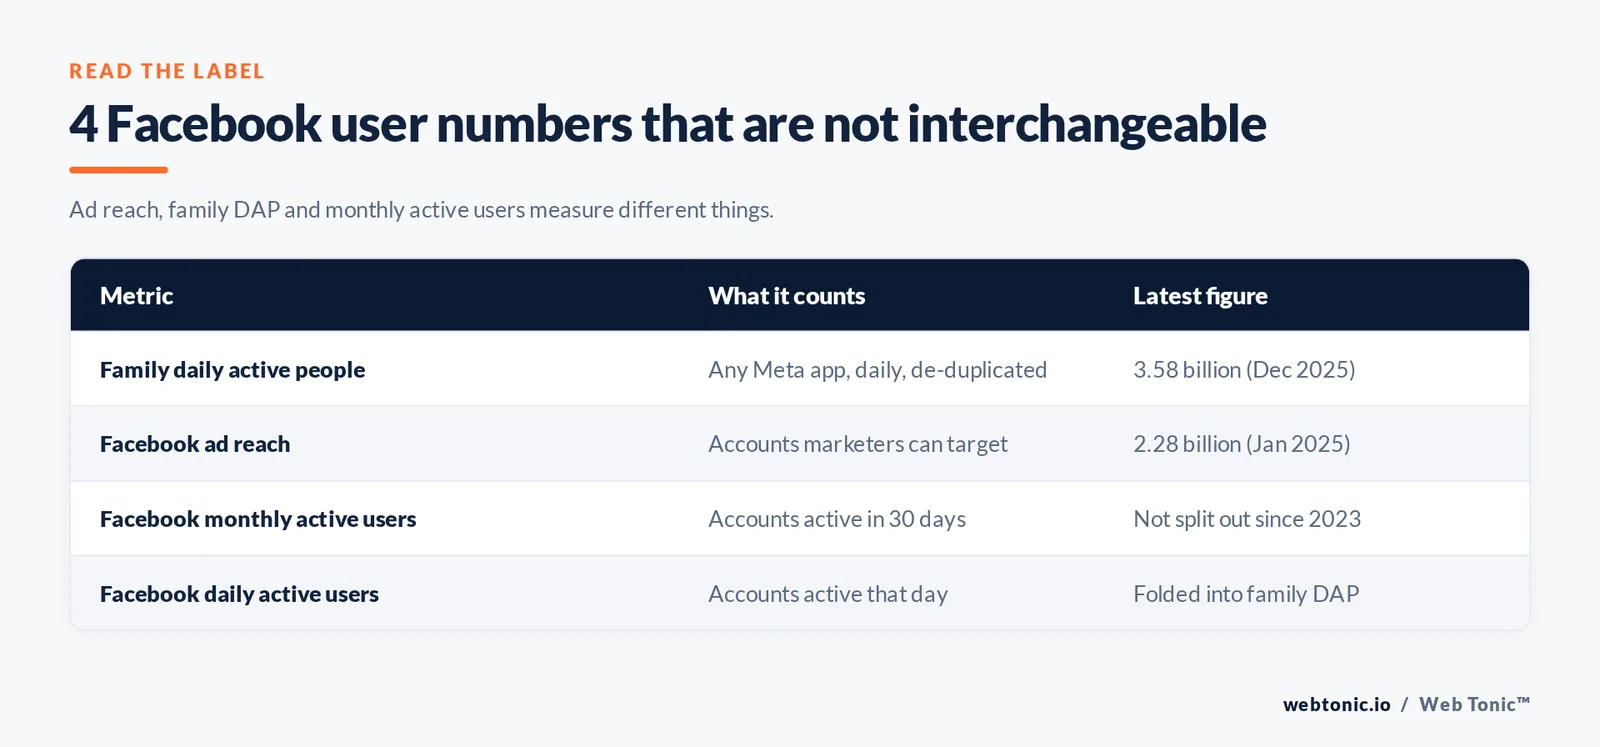
The honest answer is that no single number covers it. Meta stopped breaking out Facebook-only monthly active users in its quarterly reporting and now reports one combined figure for the whole family of apps.
| Metric | What it counts | Latest figure | Why it differs |
|---|---|---|---|
| Family daily active people (DAP) | People using any Meta app daily | 3.58 billion | De-duplicated across 4 apps |
| Facebook monthly active users | Accounts active in 30 days | Not separately disclosed since 2023 | No longer split out quarterly |
| Facebook ad reach | Accounts marketers can target | 2.28 billion | Excludes non-targetable accounts |
| Facebook daily active users | Accounts active that day | Not separately disclosed | Folded into family DAP |
Meta's fourth quarter and full year 2025 results are the primary record for the DAP figure. For platform-by-platform adoption among US adults, the Pew Research Center social media fact sheet is the standard independent survey source, because it measures self-reported use rather than accounts.
Which Countries Have the Most Facebook Users?
Facebook's user base is concentrated in South and South-East Asia, not in North America — a fact that reshapes any global media plan built on US assumptions.
| Country | Facebook users | Rank | Note for advertisers |
|---|---|---|---|
| India | 384 million | 1 | Largest audience, lowest media costs |
| United States | 197 million | 2 | Highest CPMs, highest purchase power |
| Indonesia | 122 million | 3 | Mobile-first, video-heavy consumption |
| Brazil | 112 million | 4 | Strong Marketplace and Groups use |
| Mexico | 93.0 million | 5 | High Messenger commerce activity |
| Philippines | 90.8 million | 6 | Among the world's heaviest social use |
| Vietnam | 76.2 million | 7 | Social commerce is the default channel |
| Bangladesh | 60.0 million | 8 | Fast-growing mobile user base |
| Thailand | 51.0 million | 9 | Chat-led buying journeys |
| Pakistan | 49.4 million | 10 | Low CPMs, growing reach |
Fact 1 — the top ten territories account for well over 1.2 billion of Facebook's reachable users, and only one of them is a high-income English-speaking market.

Facebook Users by World Region
Grouping the same advertising audience data by United Nations region shows where the platform's centre of gravity actually sits.
| Region | Facebook users | Share of global total |
|---|---|---|
| Southern Asia | 520 million | 22.8% |
| South-Eastern Asia | 398 million | 17.4% |
| Southern America | 257 million | 11.3% |
| Northern America | 221 million | 9.7% |
| Central America | 120 million | 5.2% |
| Western Asia | 115 million | 5.0% |
| Northern Africa | 110 million | 4.8% |
| Western Europe | 77.0 million | 3.4% |
| Western Africa | 74.7 million | 3.3% |
| Southern Europe | 71.1 million | 3.1% |
| Eastern Europe | 61.3 million | 2.7% |
| Oceania | 23.6 million | 1.0% |
Fact 2 — Southern and South-Eastern Asia together hold 40.2% of Facebook's reachable audience, while all four European sub-regions combined hold roughly 11.8%. Our World in Data's history of social media adoption shows how quickly that shift happened after 2012.
Facebook Audience Demographics
The global gender split leans male, but the pattern reverses in several high-income markets, so a global average is a poor planning input.
| Audience segment | Share of ad audience | Planning implication |
|---|---|---|
| Male, worldwide | 56.7% | Global skew is driven by internet access gaps |
| Female, worldwide | 43.3% | Do not assume it in every market |
| Female, Southern Asia | 27.6% | Strongest male skew of any region |
| Female, Western Asia | 32.4% | Adjust creative casting per market |
| Minimum age to use Facebook | 13 years | Adoption rates are computed on age 13+ |
The wider context: DataReportal counts 5.66 billion social media identities worldwide with an average of 2 hours 40 minutes of daily social use, and the ITU's connectivity statistics explain the access gap behind Facebook's regional gender differences.
10 Facts About Facebook's History
The origin story matters commercially, because most of Facebook's advertising architecture was bolted onto a product designed for something else entirely.
| Year | Fact | Why it matters |
|---|---|---|
| 2004 | Mark Zuckerberg launches "TheFacebook" on 4 February at Harvard | Closed campus network, not a public platform |
| 2004 | Zuckerberg and Eduardo Saverin each invest $1,000 | The whole product started on $2,000 |
| 2004 | PayPal co-founder Peter Thiel makes the first outside investment | First external capital, pre-revenue |
| 2006 | News Feed launches and registration opens to the public | Created the ad inventory that funds Meta |
| 2010 | Facebook passes 500 million users | Reached global-scale audience in 6 years |
| 2012 | Monthly active users pass 1 billion | Doubled the user base in 2 years |
| 2012 | One of the largest tech IPOs to date; Instagram acquired | Start of the multi-app family |
| 2014 | WhatsApp and Oculus VR acquired | Messaging and hardware bets |
| 2019 | FTC imposes a $5 billion privacy penalty | Largest privacy fine of its kind at the time |
| 2021 | Parent company renamed Meta Platforms | Facebook becomes one app among several |
The 2019 settlement is documented in the FTC's own press release, and the Cambridge Analytica reporting that triggered it was covered contemporaneously by the BBC. Both events explain why today's Facebook ad targeting is narrower than it was a decade ago.
Facebook Advertising Revenue Facts
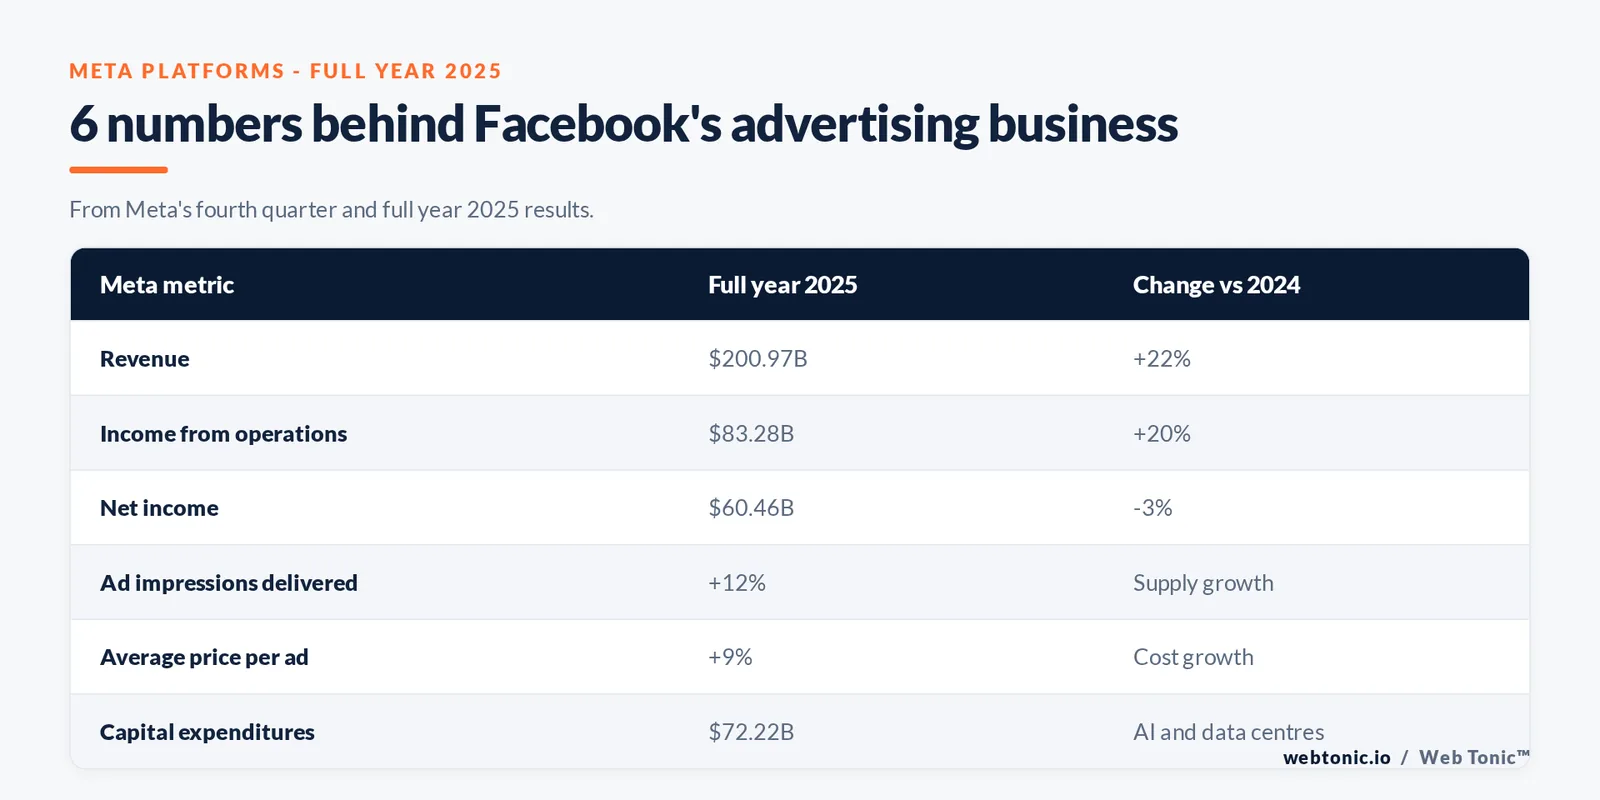
Facebook is an advertising business first. Meta's full-year 2025 results show what that scale looks like in money, and where an advertiser's costs are heading.
| Meta metric | Q4 2025 | Full year 2025 | Year-over-year change |
|---|---|---|---|
| Revenue | $59.89 billion | $200.97 billion | +24% / +22% |
| Income from operations | $24.75 billion | $83.28 billion | +6% / +20% |
| Net income | $22.77 billion | $60.46 billion | +9% / -3% |
| Ad impressions delivered | +18% | +12% | Growth in supply |
| Average price per ad | +6% | +9% | Growth in cost |
| Capital expenditures | $22.14 billion | $72.22 billion | AI and data centres |
Fact 3 — impressions grew 12% while average price per ad grew 9% across 2025, so more inventory did not make Facebook cheaper. Plan for close to 10% annual media cost inflation before you plan for growth. That budgeting work is core to our growth marketing retainers.
What These Facebook Facts Mean for Marketers
Facts are only useful if they change a decision. Here is how each one translates into a media choice.
| Fact | Decision it should change | Action this quarter |
|---|---|---|
| 2.28 billion reachable users | Whether to broaden targeting | Test one broad audience against your best lookalike |
| Family DAP of 3.58 billion | Placement strategy | Let placements run across the family, review by placement |
| Average price per ad +9% | Annual budget planning | Build a 9-10% cost-inflation line into the plan |
| India and Indonesia lead volume | Market prioritisation | Separate campaigns by market cost tier |
| 56.7% male global skew | Creative casting | Check your own audience report, not the global average |
| Facebook organic engagement is low | Organic effort allocation | Move effort to Groups, Reels and paid amplification |
Organic reality check: Socialinsider's analysis of 35 million posts puts Instagram's overall engagement rate at 0.48% and Facebook's at roughly 0.15%, so a page with 50,000 followers should expect double-digit, not four-digit, interactions per post. Our performance creative work exists because paid distribution now carries what organic reach used to.
6 Facebook Facts Marketers Get Wrong
| Claim you will see online | Why it is wrong | Better framing |
|---|---|---|
| Myth 1 — "Facebook has 3 billion daily users" | 3.58 billion is the whole Meta family, de-duplicated | Cite family DAP as a family figure |
| Myth 2 — "Ad reach equals monthly active users" | Ad reach counts targetable accounts only | Label the measure every time |
| Myth 3 — "Young people have left Facebook" | Usage shifted, but the age-13+ base is still huge | Check your own audience insights per market |
| Myth 4 — "Facebook is a US platform" | The US is 197 million of 2.28 billion | Plan by market, not globally |
| Myth 5 — "More impressions means cheaper ads" | Price per ad rose 9% while impressions rose 12% | Track cost per result, not impressions |
| Myth 6 — "Organic reach still works at scale" | Engagement rates sit near 0.15% | Budget for paid distribution |
When a statistic has no primary source behind it, treat it as marketing copy. Aggregators such as Hootsuite's Facebook statistics roundup and Sprout Social's stats for marketers are useful starting points, but the figure you publish should trace back to Meta's filings or to Kepios. More platform breakdowns sit on the Web Tonic blog, and you can ask us for the current numbers for your own market.

FAQ
How many people use Facebook in 2025?
Facebook ads reached 2.28 billion users in January 2025, which equals 27.9% of the world's population and 41.1% of all internet users. Meta separately reported 3.58 billion daily active people across its family of apps for December 2025.
What is the difference between Facebook ad reach and monthly active users?
Ad reach counts accounts marketers can target and may include duplicate or non-human accounts, while monthly active users counts accounts active in a 30-day window. Ad reach is normally the lower of the two figures.
Which country has the most Facebook users?
India, with 384 million Facebook users in January 2025. The United States is second with 197 million, followed by Indonesia at 122 million and Brazil at 112 million.
When was Facebook founded?
Mark Zuckerberg launched the site as "TheFacebook" on 4 February 2004 at Harvard. It opened to the general public in 2006, passed 500 million users in 2010 and passed 1 billion monthly active users in October 2012.
How much money does Facebook make from advertising?
Meta reported $200.97 billion of revenue in 2025, up 22% year over year, with $60.46 billion of net income. Advertising across Facebook and the rest of the family of apps accounts for almost all of it.
Sources
Meta Platforms fourth quarter and full year 2025 results (DAP 3.58 billion, revenue $200.97 billion, price per ad +9%) · DataReportal / Kepios essential Facebook statistics, January 2025 (ad reach 2.28 billion, country and regional splits, gender split) · DataReportal global social media users overview (5.66 billion social identities) · Pew Research Center social media fact sheet · Our World in Data, the rise of social media · ITU connectivity statistics · US FTC press release on the $5 billion Facebook privacy penalty, July 2019 · BBC News Cambridge Analytica coverage · Wikipedia Facebook history entry for founding dates and milestones · Socialinsider engagement benchmarks (35 million posts) · Hootsuite and Sprout Social statistics roundups. All figures retrieved August 2026.