



Table of contents

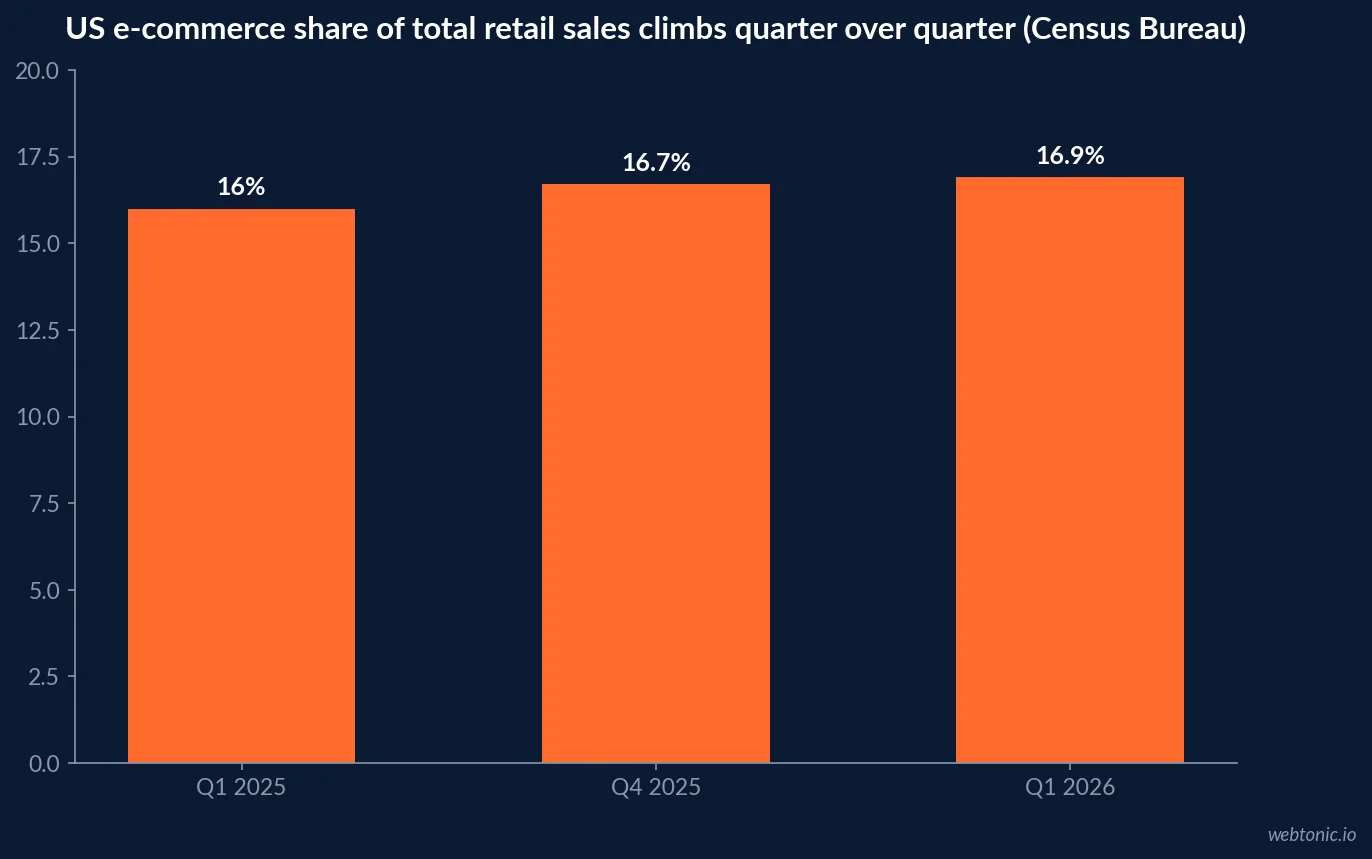
Online sales reached 16.9% of total US retail in the first quarter of 2026, per the Census Bureau, while global online retail runs closer to a fifth of all sales. The gap between those two numbers, and what closes it, is the subject of this page: conversion, abandonment, B2B migration and payment mix, each traced to the body that actually measures it.
Key Takeaways
- US e-commerce was 16.9% of total retail sales in Q1 2026.
- The quarter's online total was USD 326.7 billion.
- Global online retail is forecast at 21.1% of total retail in 2026.
- Global e-commerce sales are forecast to reach USD 6.88 trillion in 2026.
- US online sales grew 9.8% year over year in Q1 2026.
- The median store conversion rate is 1.74% in H1 2026.
- The mean conversion rate is 2.61%, pulled up by top performers.
- Cart abandonment averages 70.22% across 50 tracked studies.
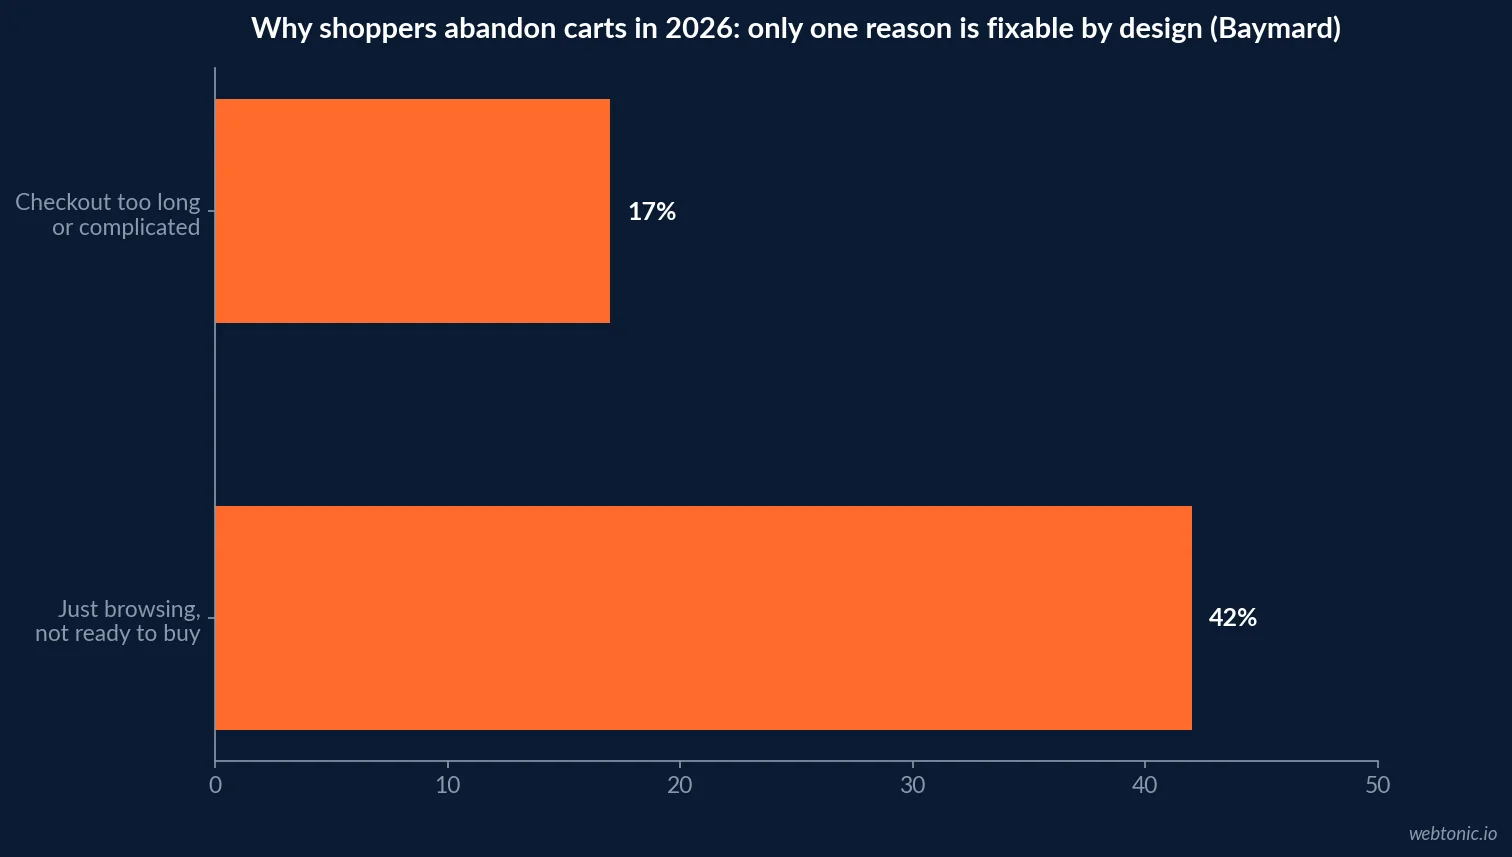
- 42% of shoppers who abandon say they were just browsing.
- 17% abandon over a checkout that is too long or complicated.
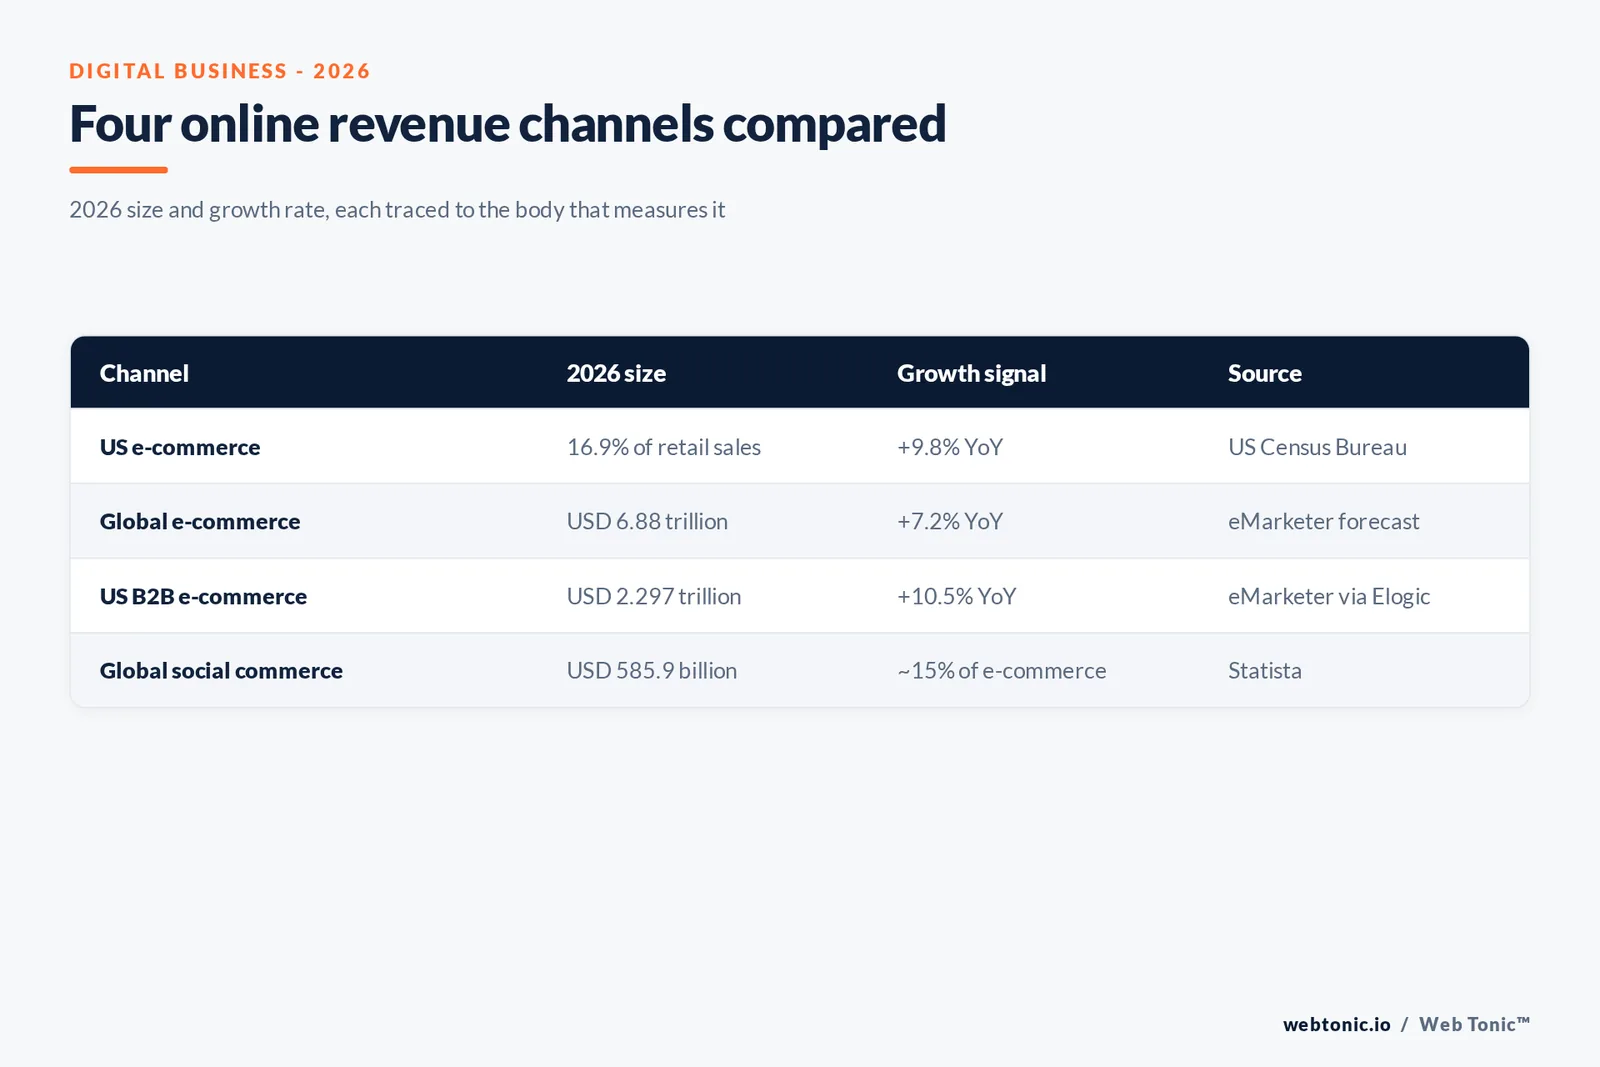
- US B2B e-commerce site sales hit USD 2.297 trillion in 2024.
- B2B digital sales grew 10.5% against 0.4% for total wholesale.
- B2B e-commerce now exceeds one-third of revenue for sellers offering it.
- Mobile commerce is roughly 60% of global online retail in 2026.
- Digital wallets carry more than half of online payment value.
- Social commerce revenue is estimated at USD 585.9 billion in 2026.
- Social commerce is about 15% of total global e-commerce.
- The December 2025 US online record hit 21.8% of retail sales dollars.
The headline number: online share of total retail
The US Census Bureau's Q1 2026 retail e-commerce report puts the seasonally adjusted online share of total US retail sales at 16.9%, with the quarter's online sales at USD 326.7 billion against USD 1,929.0 billion in total retail sales. On a year-over-year basis, online sales grew 9.8% while total retail grew only 3.9%, so the channel keeps taking share even in a slow-growth retail year.
Globally the base is wider. Capital One Shopping's tracking of published forecasts puts worldwide e-commerce at an estimated 20.5% of retail sales in 2025, with a monthly record of 21.8% of US retail sales dollars set in December 2025, and projects the global figure will approach 22.5% by 2028.
| Metric (2026) | Figure | Source | What it measures |
|---|---|---|---|
| US e-commerce share, Q1 2026 | 16.9% | US Census Bureau | Seasonally adjusted, all retail |
| US online sales, Q1 2026 | USD 326.7B | US Census Bureau | Quarterly online total |
| US total retail sales, Q1 2026 | USD 1,929.0B | US Census Bureau | All retail categories |
| US online growth, YoY | 9.8% | US Census Bureau | Online vs Q1 2025 |
| Global e-commerce share, 2026 forecast | 21.1% | eMarketer, Feb 2025 | All countries, forecast |
| Global e-commerce sales, 2026 forecast | USD 6.88 trillion | eMarketer, Feb 2025 | All countries, forecast |
Where the global forecast comes from, and why it disagrees with the US number
The 16.9% US figure and the 21.1% global figure are not contradicting each other - they describe different retail bases. Shopify's compilation of the eMarketer forecast series shows global online retail sales climbing from USD 5.08 trillion in 2022 to a projected USD 6.88 trillion in 2026 and USD 7.89 trillion by 2028, a run of 6.8% to 9.6% annual growth. Markets that never built the same density of big-box physical retail as the US - much of Southeast Asia and parts of Latin America - carry a structurally higher online share, which pulls the global blended average above the US number.
Year by year, the eMarketer series runs USD 5.08 trillion (2022, +5.9%), USD 5.58 trillion (2023, +9.6%), USD 6.01 trillion (2024, +7.7%), USD 6.42 trillion (2025, +6.8%) and USD 6.88 trillion (2026, +7.2%) - a growth curve that is decelerating in percentage terms even as the absolute dollar addition per year keeps rising.
Average order value: one global number hides the real benchmark
A single blended average order value is close to useless as an operating target, because the spread between categories is enormous. Dynamic Yield's benchmark data, compiled by ClickPost's 2026 industry breakdown, puts the global average order value at USD 172, with Luxury & Jewelry topping the category table at USD 310 and Pet Care & Veterinary at the bottom at USD 66. Regionally, EMEA leads at USD 193 against APAC's USD 125, and by device, desktop orders average USD 218 against USD 159 on mobile - a reminder that mobile's traffic dominance does not translate into equally large baskets.
The practical use of AOV data is comparative, not absolute: a fashion brand at USD 150 per order is on target for its category, while a consumer goods retailer at the same figure is underperforming its peers by a wide margin.
Page speed still moves conversion directly
Shopify's 2026 analysis of Core Web Vitals across its own merchant base, using Chrome User Experience real-world performance data, finds that every 100 milliseconds of slower load time correlates with roughly 3.5% lower conversion. Put in concrete terms, stores with a 2.5-second Largest Contentful Paint show about 30% lower conversion than stores loading in 1.5 seconds - a gap large enough to outweigh most on-page copy or layout changes.
Nearly 80% of Shopify stores now pass all Core Web Vitals thresholds, among the highest compliance rates of any major commerce platform, which raises the bar for what counts as "fast enough" heading into 2026 holiday planning.
Conversion rate: the number that decides how much traffic becomes revenue
Getshogun's H1 2026 benchmark, built from 745 active Shopify stores through June 2026, puts the median conversion rate at 1.74% and the cohort mean at 2.61%, with the middle 50% of stores converting between 0.88% and 3.39%. The gap between median and mean matters: the mean is pulled higher by a long tail of high-converting stores concentrated in health and wellness (3.31% median) and beauty, which means a store benchmarking itself against the blended average is measuring against the wrong number.
Movement inside the year was uneven. Getshogun's quarter-over-quarter read shows six of ten categories gaining ground between Q1 and Q2 2026, with Food & Beverage up 22.6% quarter over quarter while Toys & Hobbies fell 10.0% - evidence that category-level demand shifts move conversion more than any single site change.
| Benchmark (H1 2026) | Conversion rate | Source | Read it as |
|---|---|---|---|
| All stores, median | 1.74% | Getshogun, 745 Shopify stores | The typical merchant |
| All stores, mean | 2.61% | Getshogun, 745 Shopify stores | Cohort average, skewed by leaders |
| Middle 50% range | 0.88%-3.39% | Getshogun | Realistic target band |
| Health & Wellness, median | 3.31% | Getshogun | Highest-converting category |
| Home & Garden, median | 1.62% | Getshogun | Lower-converting category |
Cart abandonment: still 70%, still mostly fixable in the checkout, not the cart
Baymard Institute's rolling average of 50 published studies puts cart abandonment at 70.22%, a figure that has barely moved across 13 years of tracking. Baymard's own quantitative research on the reasons behind it finds 42% of US shoppers who abandoned a cart in the past three months say they were just browsing and never intended to buy - a segment no checkout redesign will convert.
Strip that segment out and the largest remaining, addressable reason is a checkout that is too long or too complicated, cited by 17% of shoppers. That is the number a UX or CRO investment can actually move, and it is the reason checkout-flow audits keep outperforming generic "reduce friction" advice.
| Abandonment reason | Share of shoppers | Addressable by design? | Source |
|---|---|---|---|
| Just browsing, not ready to buy | 42% | No - pre-checkout intent | Baymard Institute |
| Checkout too long or complicated | 17% | Yes - checkout UX | Baymard Institute |
| Rolling 50-study abandonment average | 70.22% | n/a - blended figure | Baymard Institute |
B2B e-commerce is the faster-growing half of the market
The consumer side gets the headlines, but B2B is where digital is actually taking share fastest. Elogic Commerce's compilation of eMarketer and McKinsey data puts US B2B e-commerce site sales (web and portal orders, excluding EDI) at USD 2.297 trillion in 2024, up 10.5% year over year, projected to reach USD 3.027 trillion by 2028. Over the same period, total US manufacturing and wholesale sales grew just 0.4% - a two-speed market where the digital channel inside B2B is expanding many times faster than the trade it sits inside of.
McKinsey's B2B Pulse survey, cited in the same report, finds e-commerce now generates more than one-third of revenue for B2B organizations that offer the channel, making it the single largest revenue-generating channel for those sellers and overtaking in-person sales for the first time.
| B2B e-commerce metric | Figure | Source | Note |
|---|---|---|---|
| US B2B site sales, 2024 | USD 2.297 trillion | eMarketer via Elogic Commerce | Web/portal orders, excludes EDI |
| US B2B site sales, 2028 forecast | USD 3.027 trillion | eMarketer via Elogic Commerce | 7.8% CAGR modeled |
| Total US mfg + wholesale sales growth, 2025 | 0.4% | DC360 / Dept. of Commerce | The slow-growth denominator |
| B2B revenue from e-commerce, sellers offering it | >33% | McKinsey B2B Pulse | Now the top revenue channel |
| US B2B marketplace growth, 2021-24 | +519% | Digital Commerce 360 | Fastest B2B digital channel |
Mobile and social are converging inside the same checkout
Mobile devices now account for roughly 60% of global e-commerce sales in 2026 by the transaction-value consensus (Mordor Intelligence, Fortune Business Insights), even though mobile drives closer to 78% of retail website traffic - a gap between traffic share and revenue share that is the central efficiency problem for any mobile-first storefront.
Social commerce, meanwhile, is smaller but growing faster than the category as a whole: Statista's tracking puts worldwide social commerce revenue at an estimated USD 585.9 billion in 2026, roughly 15% of total global e-commerce, with a projected climb to USD 928.65 billion by 2030. China alone is estimated at USD 366 billion of that 2026 total, making it by far the most mature social-commerce market tracked.
| Channel (2026) | Figure | Source |
|---|---|---|
| Mobile share of global e-commerce sales | ~60% | Mordor Intelligence / Fortune Business Insights |
| Mobile share of retail website traffic | ~78% | Axis of published mobile traffic studies |
| Global social commerce revenue | USD 585.9 billion | Statista |
| Social commerce share of global e-commerce | ~15% | Statista |
| China social commerce revenue | USD 366 billion | Statista |
Digital wallets have taken over online checkout
The Worldpay 2026 Global Payments Report, tracking consumer payment preference across 42 markets, finds digital wallets - Alipay, Apple Pay, PayPal and similar - now account for over half of online transaction value worldwide and about a third of in-person value, ahead of cards as the dominant single payment type online. The same report projects payment apps will reach 46% of global point-of-sale value by 2030, worth an estimated USD 15.6 trillion, meaning the wallet-first pattern is now moving from online into physical checkout too.
Buy-now-pay-later is the fastest-growing line inside that mix: Worldpay projects BNPL will reach USD 500 billion of global e-commerce value by 2030, while cryptocurrency stays a rounding error at 0.19% of global transaction value despite merchant acceptance creeping toward 10%.
| Payment method (2026-2030) | Figure | Source |
|---|---|---|
| Digital wallet share of online transaction value | >50% | Worldpay GPR 2026 |
| Digital wallet share of in-person transaction value | ~33% | Worldpay GPR 2026 |
| Payment apps' share of global POS value by 2030 | 46% (USD 15.6T) | Worldpay GPR 2026 |
| BNPL global e-commerce value by 2030 | USD 500 billion | Worldpay GPR 2026 |
| Cryptocurrency share of global transaction value | 0.19% | Worldpay GPR 2026 |
Reading the two headline numbers together
Treat 16.9% and 21.1% as the same measurement taken at different scopes: US-only, seasonally adjusted retail sales versus a global forecast blending markets with much higher digital penetration. Neither number tells a merchant what to do with a specific storefront - the conversion, abandonment and payment-mix benchmarks above do that, because they are measured at the store level rather than the economy level.
The practical read for 2026 planning: online share keeps climbing everywhere, B2B is closing the digital gap faster than consumer retail, and the checkout - not the storefront - is where the next percentage point of conversion actually gets found.
What this means for a growth plan
A digital business built on these benchmarks treats conversion rate and cart abandonment as the two levers worth the most attention, since both are measured at the store level and both respond directly to checkout and page-speed work. Our growth marketing practice and data and analytics team build that instrumentation before touching creative or spend, and our breakdown of what paid social costs is a useful companion read for teams deciding how much of the acquisition budget a growing online channel can justify. If online revenue is a growing share of the business and the metrics above look unfamiliar for your own store, talk to us.
Frequently Asked Questions
What percentage of retail sales happen online in 2026?
In the United States, the Census Bureau put e-commerce at 16.9% of total retail sales in the first quarter of 2026, on a seasonally adjusted basis, with the quarter's online total at USD 326.7 billion against USD 1,929.0 billion in total retail. Globally the picture runs higher: eMarketer's February 2025 forecast, still the reference series cited through 2026, puts worldwide online retail at 21.1% of total retail sales for the year, because many markets outside the US never built the same big-box retail base that keeps the US share lower.
What is a good e-commerce conversion rate in 2026?
Shogun's H1 2026 benchmark across 745 active Shopify stores puts the median conversion rate at 1.74% and the mean at 2.61%, with the middle 50% of stores landing between 0.88% and 3.39%. The median is the more honest number to chase, since the mean gets pulled up by a long tail of high-converting stores concentrated in health, beauty and food and beverage. Benchmark against your own category median, not the blended average.
Why do 70% of online shopping carts get abandoned?
Baymard Institute's rolling 50-study average puts cart abandonment at 70.22%, and its own quantitative research finds 42% of US shoppers who abandoned in the last quarter say they were just browsing rather than buying. Strip that segment out and the largest remaining reason is a checkout that is too long or too complicated, at 17% of shoppers - the one abandonment cause a better checkout flow can actually fix.
Is B2B or B2C e-commerce growing faster in 2026?
B2B. eMarketer's 2024 data, the latest full-year figure carried into 2026 planning, puts US B2B e-commerce site sales at USD 2.297 trillion, up 10.5% year on year, while total US manufacturing and wholesale sales grew only 0.4% over the same period. McKinsey's B2B Pulse survey reports digital channels now generate more than one-third of revenue for B2B sellers that offer them, ahead of in-person sales for the first time.
How much of e-commerce runs through digital wallets now?
Worldpay's 2026 Global Payments Report finds digital wallets - Alipay, Apple Pay, PayPal and similar - account for more than half of online transaction value worldwide, making them the dominant online payment method ahead of cards. The same report projects payment apps will reach 46% of global point-of-sale value by 2030, meaning the wallet-first pattern already visible online is moving into physical checkout too.
Sources
US Census Bureau - Quarterly Retail E-Commerce Sales, Q1 2026
Shopify - Global Ecommerce Sales Growth Report, citing eMarketer forecast
Capital One Shopping Research - E-commerce percentage of retail sales
Getshogun - Ecommerce Conversion Rate Benchmark Report, H1 2026
Baymard Institute - Cart Abandonment Rate Statistics
Elogic Commerce - The State of B2B Ecommerce 2026
Worldpay - Global Payments Report 2026
Statista - Social commerce statistics and facts


