Table of contents

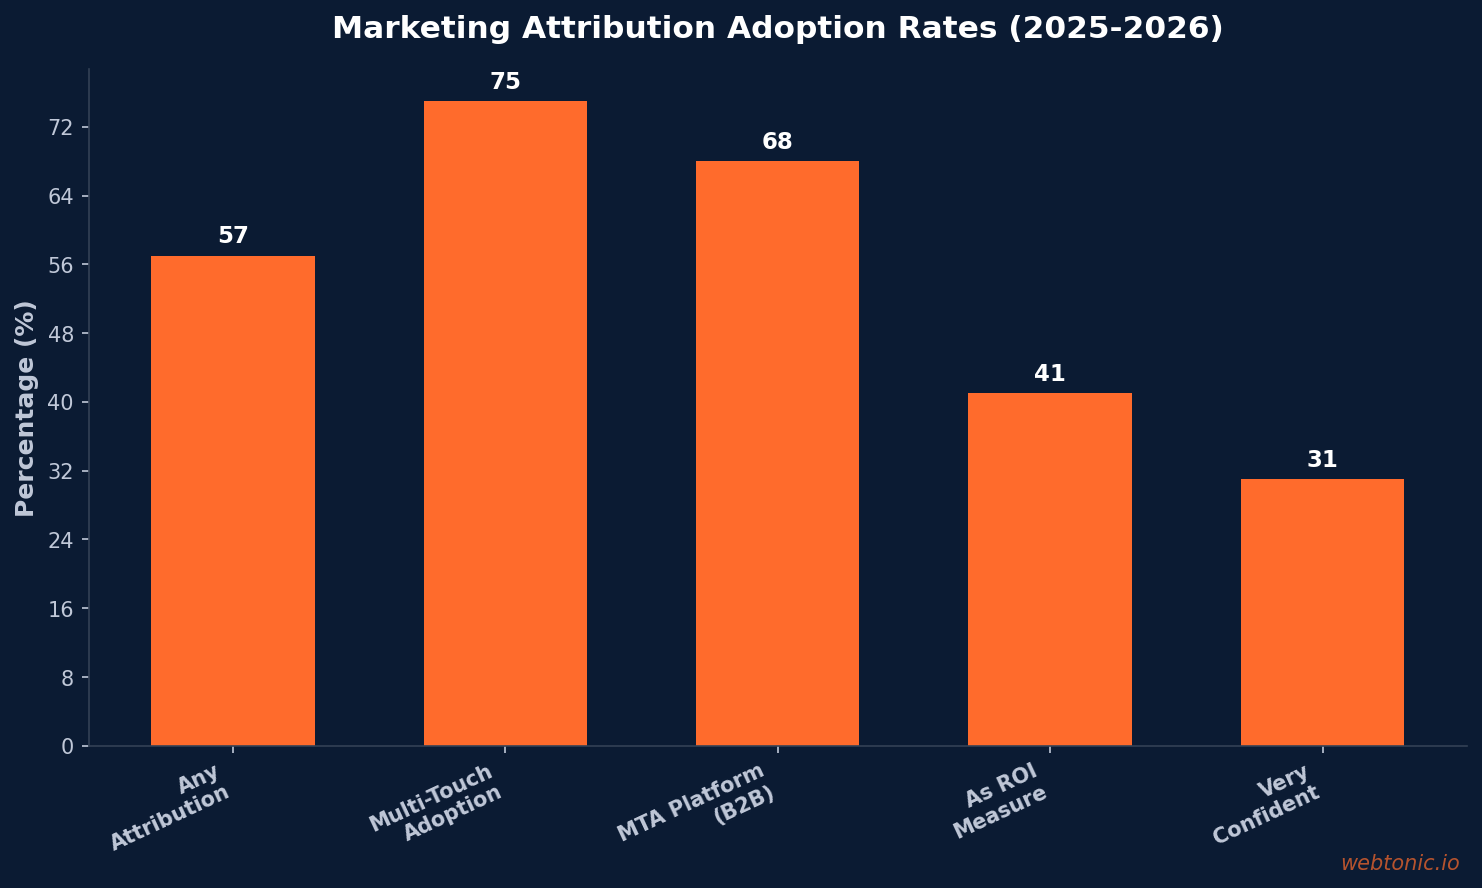
57% of companies now use some form of marketing attribution model, yet only 31% are very confident in their current setup (MarketingLTB). For education and coaching businesses — where enrollment journeys span 10–18 months and touch dozens of channels — getting attribution right is the difference between scaling enrollment and wasting budget on invisible touchpoints. This comprehensive data guide collects 78+ verified statistics on attribution adoption, model performance, and measurement infrastructure for the education and coaching sectors in 2026.
Key Takeaways
- 57% of companies use some form of marketing attribution in 2025, with adoption accelerating year over year (MarketingLTB).
- 75% of companies now use multi-touch attribution models over single-touch methods, a major shift from five years ago (SaleSso).
- 68% of B2B firms adopted a dedicated MTA platform in 2024, up from 61% in 2023 (Starr Conspiracy / HockeyStack).
- Enterprise B2B MTA adoption reached 84% among organizations with 2,000+ employees (Starr Conspiracy).
- Educational content correlates with 15% higher lead-to-close velocity in attributed marketing pipelines (MarketingLTB).
- Higher education enrollment journeys average 12–18 months, requiring attribution windows far beyond Meta's 7-day default (Prooflytics / Skolbot).
- 14.2 weeks is the median attribution tool implementation time for B2B organizations (Starr Conspiracy).
- 91% of marketers say attribution is important to their success, yet execution dramatically lags stated intention (MarketingLTB).
Marketing Attribution Adoption Benchmarks at a Glance
Attribution adoption is growing fast — but the gap between having a model and trusting it remains wide. The table below captures the current state across B2B organizations, with particular relevance to education and coaching businesses where long decision cycles amplify every attribution weakness and every miscalibrated model wastes real enrollment budget.
| Metric | Value | Context | Source |
|---|---|---|---|
| Attribution adoption (any model) | 57% | Up from ~41% two years prior | MarketingLTB |
| Multi-touch adoption rate | 75% | Over single-touch methods | SaleSso |
| Dedicated MTA platform (B2B) | 68% | Up from 61% in 2023 | Starr / HockeyStack |
| Enterprise MTA (2K+ employees) | 84% | Highest adoption segment | Starr / HockeyStack |
| Marketers saying attribution is important | 91% | Stated importance vs. execution gap | MarketingLTB |
| Very confident in current model | 31% | 60-point gap vs. importance | MarketingLTB |
| Using attribution as ROI measure | 41% | Subset of total attribution users | MarketingLTB |
| Median MTA tool setup time | 14.2 weeks | B2B organizations average | Starr Conspiracy |
| Content lead-to-close velocity lift | +15% | Attributed educational content | MarketingLTB |
| Marketers using attribution partially/fully | 61% | Survey-based adoption measure | Gitnux |
Attribution Challenges Unique to Education & Coaching
Education marketers face attribution challenges that most B2B industries never encounter at scale. Enrollment journeys span 10–18 months at R1 research universities, while even selective private colleges see 10–16 month consideration periods with more than 500 annual applicants (Skolbot). Meta's default 7-day click attribution window misses the first 8 weeks of a typical 10-week research journey (Prooflytics), and Google Analytics 4 defaults to last non-direct click — equally misleading for these extended enrollment funnels.
VE3 Global identifies the core structural problem: most institutions that measure attribution use last-click, which hands 100% of credit to whatever the prospect touched immediately before applying. The decisive touch often happens in a CRM, student record system, or events platform that the web analytics tool cannot see at all, creating data silos that make accurate attribution nearly impossible without deliberate, sustained integration effort.
For coaching businesses, the challenge takes a different shape but is equally difficult to solve. Coaching sales cycles typically span 3–6 months and involve content engagement, webinar attendance, discovery calls, and peer referrals — touchpoints that span organic and paid channels in ways that neither Google Analytics nor most ad platform tracking can capture without supplemental infrastructure. Alternative Balance identifies 7 key attribution metrics for coaching: source attribution, customer acquisition cost, lifetime value, conversion rate, average revenue per client, retention, and client progress — most of which require direct CRM integration to track accurately. IntelliCoach and similar newer platforms are beginning to address this gap by providing automated lead source tracking that maps coaching discovery calls back to originating campaigns and content touchpoints.
Attribution Models Compared for Education Marketing
Choosing the right attribution model depends on your institution's size, monthly conversion volume, and technical infrastructure maturity. Skolbot's research maps specific institutional profiles to optimal model choices based on enrollment volume and decision cycle length, while Higher Education Marketing notes that GA4 currently supports only three attribution models for education marketers: data-driven attribution, paid and organic last click, and Google paid channels last click. Each model tells a fundamentally different story about which channels deserve budget — the choice directly impacts how you allocate spend.
| Model | How It Works | Ideal Institution Type | Key Limitation |
|---|---|---|---|
| Last-Click | 100% credit to final touch | Small programs, low conversion volume | Completely misses 10–18 month journey |
| First-Touch | 100% credit to initial contact | Awareness campaign measurement only | Ignores nurture and retargeting entirely |
| Linear | Equal credit across all touches | Long enrollment funnels, balanced view | Over-credits low-impact passive touches |
| Time-Decay | More credit to recent touches | Application-stage campaign optimization | Systematically undervalues early awareness |
| Position-Based (40/20/40) | Weighted first-mid-last split | Mid-size institutions, 500+ annual apps | Arbitrary weighting may miss key mid-funnel steps |
| Data-Driven (GA4) | ML-based credit allocation | R1 universities, 300+ conv./month | Requires high volume and outputs black-box logic |

ROI Measurement and Revenue Attribution in Education
Connecting ad spend to actual enrolled students remains the defining measurement challenge for education marketers. Cometly reports that cost per enrollment is the metric that matters most, with platforms focused on revenue tracking helping institutions connect ad spend directly to actual enrollment revenue rather than just lead volume. Noetic Marketer recommends multi-touch attribution as the standard framework for higher education, distributing credit across all touchpoints a student interacted with during their decision journey rather than crediting only the first or last interaction.
Colling Media's education practice measures inquiry-to-enrollment conversion rate and time-to-enrollment as primary attributed metrics, with retargeting attribution for nurture campaigns consistently showing the strongest ROI signal. Their segmented approach tracks three distinct attribution stages: awareness attribution for brand campaigns measured by aided recall and impression frequency, consideration attribution for content engagement measured by content completion rates and assisted conversions, and nurturing-stage attribution for retargeting campaigns measured by inquiry-to-enrollment conversion rate and time-to-enrollment duration.
For coaching businesses running Meta Ads or Google Ads, Cometly specifically recommends building custom CRM reports that show revenue by UTM source and campaign to reveal true cost per acquisition and return on ad spend — not just cost per lead, which can be deeply misleading when coaching conversion rates vary by 3–10× between channels. The coaching attribution path typically follows a distinct sequence: content engagement → lead event → discovery call booking → discovery call completion → client acquisition, and each transition stage needs separate tracking infrastructure to understand true channel contribution and identify where prospects drop out of the funnel.
Attribution Technology Adoption and Infrastructure
The martech landscape for education attribution is evolving rapidly, driven by both platform capabilities and institutional demand. Gitnux reports 61% of marketers use some form of marketing attribution partially or fully in 2026, while DigitalApplied tracks multi-touch adoption above 40% among surveyed teams with AI-attribution accuracy improving significantly year over year. Skolbot identifies Slate by Technolutions as the dominant CRM in U.S. higher education, offering attribution-friendly source-tracking fields natively without requiring a third-party overlay.
The EducationDynamics / UPCEA AI Readiness Report reveals that 65% of education staff now use AI or emerging tech in marketing and enrollment functions, up from 40% in 2024 — a 25-percentage-point jump in a single year. Among these AI applications, CRM-integrated attribution sees 31% adoption while dedicated data analytics tools reach 30% adoption. The coaching industry sits earlier in the adoption curve, with most independent coaches still relying on UTM-based tracking through basic analytics dashboards rather than dedicated MTA platforms. This creates a clear competitive advantage for coaching businesses that invest in proper data intelligence infrastructure — they can see which channels produce clients versus which merely produce leads, and allocate accordingly.
| Technology Layer | Education Adoption | B2B Average | Key Challenge |
|---|---|---|---|
| CRM with source tracking | 60–70% | 68% (MTA platform) | Data silo between admissions and marketing systems |
| Google Analytics 4 | 85–90% | 90%+ | Limited to only 3 attribution models |
| UTM parameter tracking | 70–80% | 75% | Manual implementation errors break attribution chains |
| Dedicated MTA platform | 25–35% | 68% (enterprise B2B) | Cost and multi-month implementation complexity |
| AI-powered attribution | 15–20% | 30% | Volume requirements exceed most education institutions |
| Offline event tracking | 10–15% | 25% | Open day and campus visit attribution remains manual |
Best Practices for Education & Coaching Attribution
- Extend attribution windows far beyond platform defaults — education's 10–18 month decision cycle means 7-day click windows miss 80%+ of the student journey. Set GA4 lookback to 90 days minimum and supplement with CRM-based attribution for the full lifecycle (Prooflytics).
- Connect your CRM to analytics bidirectionally — the decisive conversion touch often happens in your admissions CRM, student record system, or events platform. Bridge these data silos with UTM parameters plus CRM integration to create a unified attribution picture (VE3 Global).
- Track enrollment revenue, not just lead volume — set up revenue-based conversion events so ad platforms optimize toward actual enrollment or client acquisition rather than form fills that may never convert (Cometly).
- Calculate ROAS at the campaign level monthly and use it as the primary decision metric for scaling or pausing campaigns across all channels. Cost per lead alone is misleading when conversion rates vary dramatically by source (Cometly).
- Start with position-based attribution if you lack volume — institutions with fewer than 300 conversions per month cannot generate reliable data-driven attribution models. Position-based (40/20/40) provides a reasonable approximation until volume grows (Skolbot).
- For coaching businesses: track 7 core metrics religiously — source attribution, customer acquisition cost, lifetime value, conversion rate, average revenue per client, retention rate, and client progress in an integrated dashboard that connects marketing to revenue outcomes (Alternative Balance).
- Run MMM or incrementality tests at least annually — attribution models show correlation, not causation. Media mix modeling reveals true incremental impact per channel for budget planning and helps validate or correct your attribution model's outputs.
Frequently Asked Questions
What percentage of companies use marketing attribution?
57% of companies use some form of marketing attribution model in 2025, with multi-touch adoption reaching 75% and enterprise B2B firms with 2,000 or more employees leading at 84% MTA platform adoption. Despite this growth, only 31% of marketers are very confident in their current attribution setup.
Why is attribution harder for education marketers?
Education enrollment journeys span 10–18 months across dozens of touchpoints, far exceeding the 7-day click windows used by Meta and Google. Most institutions also maintain siloed data across admissions CRMs, student record systems, and event platforms that web analytics tools cannot access without deliberate integration.
What attribution model is best for education marketing?
Position-based attribution with a 40/20/40 weighting works well for most mid-size institutions with 500 or more annual applications. Data-driven attribution in GA4 is ideal for high-volume programs with 300 or more monthly conversions. Last-click attribution systematically undervalues awareness and consideration channels in long enrollment funnels and should be avoided.
How long does attribution tool implementation take?
The median attribution tool implementation time is 14.2 weeks for B2B organizations according to Starr Conspiracy. Education institutions should plan for additional time due to CRM integration requirements with systems like Slate by Technolutions, which is the dominant higher education CRM in the U.S. and requires custom source field configuration.
Sources
marketingltb.com
thestarrconspiracy.com
gitnux.org
cometly.com
click-vision.com
noeticmarketer.com
skolbot.ai
ve3.global
cufinder.io