



Table of contents

A 2026 ecommerce growth budget has three lines that actually move the needle: tech stack cost as a share of revenue, marketing spend against the 9.0%-of-revenue industry benchmark, and the technology line retailers overall are raising even while marketing budgets sit flat. This page prices each line with the published 2026 data behind it.
Key Takeaways
- Sub-USD 3 million brands spend 4 to 7% of revenue on their tech stack.
- Brands above USD 10 million can target 1.5 to 3% of revenue.
- Marketing budgets averaged 9.0% of company revenue in 2026.
- That is down from 9.4% of revenue in spring 2025.
- Overall marketing spend grew just 1.7% year over year.
- That is the smallest marketing spend increase since 2021.
- US retail technology budgets are projected at USD 113 billion in 2026.
- That is a 6.6% increase year over year.
- 52% of retailers invest USD 50 million-plus annually in digital technology.
- 28% of retailers spend USD 100-250 million annually on technology.
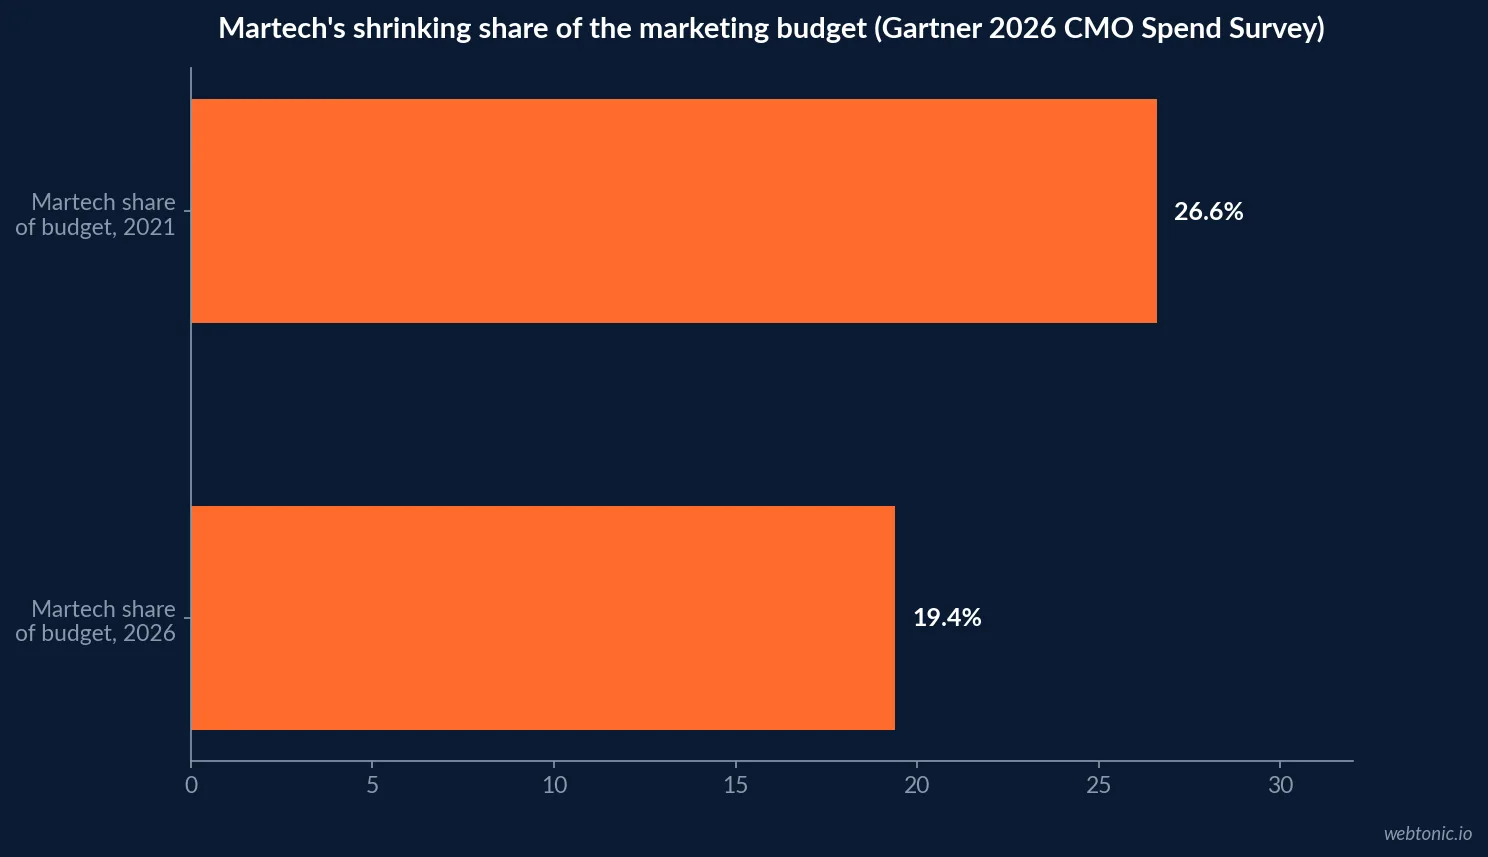
- Martech's share of the marketing budget fell to a five-year low of 19.4%.
- That share was 26.6% as recently as 2021.
- 62% of CMOs still plan to increase martech investment despite the shrinking share.
- NRF forecasts 2026 US retail sales growing 4.4% to USD 5.6 trillion.
- Ecommerce fulfillment network GMV growth decelerated from 15.4% to 13.4% in one quarter.
- Parcel shipping inflation reached 12.8% year over year over the same quarter.
Line one: the tech stack budget
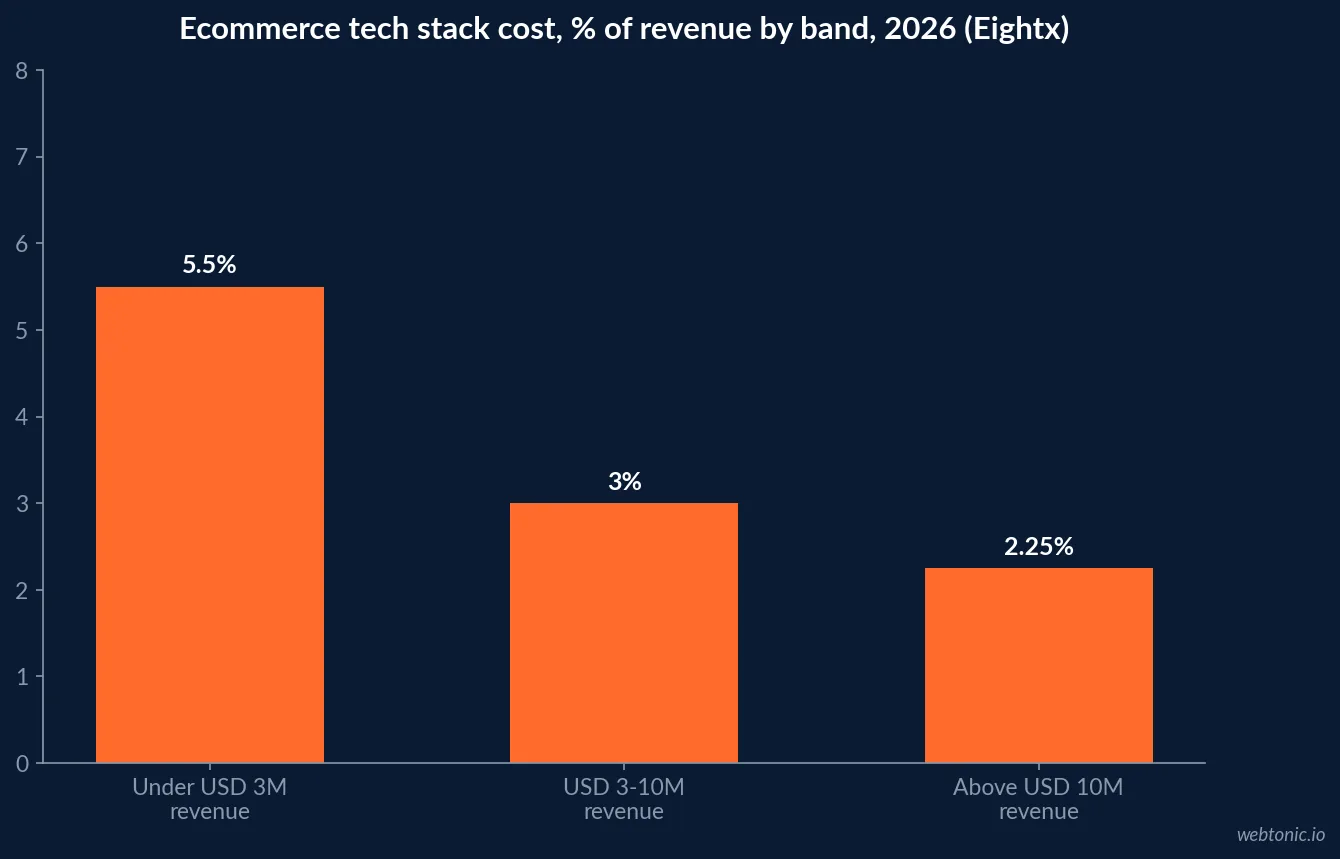
Eightx's 2026 benchmark, built on Storeleads data across 1.27 million US Shopify stores plus vendor pricing, finds sub-USD 3 million brands spending 4 to 7% of revenue on their tech stack, a share that compresses to 1.5 to 3% once a brand clears USD 10 million in revenue. Fixed platform costs - the CMS, the email platform, the reviews widget - do not scale down for a small store the way they scale up for a large one, which is exactly why the percentage looks worst at the bottom of the revenue curve.
A budget conversation that ignores revenue stage and asks for a flat percentage is asking the wrong question. The right question is: what stage is this store at, and what is the published band for that stage.
| Revenue band | Tech stack cost, % of revenue | Source | Why this band looks the way it does |
|---|---|---|---|
| Under USD 3 million | 4-7% | Eightx (Storeleads data, 2026) | Fixed platform costs against a small base |
| USD 3-10 million | 2-4% | Eightx (Storeleads data, 2026) | Scale starts absorbing fixed costs |
| Above USD 10 million | 1.5-3% | Eightx (Storeleads data, 2026) | Negotiated vendor rates, in-house tooling |
Line two: the marketing budget
The CMO Survey 2026 reports marketing budgets at 9.0% of company revenue and 9.6% of overall firm budgets, with total marketing spend growth of just 1.7% year over year - the smallest increase since 2021. That figure is down from 9.4% of revenue in the survey's spring 2025 edition, meaning marketing is being asked to do the same job on a slightly smaller relative envelope.
The same survey's headcount data adds context: marketing headcount growth is running roughly 50% lower year on year than in prior cycles, which is the practical reason so much of the 2026 ecommerce marketing conversation is about automation and consolidation rather than adding people.
| Marketing budget metric (2026) | Figure | Change vs. prior year | Source |
|---|---|---|---|
| Marketing budget, % of revenue | 9.0% | Down from 9.4% | The CMO Survey 2026 |
| Marketing budget, % of firm budget | 9.6% | Roughly flat | The CMO Survey 2026 |
| Marketing spend growth | 1.7% | Smallest since 2021 | The CMO Survey 2026 |
| Martech share of marketing budget | 19.4% | Down from 26.6% in 2021 | Gartner 2026 CMO Spend Survey (via Chief Marketer) |
Line three: the technology budget retailers are actually raising
Forrester's US Tech Forecast 2026 for Retail projects US retailers raising technology budgets to USD 113 billion in 2026, up 6.6% year over year, even while marketing budgets sit flat by the CMO Survey's measure. KPMG's 2026 Tech Report for Consumer & Retail found 52% of surveyed retailers investing USD 50 million or more annually in digital technology, with 28% spending between USD 100 and 250 million - concentration that sits almost entirely at the largest players, not the median independent store this page's benchmarks describe.
The gap between "retail technology budgets are rising 6.6%" and "the median small ecommerce brand's tech stack is 4-7% of a much smaller revenue number" is the gap between enterprise retail and the mid-market brands actually reading a benchmarking page like this one. Budget accordingly to scale, not to the headline percentage.
| Technology budget signal (2026) | Figure | Who it describes | Source |
|---|---|---|---|
| US retail technology budgets | USD 113 billion, +6.6% YoY | Enterprise retail, aggregate | Forrester |
| Retailers investing USD 50M+/yr in tech | 52% | Large, well-capitalized retailers | KPMG |
| Retailers investing USD 100-250M/yr | 28% | Largest retail technology spenders | KPMG |
| US 2026 retail sales forecast | USD 5.6 trillion, +4.4% | Total US retail, all channels | NRF |
The supply-chain cost line that eats into the growth budget
Deposco's Commerce Signal data shows why the growth budget conversation cannot stop at marketing and software: network GMV growth for the typical ecommerce operator decelerated from 15.4% to 13.4% within a single quarter of 2026, while parcel shipping inflation rose from 4.1% to 12.8% year over year across the same 13 weeks - more than three times the 3.9% rate of consumer price inflation. A growth budget that only funds acquisition and ignores the rising cost of shipping the resulting order is funding half the problem.
NRF's 2026 forecast puts total US retail sales growth at 4.4% to USD 5.6 trillion, meaning most ecommerce brands are operating inside a market growing modestly, not explosively - a further argument for pricing a growth budget against realistic share gains rather than a hoped-for market tailwind.
What the fastest-growing operators budget differently
The brands outperforming these averages are not spending dramatically more; they are spending in a different order. Eightx's benchmark notes that the operators hitting the low end of their revenue band's tech-stack range (1.5% rather than 3%, for example) consistently fund retention and fulfillment tooling before adding a new acquisition channel tool, on the logic that a cheaper repeat order beats a marginally better ad platform. The CMO Survey reports a similar pattern at the marketing-budget level: companies growing profitably are not the ones with the largest budgets, but the ones citing the clearest data connecting each budget line to a measured outcome.
That is the practical argument for building the three-line budget this page describes instead of one blended growth number: each line can be defended, tracked and cut independently when a quarter tightens, instead of the whole growth budget taking an even, undifferentiated haircut.
| Budget discipline (2026) | What it looks like | Why it beats a blended budget | Source |
|---|---|---|---|
| Stack spend tied to revenue band | 1.5-7% depending on stage | Scales down automatically as revenue grows | Eightx |
| Marketing spend tied to a published benchmark | 9.0% of revenue reference point | Gives finance an external anchor | The CMO Survey |
| Martech consolidation before expansion | Cut tools before adding tools | Matches the 19.4% shrinking martech share | Gartner (via Chief Marketer) |
| Parcel/shipping cost tracked separately | Its own budget line, not folded into marketing | Avoids silent margin erosion | Deposco |
How to build the request
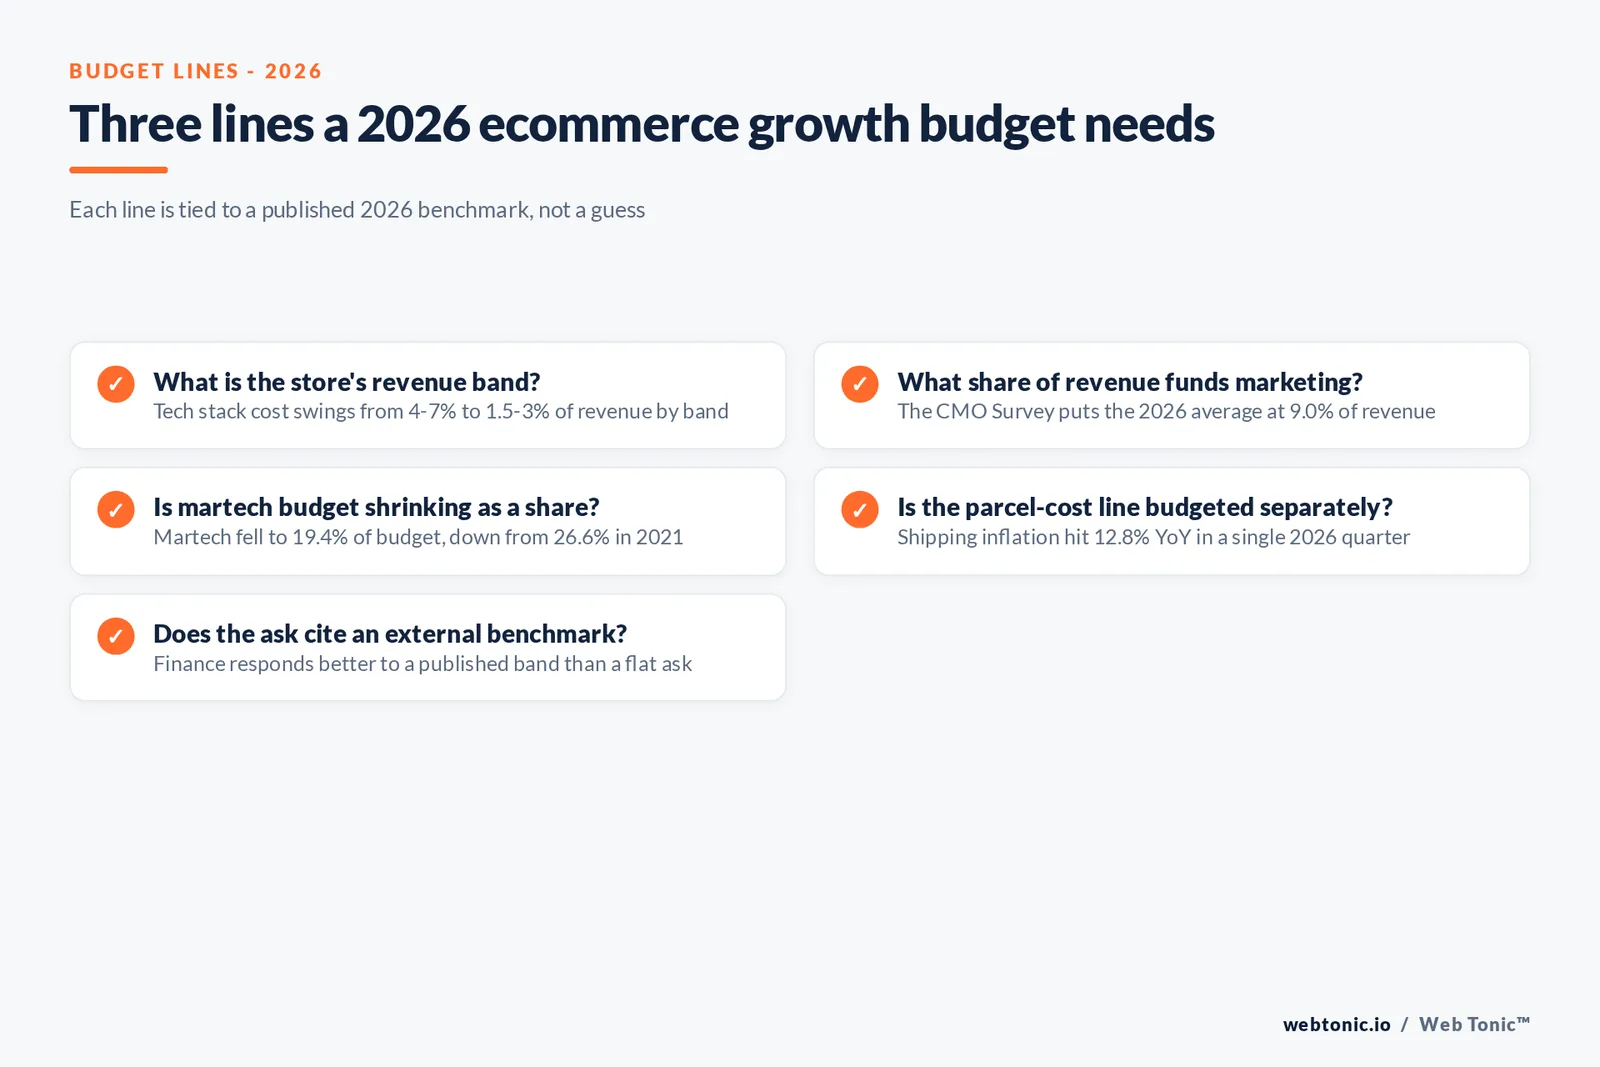
State the revenue band first, cite the published tech-stack percentage for that band, add the CMO Survey's 9.0%-of-revenue marketing benchmark as the external reference point, and flag the parcel-cost line separately so it does not get silently absorbed into the marketing budget when margins tighten. That structure gives finance three defensible numbers instead of one negotiated total.
Our data and analytics practice builds exactly this kind of budget model against a brand's own numbers, our growth marketing team prices the acquisition side of the same plan, and a scoping conversation is the fastest way to see where a specific ecommerce business sits against these 2026 bands.
Frequently Asked Questions
How much should an ecommerce brand spend on its tech stack as a percentage of revenue?
Eightx's 2026 benchmark, built on Storeleads data across 1.27 million US Shopify stores plus vendor pricing, finds sub-USD 3 million brands typically spending 4 to 7% of revenue on their tech stack because fixed platform costs loom large against a small revenue base, while brands above USD 10 million in revenue can realistically target 1.5 to 3%. There is no single right number; the right number depends entirely on where a brand sits on that revenue curve.
What share of revenue goes to marketing for a typical ecommerce brand in 2026?
The CMO Survey's 2026 edition put marketing budgets at 9.0% of company revenue and 9.6% of overall firm budgets, down from 9.4% of revenue in its spring 2025 edition, with total marketing spend growth of just 1.7% - the smallest increase since 2021. Retail and ecommerce-specific breakouts inside the same survey run a few points above the all-industry average, reflecting how acquisition-dependent the category still is.
Are retailers actually increasing technology budgets in 2026?
Yes, in aggregate. Forrester's US Tech Forecast 2026 for retail projects US retailers raising technology budgets to USD 113 billion in 2026, up 6.6% year over year, even as individual marketing budgets stay flat. KPMG's 2026 Tech Report for Consumer & Retail found 52% of surveyed retailers investing USD 50 million or more annually in digital technology, with 28% spending between USD 100 and 250 million - concentrated mostly at the largest players, not the median store.
Where does martech fit inside a shrinking marketing budget?
It is shrinking as a share, even as total marketing budgets hold roughly flat. Gartner's 2026 CMO Spend Survey found martech's share of the marketing budget down to a five-year low of 19.4%, from 26.6% in 2021, even though 62% of CMOs say they plan to increase martech investment. Read together with flat overall budgets, that means ecommerce managers are being asked to consolidate tools and prove ROI on each one rather than add new line items.
How should an ecommerce manager justify a growth budget increase to finance?
Anchor the request in a stated percentage of revenue and a stated tech-spend band, not a flat dollar ask. A sub-USD 3 million brand justifying 4 to 7% of revenue on its stack is a different conversation than a USD 20 million brand justifying 1.5 to 3%, and citing the CMO Survey's 9.0% marketing-to-revenue benchmark gives finance a published external reference point rather than an internal negotiation.
Sources
Eightx - Average ecommerce tech stack cost as % of revenue, 2026 benchmark
The CMO Survey - Highlights and Insights Report 2026
Chief Marketer - Gartner CMO Spend Survey, 2026
Forrester - US Tech Forecast 2026 for Retail
KPMG - 2026 Tech Report, Consumer & Retail
NRF - 2026 Annual Retail Sales Forecast FAQ
Deposco - Commerce Signal, quarterly US fulfillment intelligence


