



Table of contents
Fortune 500 companies spend an estimated USD 47 billion a year on PR, but the more useful 2026 story is the split underneath that number: budgets of USD 20,000-plus a month more than doubled year over year while sub-USD 5,000 budgets shrank. This page tracks where earned media spend is actually concentrating in 2026, by company size and industry.
Key Takeaways
- Fortune 500 companies spend an estimated USD 47 billion a year on PR.
- That is a median of 0.25% of revenue.
- The top 50 spenders account for 55-60% of that total.
- The bottom 200 combined spend less than the top three tech companies alone.
- Budgets of USD 20,000-plus a month more than doubled year over year.
- They rose from 4% to 8.8% of surveyed respondents.
- Sub-USD 5,000 monthly budgets fell from 34.1% to 25.7% of respondents.
- Consumer packaged goods firms allocate 14-18% of marketing budgets to earned media.
- Financial services firms allocate roughly 8-11%.
- Some regulated categories allocate as little as 0.3% of total marketing budget.
- Cision surveyed more than 1,800 journalists for its 2026 State of the Media Report.
- PR is increasingly cited as a primary newsroom source under pressure.
- Gartner's forecast is cited as pointing toward PR budgets roughly doubling by 2027.
- Median revenue at first PR investment dropped from USD 7.5 million to about USD 4.1 million.
- The median PR-to-revenue ratio spans a 10x spread between sectors.
How much large companies spend on earned media
5WPR's 2026 research into Fortune 500 marketing allocation estimates the cohort spends roughly USD 47 billion annually on PR, a median of 0.25% of revenue, with a roughly 10x spread in that ratio between the highest- and lowest-spending sectors. The top 50 companies by spend account for 55 to 60% of the entire USD 47 billion figure, while the bottom 200 combined spend less than the top three technology companies do individually.
That concentration means industry-average PR-spend figures are close to meaningless for a mid-market brand. The number that matters is the sector-specific allocation, not the blanket Fortune 500 average.
| Metric (2026) | Figure | Source | What it shows |
|---|---|---|---|
| Fortune 500 annual PR spend | ~USD 47 billion | 5WPR research | A concentrated, top-heavy category |
| Median PR spend as % of revenue | 0.25% | 5WPR research | A thin sliver even at scale |
| Top 50 companies' share of total spend | 55-60% | 5WPR research | Spend concentrates at the very top |
| Spread in PR-to-revenue ratio across sectors | ~10x | 5WPR research | Sector matters more than company size |
The budget split by company tier
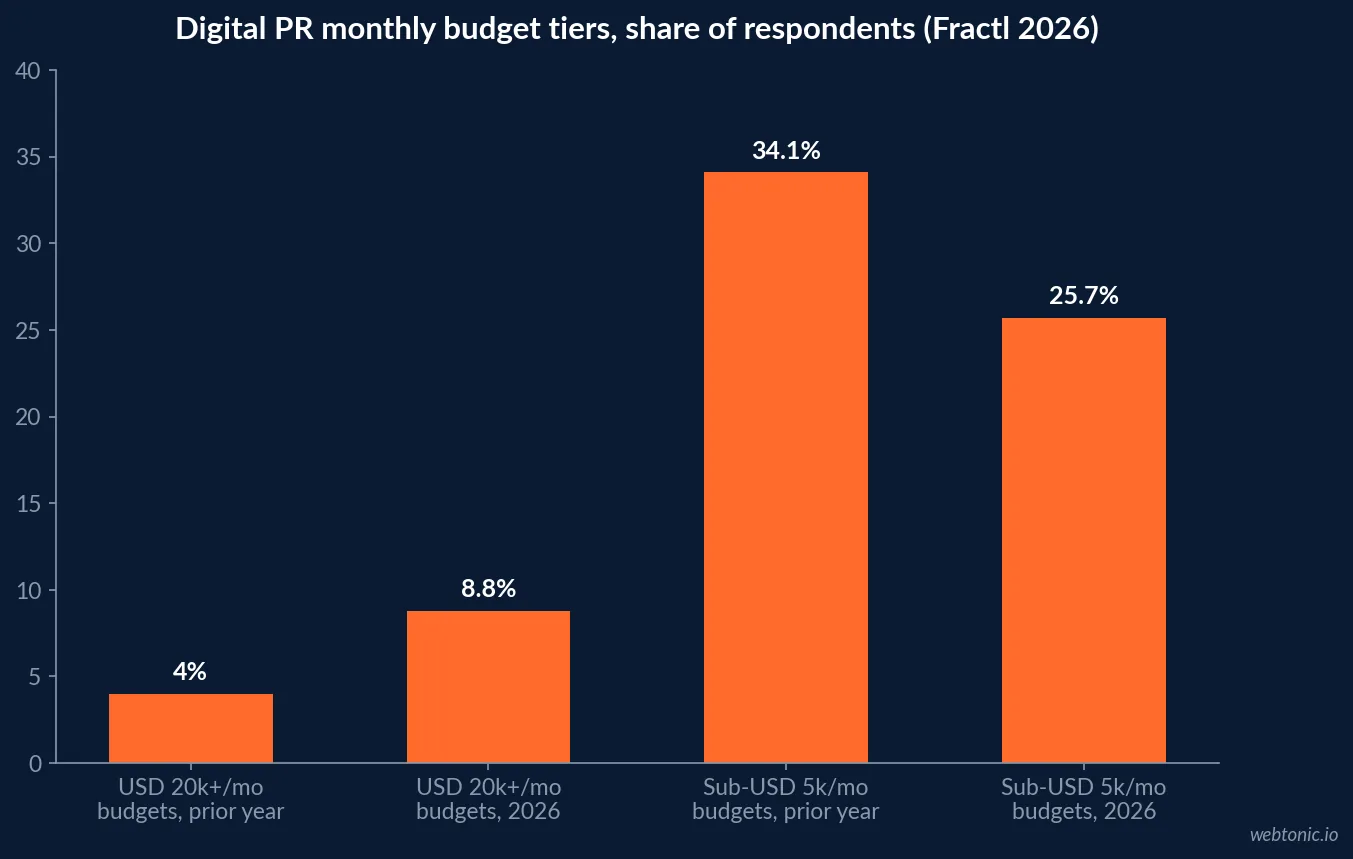
Fractl's State of Digital PR 2026 report tracked monthly digital PR budgets across its respondent base and found high-end budgets of USD 20,000 or more a month more than doubling year over year, from 4% to 8.8% of respondents, while sub-USD 5,000 monthly budgets dropped from 34.1% to 25.7% over the same period. The middle tiers held roughly steady, meaning the market is polarizing rather than uniformly growing.
For a brand deciding how to compete for coverage in 2026, that split is the more actionable number than any blended average: it describes two increasingly distinct games, one played at USD 20,000-plus a month and one played under USD 5,000, with less room forming in between.
| Monthly PR budget tier | Share of respondents, prior year | Share of respondents, 2026 | Change |
|---|---|---|---|
| USD 20,000+ per month | 4% | 8.8% | More than doubled |
| Sub-USD 5,000 per month | 34.1% | 25.7% | Down 8.4 points |
How earned media allocation differs by industry
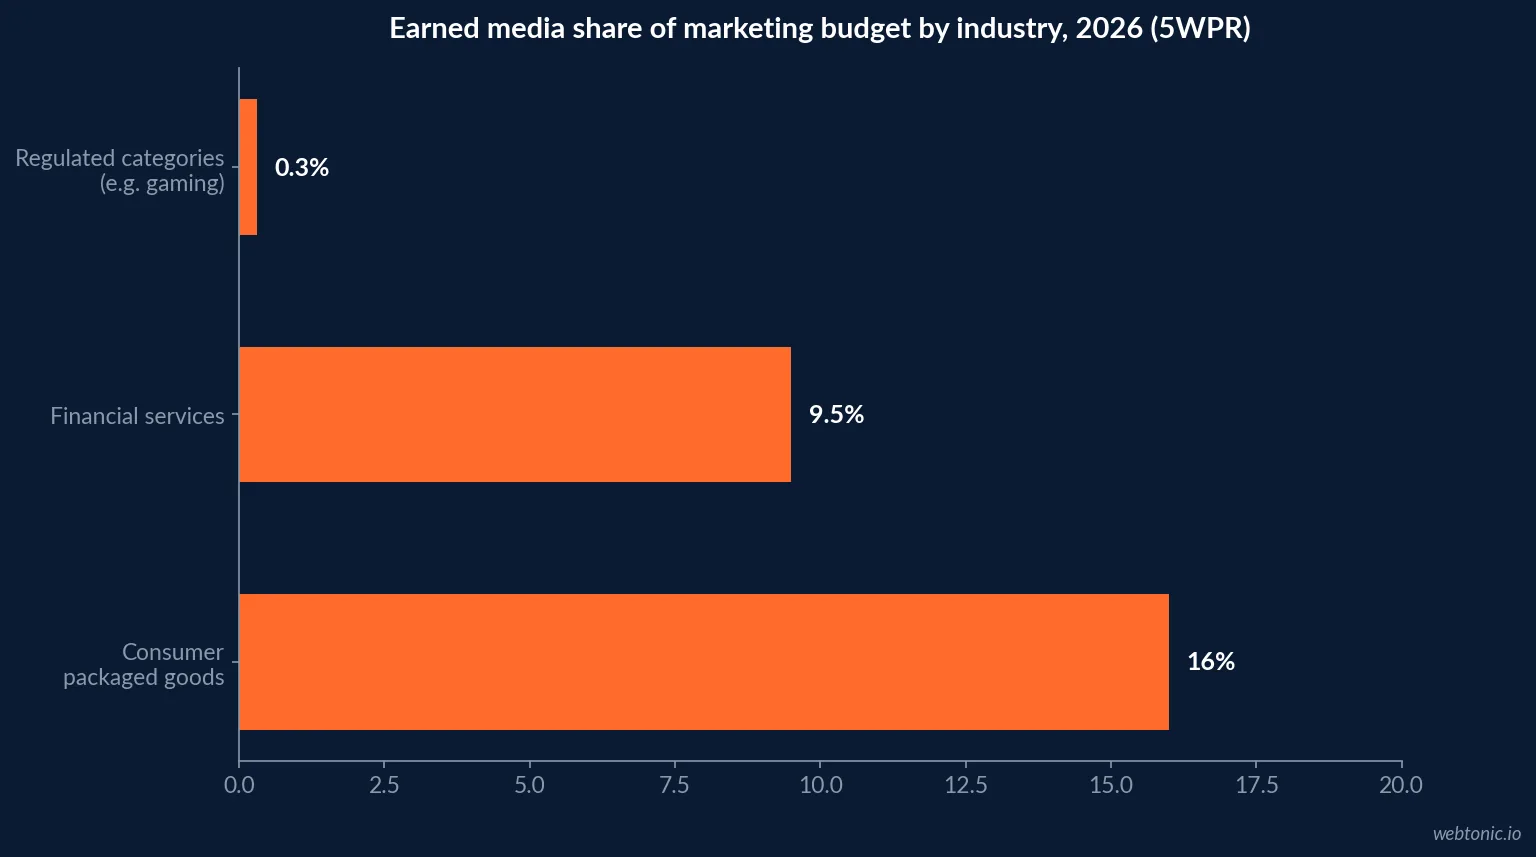
5WPR's Fortune 500-adjacent research finds consumer packaged goods companies allocating 14 to 18% of marketing budgets to earned media and communications, financial services firms allocating roughly 8 to 11%, and some regulated categories - the research specifically cites sports betting and gaming operators - allocating as little as 0.3% of total marketing budget to the category. The gap reflects how differently earned coverage functions depending on regulatory scrutiny, brand-trust requirements and category newsworthiness.
A CPG brand and a regulated-category brand pulling the same industry-average PR benchmark off a generic report are working from numbers that do not describe their category at all.
| Industry (2026) | Earned media / PR share of marketing budget | Source | Why it differs |
|---|---|---|---|
| Consumer packaged goods | 14-18% | 5WPR research | High reliance on media trust and reviews |
| Financial services | 8-11% | 5WPR research | Regulatory disclosure shapes messaging |
| Regulated categories (e.g. gaming) | ~0.3% | 5WPR research | Compliance constraints limit earned pitching |
Why AI search is reshaping the earned media argument
Cision's 2026 State of the Media Report, based on a survey of more than 1,800 journalists, found PR increasingly positioned as a primary source for story ideas inside newsrooms operating under heavier pressure and thinner staffing - a shift that raises the practical value of a well-placed earned story beyond its immediate audience. 5WPR's own read of Gartner's forecast frames this as one reason PR and earned media budgets could effectively double by 2027, on the logic that AI assistants weight earned, non-paid coverage heavily when answering brand questions.
Whether or not that specific doubling materializes, the direction is consistent across every source on this page: budgets are moving toward the high end of the spend curve, and toward brands that can point to sustained, credible coverage rather than a single press release.
When companies are starting to fund PR
A survey of CEOs distributed via PR Newswire in 2026 found the median revenue at which a company makes its first PR investment dropping from USD 7.5 million in 2023 to approximately USD 4.1 million in 2026 - companies are funding earned media roughly 45% earlier in their growth curve than they were three years ago. The same survey found the share of executives who see PR as strategic to their goals rising from 70% in 2023 to a 16-point jump within three years.
Read alongside Fractl's budget-tier data, the story is consistent: earned media is being funded earlier and, at the high end, more heavily, even as the entry-level tier shrinks. Both signals point the same direction - toward PR as a deliberate, earlier line item rather than a discretionary one added once a brand is already large.
| When companies invest in PR (2026) | Figure | Change vs. 2023 | Source |
|---|---|---|---|
| Median revenue at first PR investment | ~USD 4.1 million | Down from USD 7.5 million | PR Newswire CEO survey, 2026 |
| Executives seeing PR as strategic | Higher, up sharply | +16 points in 3 years | PR Newswire CEO survey, 2026 |
What the AI-search shift means for measurement
A budget line is only defensible if it can be measured, and earned media's measurement problem has historically been its weakest point next to paid media's clean click-through data. Cision's 2026 survey of journalists points at part of the fix: if PR is increasingly the source material newsrooms build stories from, then coverage volume and placement quality become leading indicators for the AI-citation visibility that 5WPR's Gartner analysis expects to matter more through 2027. That reframes earned media measurement away from advertising-value-equivalent metrics and toward tracking whether a brand's own facts and framing show up, cited, in both traditional coverage and AI-generated answers.
Budgets built around that measurement shift look less like a flat monthly retainer and more like a program with two connected goals: securing coverage in outlets an AI engine is likely to crawl and cite, and making sure the underlying facts a journalist would cite are structured and available on the brand's own site in the first place.
| Measurement shift (2026) | Old approach | New approach | Why it matters |
|---|---|---|---|
| What earned media is measured against | Advertising value equivalent | AI-citation visibility | Reflects how discovery is changing |
| What counts as a placement | Any mention, any outlet | Outlets AI engines are likely to crawl | Not all coverage carries equal weight |
| Where the budget goes first | Pitching volume | Structured facts + pitching together | Coverage needs citable source material |
How to size an earned media budget for 2026
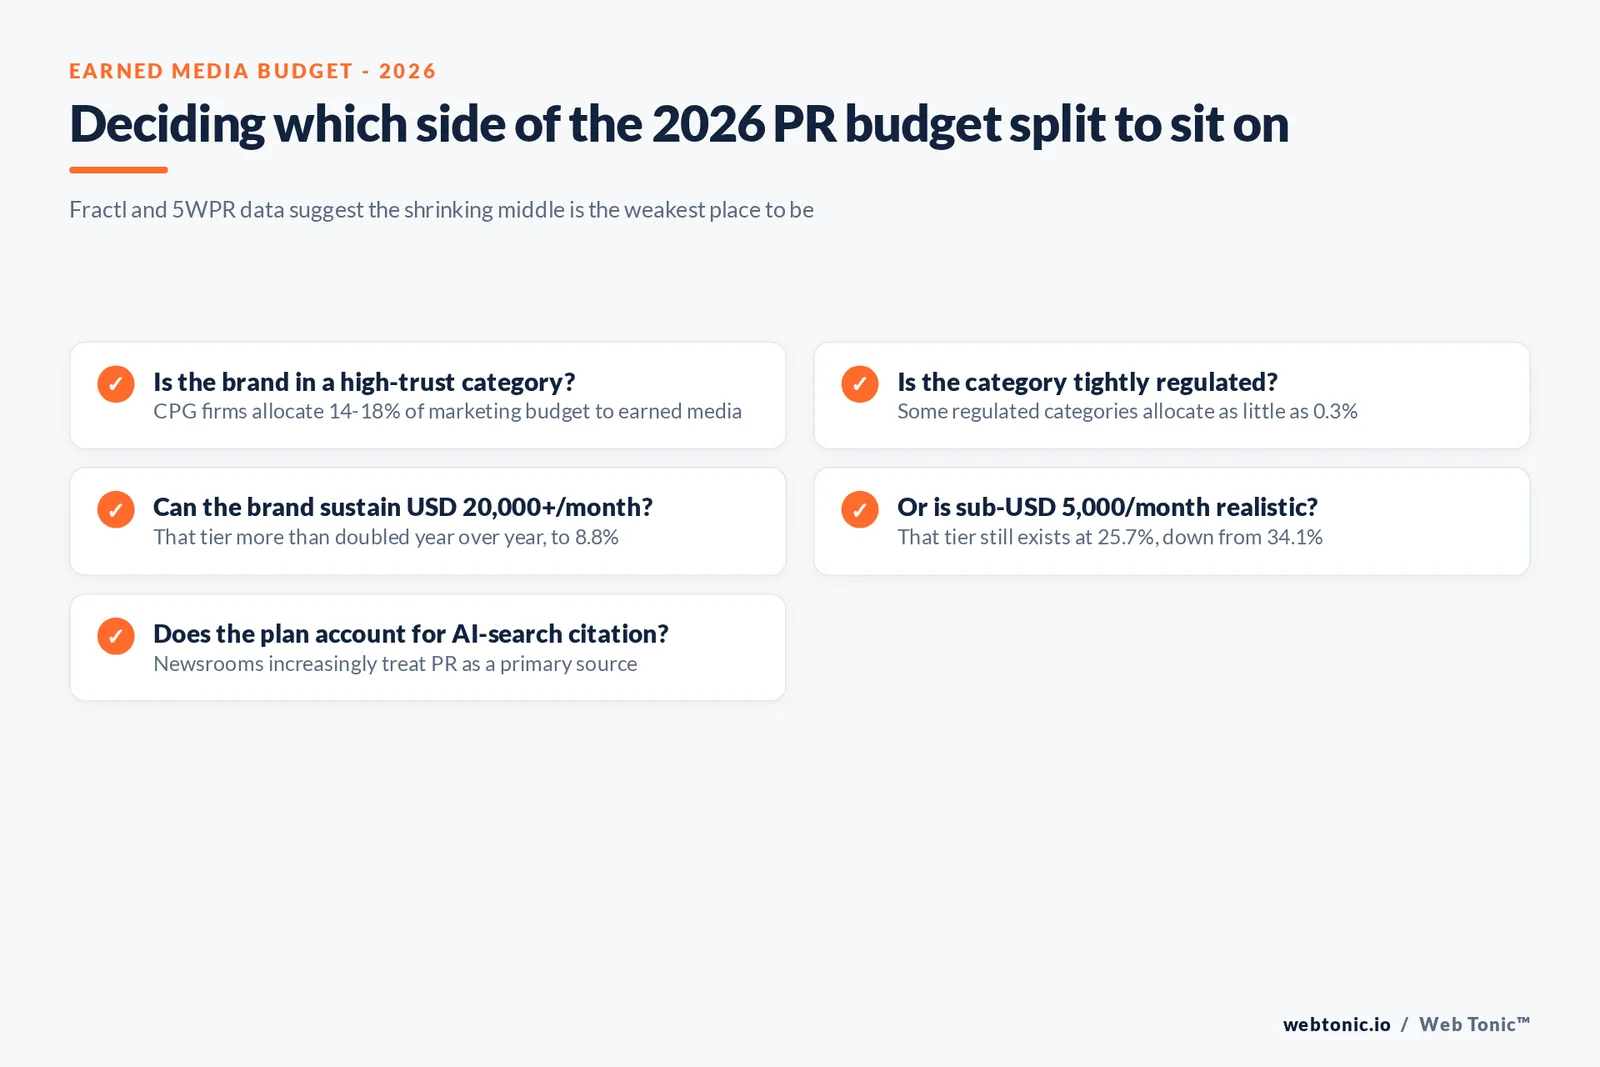
Start with the industry band, not the Fortune 500 average: a CPG brand budgeting off the 14-18% benchmark and a regulated-category brand budgeting off 0.3% are answering entirely different questions. Then decide deliberately which side of Fractl's budget split a brand can sustain — the shrinking middle tier is, by the data, the least differentiated place to sit.
Our growth marketing team builds earned and paid media plans together rather than as separate budget silos, our data practice tracks the resulting citation and coverage volume, and a scoping conversation is the fastest way to see where a specific brand's category and size point on these 2026 benchmarks.
Frequently Asked Questions
How much do large companies actually spend on earned media and PR?
5WPR's Fortune 500 PR Spend Transparency Study estimates the cohort spends roughly USD 47 billion annually on PR at a median of 0.25% of revenue, with the top 50 companies by spend accounting for 55 to 60% of that total. The bottom 200 companies combined spend less than the top three technology companies individually — earned media budgets are concentrated, not evenly distributed.
Are digital PR budgets growing or shrinking in 2026?
Growing at the top and shrinking at the entry level. Fractl's State of Digital PR 2026 report found budgets of USD 20,000 or more per month more than doubling year over year, from 4% to 8.8% of respondents, while sub-USD 5,000 monthly budgets fell from 34.1% to 25.7% of respondents over the same period. The middle of the market is being squeezed toward one end or the other.
How does earned media spend vary by industry?
Meaningfully. Data compiled in 5WPR's 2026 research on Fortune 500 marketing allocation shows consumer packaged goods companies putting 14 to 18% of marketing budgets toward earned media and communications, versus 8 to 11% for financial services firms and closer to 0.3% of total marketing budget for some regulated categories like sports betting operators, reflecting how differently earned coverage functions across regulatory and brand-trust environments.
Why is AI search changing how companies think about PR budgets?
Because a large share of what AI assistants cite when answering brand questions is earned, non-paid coverage rather than advertising. Cision's 2026 State of the Media Report, based on a survey of more than 1,800 journalists, found PR increasingly positioned as a primary source for story ideas inside high-pressure newsrooms, and 5WPR's own analysis of Gartner's PR budget forecasts frames this as a reason budgets could effectively double by 2027 as AI engines replace some traditional search behavior.
What is the practical earned-media budget lesson for a mid-market brand in 2026?
That the industry-wide averages hide a bimodal split: a mid-market brand competing for coverage against companies spending USD 20,000-plus a month is fighting a different battle than one still operating on a sub-USD 5,000 retainer. Fractl's data suggests the practical move is deciding deliberately which side of that split a brand can sustain, rather than drifting in the shrinking middle where budgets are least effective.
Sources
5WPR - Fortune 500 PR spend and industry allocation research, 2026
5WPR - PR Spend Transparency Study press coverage
5WPR - Gartner's PR budget forecast through 2027
Fractl - The State of Digital PR in 2026
Cision - 2026 State of the Media Report
PR Newswire - Survey of CEOs on PR investment acceleration, 2026


