Table of contents
Which SMS message type actually converts? Three ecommerce vendors - Klaviyo, Postscript, and Omnisend - publish their own 2026 SMS benchmark data from a combined base of hundreds of thousands of merchants, and lining their numbers up side by side is more useful than any single report on its own.
Key Takeaways
- Klaviyo's median SMS campaign click rate is 5.6%, rising to 10.44% for the top 10% of senders.
- Klaviyo's median SMS flow click rate is 9.65%, and top performers exceed 16.6%.
- SMS flows drive 45.2% of total SMS revenue from just 7.6% of sends (Klaviyo).
- SMS flows generate about 8x the revenue-per-recipient of campaign sends (Klaviyo).
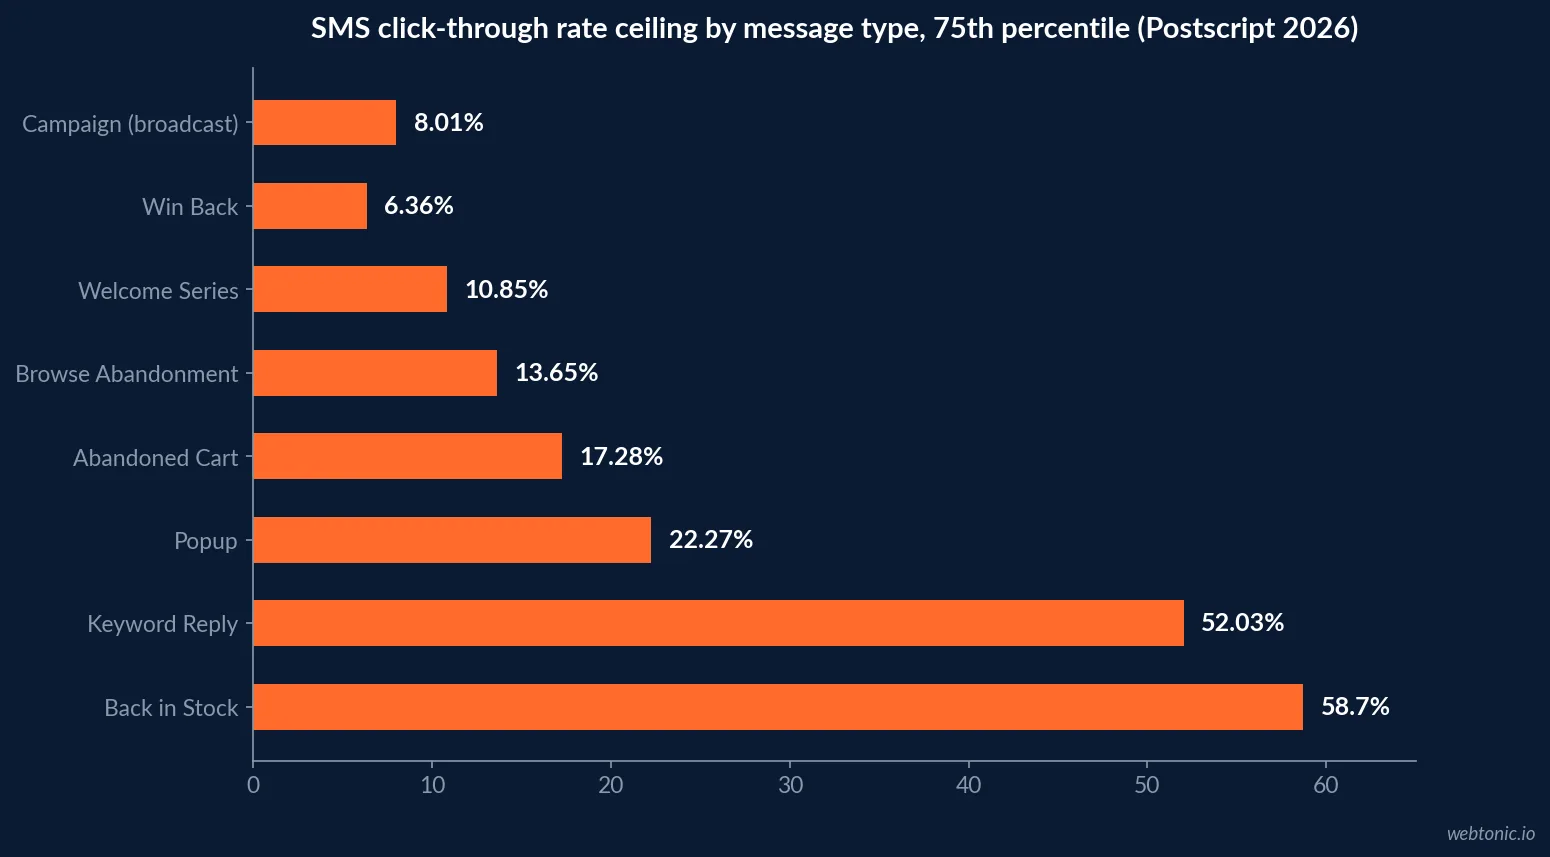
- Omnisend's 2026 annual average SMS campaign CTR is 12.39% across 246M+ sends.
- Automated SMS reaches a 20.34% CTR versus 12.39% for one-off campaigns (Omnisend).
- Automation conversion rate is 0.78% versus 0.12% for campaigns - a 6.5x gap (Omnisend).
- December SMS campaign CTR hits 23.92%, up from 3.47% in January (Omnisend).
- Back-in-stock alerts post a 36.71-58.70% click rate, the top message type in Postscript's data.
- Keyword-reply flows post a 14.67-52.03% click rate, second-highest in the same dataset.
- Plain broadcast campaigns are the weakest format, at 2.87-8.01% CTR (Postscript).
- SMS revenue per recipient by flow ranges from USD 1.83 to USD 6.15 across ecommerce categories (Klaviyo).
- Campaign deliverability runs 96.6% versus 92.8% for automations (Omnisend).
- Campaign average order value is USD 125.06 versus USD 95.28 for automations (Omnisend).
- Postscript's dataset is built from 17,000+ Shopify stores across 2025 sends.
Why three vendor benchmarks, not one
Ecommerce SMS is unusual among marketing channels in that its three largest platforms all publish their own annual benchmark report, each from a different slice of the market: Klaviyo's 2026 SMS benchmarks draw on over 183,000 customers, Postscript's 2026 SMS Benchmarks analyze 17,000-plus Shopify stores, and Omnisend's 2026 report covers 246 million-plus campaign sends and 20 million-plus automation sends. None of the three numbers should be read as "the" SMS click rate - each reflects that platform's own merchant base and message mix - but together they show the same pattern from three independent angles: automated, triggered SMS consistently outperforms one-off broadcast campaigns.
| Metric | Campaigns | Flows/Automations | Source |
|---|---|---|---|
| Median / average click rate | 5.6% (Klaviyo median) / 12.39% (Omnisend avg) | 9.65% (Klaviyo) / 20.34% (Omnisend) | Klaviyo, Omnisend |
| Top-10% click rate | 10.44% (Klaviyo) | 16.6% (Klaviyo) | Klaviyo |
| Conversion / order rate | 0.27% (Klaviyo) / 0.12% (Omnisend) | 1.9% (Klaviyo) / 0.78% (Omnisend) | Klaviyo, Omnisend |
| Deliverability | 96.6% | 92.8% | Omnisend |
| Average order value | USD 125.06 | USD 95.28 | Omnisend |
| Share of SMS revenue | 54.8% (Klaviyo, from 92.4% of sends) | 45.2% (Klaviyo, from 7.6% of sends) | Klaviyo |
Benchmarks by message type
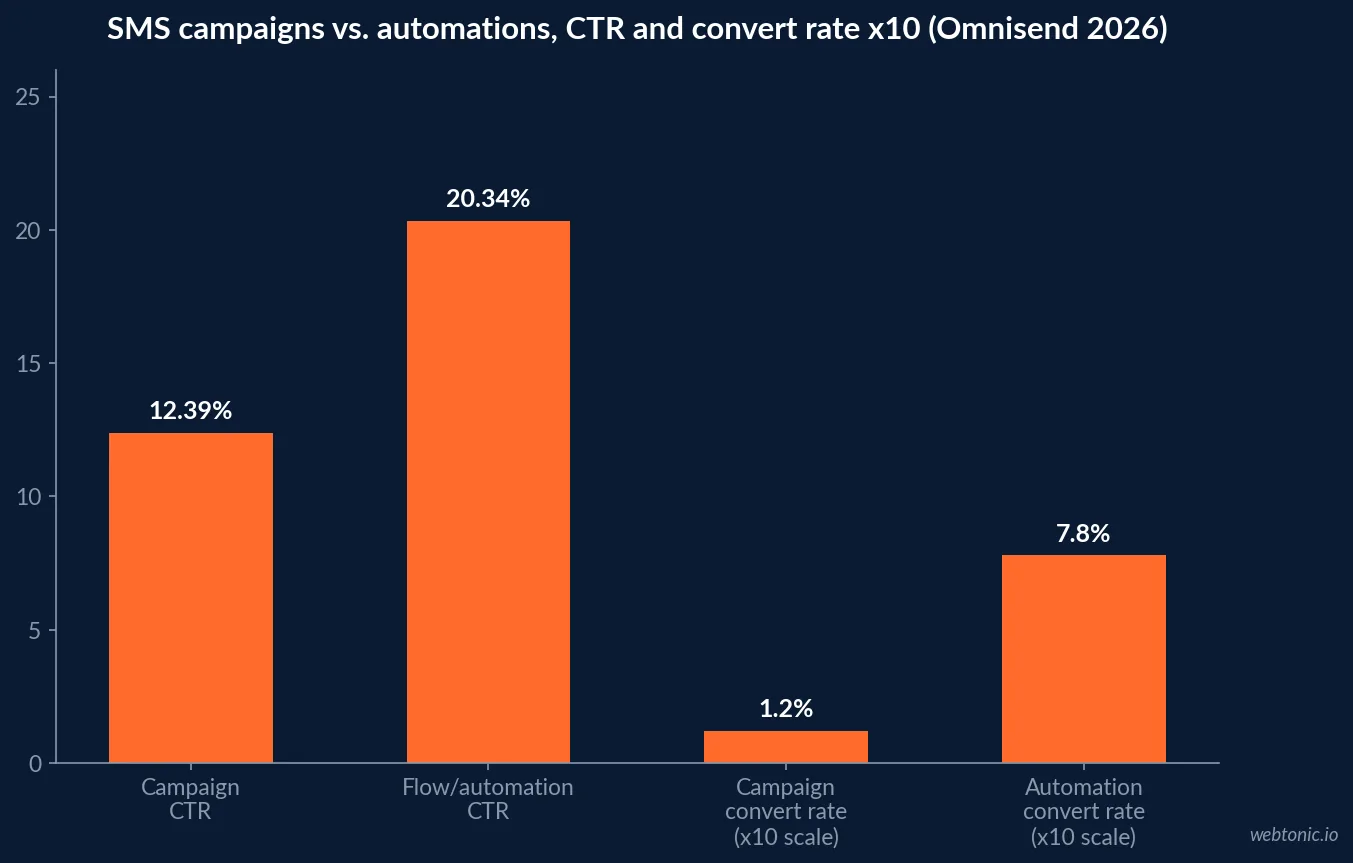
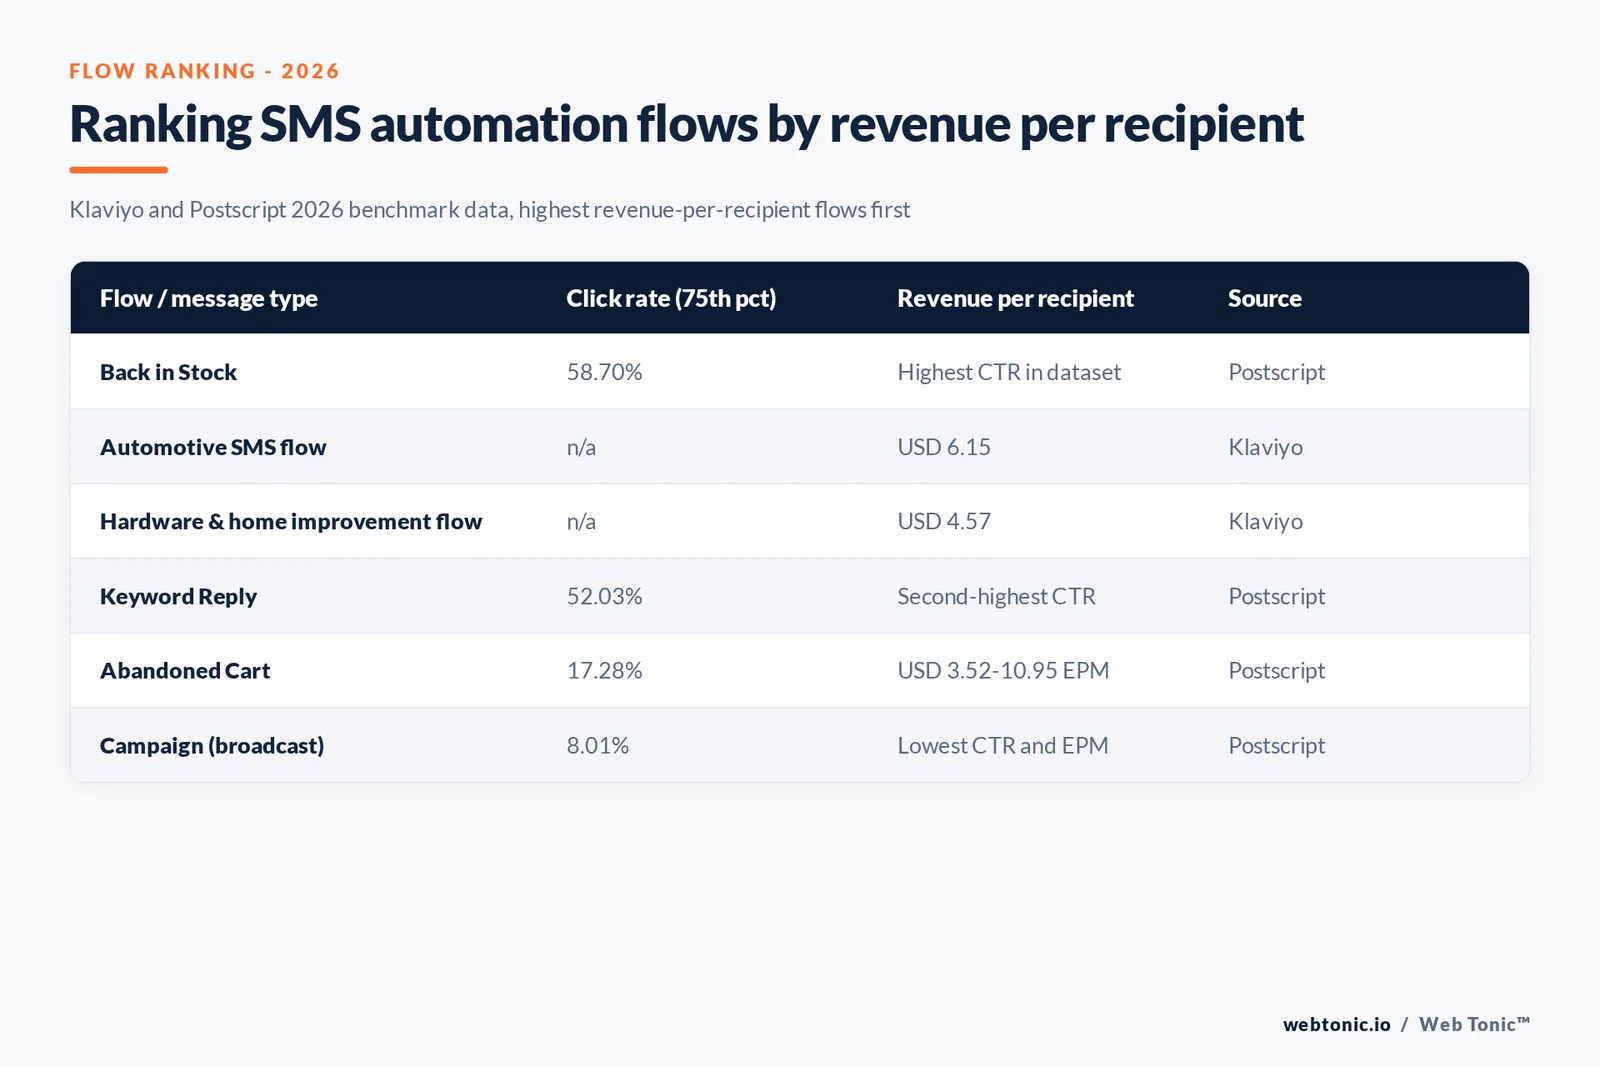
Postscript's 2026 SMS Benchmarks report breaks performance out by the specific automation trigger rather than a single flow average, using its 25th-to-75th percentile range across its 17,000-plus Shopify store base. Back-in-stock alerts lead every category at a 36.71% to 58.70% click rate, followed by keyword-triggered replies at 14.67% to 52.03%. Plain broadcast campaigns rank lowest at 2.87% to 8.01% - the same gap Klaviyo and Omnisend see between flows and campaigns, just measured message type by message type instead of as one blended average.
| Message type (Postscript 2026) | CTR, 25th pct | CTR, 75th pct | Convert rate, 25th-75th pct |
|---|---|---|---|
| Back in Stock | 36.71% | 58.70% | 7.18-13.80% |
| Keyword Reply | 14.67% | 52.03% | 1.31-15.70% |
| Popup | 11.34% | 22.27% | 9.55-25.56% |
| Link Clicked | 4.88% | 18.48% | 0.27-0.74% |
| Abandoned Cart | 9.53% | 17.28% | 3.97-7.84% |
| Welcome Series | 4.65% | 10.85% | 0.67-2.67% |
| Post Purchase | 4.68% | 14.26% | 0.45-1.51% |
| Win Back | 2.72% | 6.36% | 0.20-0.89% |
| Browse Abandonment | 7.38% | 13.65% | 1.01-2.38% |
| Campaign (broadcast) | 2.87% | 8.01% | 0.12-0.54% |
Revenue per recipient swings hard by category
Klaviyo's 2026 report also breaks SMS revenue-per-recipient out by ecommerce category, and the spread is far wider on flows than on campaigns. Campaign revenue-per-recipient stays in a tight USD 0.26 to USD 0.36 band across every category the report tracks, but flow revenue-per-recipient ranges from USD 1.83 in food and beverage to USD 6.15 in automotive - evidence that triggered SMS captures category-specific buying moments that a generic broadcast cannot.
| Category (Klaviyo 2026) | Campaign RPR | Flow RPR | Flow-to-campaign ratio |
|---|---|---|---|
| Automotive | USD 0.35 | USD 6.15 | 17.6x |
| Hardware & home improvement | USD 0.26 | USD 4.57 | 17.6x |
| Home & garden | USD 0.32 | USD 3.74 | 11.7x |
| Sporting goods | USD 0.34 | USD 3.30 | 9.7x |
| Electronics | USD 0.28 | USD 3.48 | 12.4x |
| Jewelry | USD 0.31 | USD 2.85 | 9.2x |
| Health & beauty | USD 0.32 | USD 2.09 | 6.5x |
| Food & beverage | USD 0.34 | USD 1.83 | 5.4x |
The seasonal swing nobody prices into a flat benchmark
Omnisend's month-by-month 2026 breakdown shows why an annual average alone is a weak planning number. SMS campaign CTR climbs from 3.47% in January to 11.82% in September, then jumps to 18.02% in October, 20.28% in November, and 23.92% in December as BFCM and holiday sends land. Conversion rate does not follow the same curve - it stays inside a narrow 0.10% to 0.14% band all year, which means the holiday click surge brings more browsing, not a proportional lift in orders per click.
| Month (Omnisend 2026) | SMS campaign CTR | Conversion rate | USD revenue per SMS |
|---|---|---|---|
| January | 3.47% | 0.13% | USD 0.148 |
| April | 7.41% | 0.14% | USD 0.173 |
| July | 6.76% | 0.11% | USD 0.145 |
| September | 11.82% | 0.11% | USD 0.139 |
| October | 18.02% | 0.10% | USD 0.133 |
| November | 20.28% | 0.13% | USD 0.162 |
| December | 23.92% | 0.12% | USD 0.147 |
What a message actually costs to send
Ecommerce SMS platforms increasingly bill per message rather than per credit, which is a very different cost model than the email marketing statistics most merchants budget against first. Klaviyo's own mobile messaging documentation confirms its rate model bundles carrier fees into a single per-message, per-country dollar rate, with US SMS priced at 1 credit and MMS at 3 credits under its legacy schedule, and its free plan including USD 5 of mobile messaging a month. That matters for a merchant's math because the message-type table above shows keyword and back-in-stock flows earning back that per-message cost many times over on click rate alone, while a plain campaign send is the format most likely to underperform its own cost.
| Cost input | Published figure | Source |
|---|---|---|
| Klaviyo free plan mobile messaging allowance | USD 5/mo included | Klaviyo |
| Klaviyo legacy US SMS rate | 1 credit per segment | Klaviyo |
| Klaviyo legacy US MMS rate | 3 credits per segment | Klaviyo |
| Carrier fees | Bundled into Klaviyo's per-message rate | Klaviyo |
Consent still gates every list, regardless of platform
None of the three vendor reports above changes what the law requires before a message can be sent, and it does not change what keeps a subscriber on the list either - our customer retention statistics page covers the churn side of that relationship. US texting still runs on the Telephone Consumer Protection Act (47 U.S.C. 227) and its implementing rule, 47 CFR 64.1200, which sets quiet-hours windows and requires a working STOP opt-out on every send - the same rule set that gates B2B industrial SMS, covered in our SMS marketing statistics hub. High click rates on a back-in-stock flow do not substitute for documented opt-in consent on the list that flow sends to.
Turning three benchmark sets into one testing plan
The practical use of three separate vendor reports is not to average them into one number, but to set a testing order. Start where the combined data shows the widest, most consistent gap: shifting spend from broadcast campaigns toward the automated triggers that Postscript, Klaviyo, and Omnisend all independently rank highest. A merchant with no back-in-stock flow live is leaving the single best-performing message type in the entire Postscript dataset unused, regardless of which platform they run.
- Ship the highest-ranked flow first - back-in-stock and keyword reply, per Postscript's percentile data, outperform every other trigger before a single new campaign is written.
- Budget flows and campaigns separately - Omnisend's data shows they behave like two different channels with different deliverability and AOV profiles, not one blended average.
- Plan holiday sends around the seasonal curve - a December CTR near 24% is not a sign the list suddenly got better; it is the same list behaving the way it does every November-December, per Omnisend's month-by-month figures.
- Check revenue per recipient by category before copying a "10x" claim - Klaviyo's own data shows that multiple varies from about 5x to nearly 18x depending on the vertical.
- Re-confirm consent before scaling send volume - a higher click rate on more sends is only a win if the list underneath it was built to spec.
Why SMS clicks so much harder than email
Omnisend's own 2026 report makes the email comparison directly: across the same merchant base, SMS campaigns averaged a 12.39% click-through rate while email campaigns averaged 0.74% - a gap the report attributes to a short message landing directly on a subscriber's lock screen instead of competing with a crowded inbox, subject line, and promotions tab. That does not make SMS a replacement channel; email still carries far higher send volume at a far lower per-message cost. It does mean a merchant judging SMS against email CTR benchmarks alone will always see SMS look artificially dominant, when the more useful comparison is SMS against SMS - flow against campaign, message type against message type - the way the tables above are built.
| Channel (Omnisend 2026, same merchant base) | Average click-through rate |
|---|---|
| SMS campaigns | 12.39% |
| Email campaigns | 0.74% |
Ecommerce SMS at a glance
| Metric | Campaigns | Automations/Flows | Source |
|---|---|---|---|
| Click-through rate (annual avg/median) | 5.6-12.39% | 9.65-20.34% | Klaviyo, Omnisend |
| Conversion / order rate | 0.12-0.27% | 0.78-1.9% | Klaviyo, Omnisend |
| Best message type by CTR | n/a | Back in Stock, 36.71-58.70% | Postscript |
| Revenue per recipient range | USD 0.26-0.36 | USD 1.83-6.15 | Klaviyo |
| Peak seasonal CTR | 23.92% (December) | n/a - campaign-specific | Omnisend |
Frequently Asked Questions
What is a good SMS click-through rate for an ecommerce brand?
It depends heavily on message type. Klaviyo's 2026 SMS benchmarks, built from over 183,000 customers, report a 5.6% median click rate for campaigns and 9.65% for flows, with the top 10% of senders reaching 10.44% (campaigns) and 16.6% (flows). Omnisend's 2026 dataset, from 246 million-plus SMS campaign sends, puts the annual campaign average at 12.39% - the gap between the two reports shows why the message type and the sending platform both matter more than a single headline number.
Do automated SMS flows really outperform one-off campaigns?
Yes, on every metric both vendors track. Omnisend's 2026 data shows automations reaching a 20.34% CTR and a 0.78% conversion rate against 12.39% and 0.12% for campaigns. Klaviyo's data shows the same shape: flows account for just 7.6% of sends but drive 45.2% of total SMS revenue, at roughly 8x the revenue-per-recipient of campaign sends.
Which SMS message type converts the most for ecommerce?
Back-in-stock alerts and keyword-reply flows lead Postscript's 2026 benchmark set, sourced from over 17,000 Shopify stores. Back-in-stock messages post a 36.71% to 58.70% click rate (25th to 75th percentile), and keyword-triggered flows post 14.67% to 52.03%. Plain broadcast campaigns are the weakest performer in the same dataset, at 2.87% to 8.01%.
How much does SMS revenue vary by ecommerce category?
Widely. Klaviyo's 2026 industry data shows SMS flow revenue-per-recipient ranges from about USD 1.83 in food and beverage to USD 6.15 in automotive, even though campaign revenue-per-recipient stays in a tighter USD 0.26 to USD 0.36 band across every category it tracks. Flows amplify category differences that campaigns mostly flatten out.
Is SMS click-through rate seasonal?
Sharply. Omnisend's month-by-month 2026 data shows SMS campaign CTR climbing from 3.47% in January to 23.92% in December, with the steepest jump in the BFCM and holiday window (October at 18.02%, November at 20.28%). Conversion rate barely moves across that same span, staying between 0.10% and 0.14% all year - more clicks in December, not proportionally more orders.
Sources
Klaviyo - 2026 SMS Marketing Benchmarks
Postscript - 2026 SMS Benchmarks (17,000+ Shopify stores)
Omnisend - SMS marketing benchmarks 2026
Klaviyo Help Center - mobile messaging rates
Klaviyo - pricing
eCFR - 47 CFR 64.1200 delivery restrictions