



Table of contents
E-commerce retention marketing has its own lifecycle math, and it is not SaaS net revenue retention. The honest 2026 benchmark set comes from subscription-billing platforms and loyalty vendors that actually process e-commerce transactions, and it puts a real number on what a repeat-customer program has to beat before it is worth the budget line.
Key Takeaways
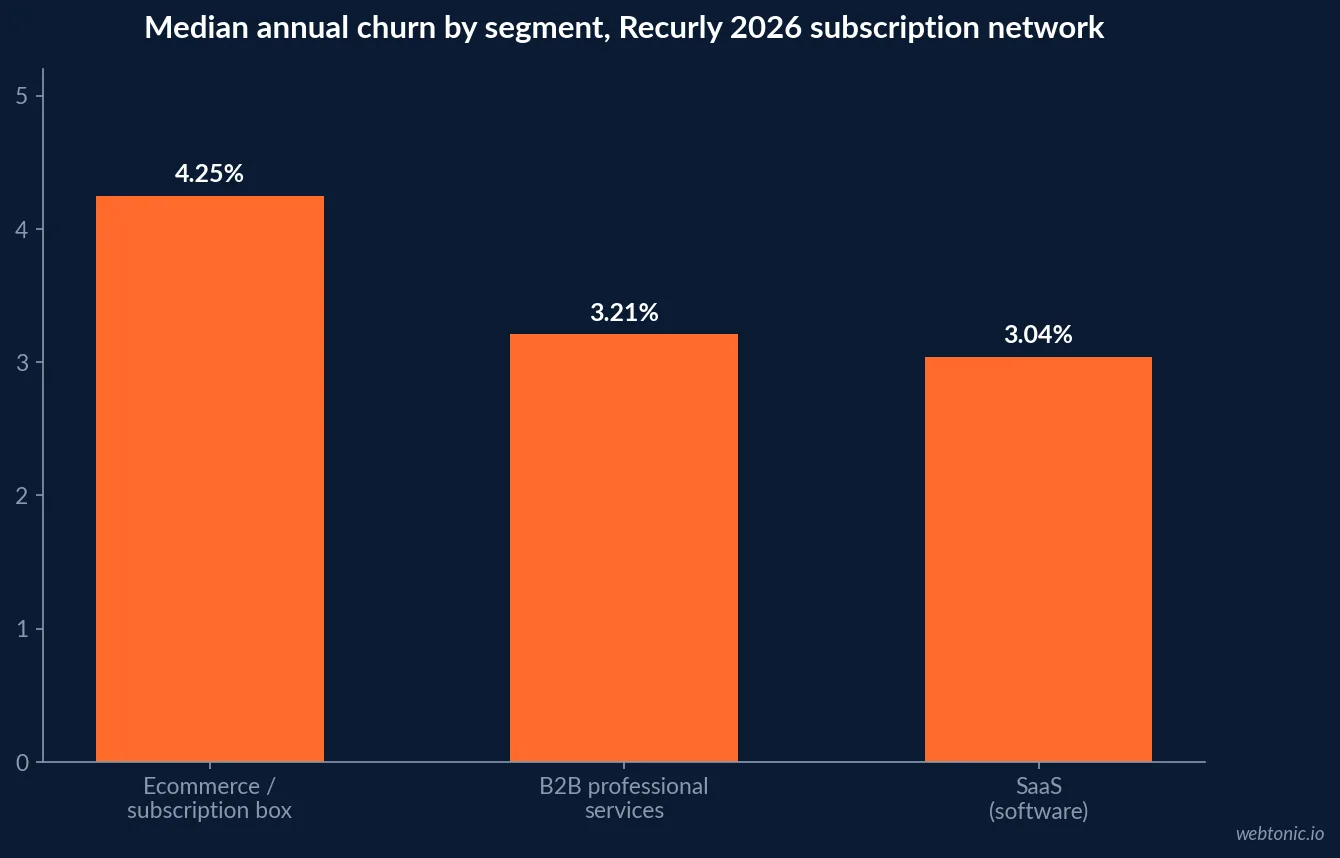
- Median annual e-commerce churn is 4.25% on Recurly's 2026 network data.
- That compares with 3.04% for SaaS and 3.21% for B2B professional services.
- A 5-point retention gain lifts profit 25% to 95% per Bain's original loyalty research.
- New e-commerce customers cost 20% to 40% more to acquire than at a traditional retailer.
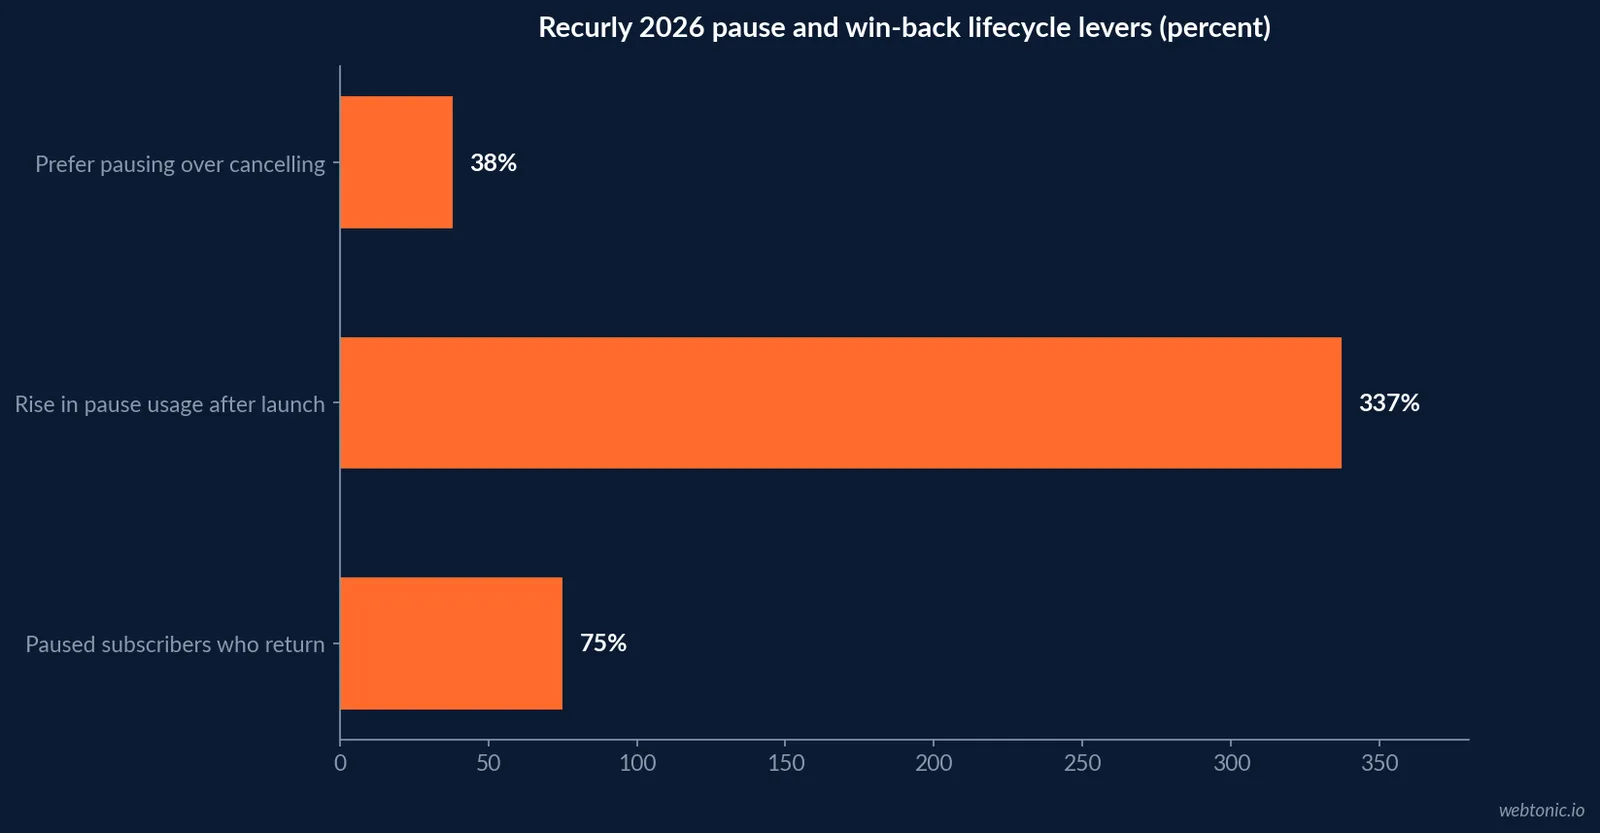
- 38% of consumers prefer pausing a subscription over cancelling it.
- Pause usage rose 337% once brands added a pause option.
- Three in four paused subscribers return within months.
- About 1 in 4 new subscriptions comes from a previously cancelled customer.
- Loyalty members deliver an average 8.5x ROI within 90 days, per Yotpo.
- Revenue per redeeming customer rises 164.4% in that same 90-day window.
- Purchases per customer rise 71.3% for loyalty redeemers versus non-redeemers.
- Beauty brands see a 66.3% revenue-per-redeemer lift, the strongest category in the data.
- Apparel brands see a 50.2% lift and health brands 56.7%.
- SaaS churn on the same network sits at 3.04%, the low end of the comparison set.
- Enterprise ($250+ ARPC) involuntary churn is just 0.18%, the tightest band measured.
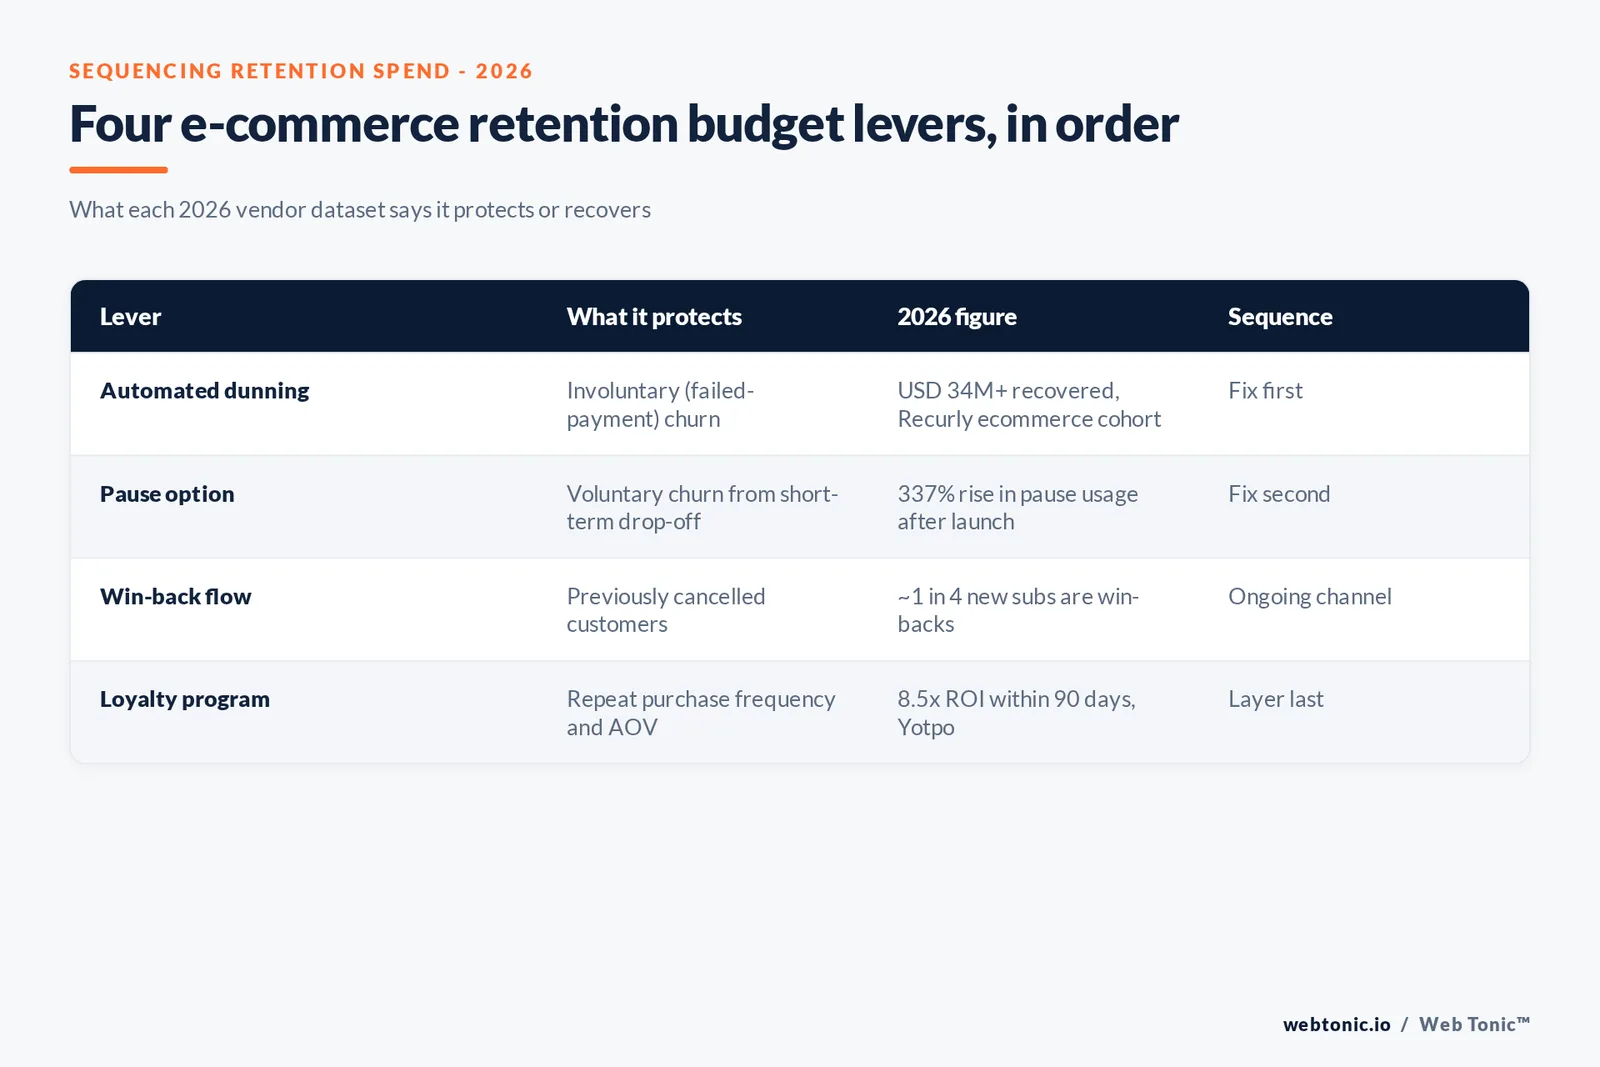
- Recurly's ecommerce cohort recovered over USD 34 million through automated dunning.
- The $10-25 ARPC band carries a 4.29% median churn, the highest of any price tier.
- Below 2% annual churn is Recurly's bar for genuinely strong retention.
Why SaaS retention math does not transfer to e-commerce
Recurly's July 2026 churn benchmarks, built from its network of subscription businesses, treat ecommerce and subscription-box brands as their own vertical rather than folding them into a blended average. The reasoning is direct: ecommerce runs lower price points and more impulse-driven signups, which produces structurally higher voluntary churn than a seat-based SaaS contract ever sees.
That is the first budgeting decision a retention marketer has to make - stop benchmarking against a SaaS NRR dashboard someone saw in a different deck, and start from the subscription-commerce number.
| Segment (Recurly 2026 network) | Median annual churn | Best-quartile churn | Note |
|---|---|---|---|
| Ecommerce / subscription box | 4.25% | Not separately broken out | Lower ARPC, impulse signups |
| SaaS (software) | 3.04% | 1.78% or below | Longer contracts, higher switching cost |
| B2B professional services | 3.21% | 1.83% or below | Multi-seat, longer cycles |
| Enterprise, $250+ ARPC | 3.54% overall | 0.18% involuntary | High-value payment methods |
| $10-25 ARPC band | 4.29% overall | - | Highest churn-risk band measured |
The old research behind why retention still pays
The case for retention spend traces back to Bain's loyalty-economics research, republished on bain.com: a 5-percentage-point increase in customer retention increases profits by 25% to 95%. This is old research, not a 2026 finding, and Bain has not re-run the exact percentages recently - but the same report also applied the methodology specifically to e-commerce categories (books, apparel, groceries, consumer electronics) and found the loss-then-profit pattern was exaggerated online: new customers cost 20% to 40% more to acquire for a pure-play apparel e-tailer than for a retailer with physical stores. That acquisition-cost gap is the real argument for spending on the customers you already have.
| Lifecycle fact | Figure | Source | What it means for budget |
|---|---|---|---|
| Retention-to-profit lift | 25% to 95% per 5-point retention gain | Bain (original research) | Old, but directionally still cited by Bain |
| Apparel e-tailer CAC premium | 20% to 40% higher than store-based retailer | Bain | Repeat customers carry more margin online |
| Ecommerce median churn | 4.25% a year | Recurly 2026 | The number a program has to beat |
| Well-run subscription business zone | 2% to 4% annual churn | Recurly 2026 | Target band before declaring victory |
| Involuntary churn recoverable | USD 34M+ recovered, ecommerce cohort | Recurly 2026 | Dunning before loyalty spend |
Pause and win-back: the retention lever with the numbers attached
Recurly's 2026 State of Subscriptions data, cited directly on its churn-benchmarks page, gives the clearest ROI case for a specific tactic: 38% of consumers prefer pausing a subscription over cancelling outright. Brands that built a pause flow saw pause usage climb 337%, and three out of four of those paused subscribers came back within months. Recurly also reports that roughly 1 in 4 new subscriptions on its network now originates from a previously cancelled customer - win-back is already a channel, whether or not it is budgeted as one.
What a loyalty program adds on top of churn control
Yotpo's loyalty benchmarks report, built from a subset of Yotpo merchant data across verticals, found that within 90 days brands running a loyalty program saw an average 8.5x ROI, a 164.4% increase in revenue per redeeming customer, an 88.5% increase in average revenue per customer versus non-redeemers, and a 71.3% increase in purchases per customer. This is vendor-labelled research from 2022, run on Yotpo's own customer base rather than an independent audit, and the lift is not uniform - beauty brands saw the strongest revenue-per-redeemer gain in the data.
| Vertical (Yotpo loyalty data) | Revenue-per-redeemer lift, 90 days | Metric type | Read with caution because |
|---|---|---|---|
| Beauty | 66.3% | Vendor data, own customer base | No sample size disclosed |
| Health | 56.7% | Vendor data | 2022 study, not re-run for 2026 |
| Apparel & accessory | 50.2% | Vendor data | Category mix skews the average |
| All categories (blended) | 164.4% | Vendor data | Blended figure hides the spread above |
| All categories, purchase frequency | 71.3% more purchases per redeemer | Vendor data | Correlates with, does not prove, loyalty caused it |
Sequencing the budget: fix the leak before you add the reward
The sequencing that Recurly's own data supports is unglamorous: recover involuntary churn first. Its network recovered USD 34 million-plus for the ecommerce cohort alone through automated dunning - card retries, updated-card matching, bank-side fraud flag handling - money that a loyalty program cannot touch because those subscribers never chose to leave. Only once voluntary churn sits inside Recurly's 2% to 4% "well-run" band does a loyalty spend start compounding instead of papering over a leak.
Our growth marketing practice builds that sequencing into the first 90 days of any ecommerce retention engagement, before a single loyalty tier gets designed.
What the ARPC band changes about the churn number
Recurly's data breaks involuntary churn out by average revenue per customer (ARPC), and the spread is wide: at $250+ ARPC, involuntary churn is just 0.18%, because higher-value subscribers use better payment methods and resolve failed payments proactively. At $10 to $25 ARPC - the band most impulse-priced ecommerce subscriptions sit in - involuntary churn rises to 1.30%, and that band carries the highest overall median churn in the entire dataset at 4.29%. A retention budget aimed at a $15 box subscription needs a different dunning cadence than one aimed at a $300 quarterly box.
| ARPC band (Recurly 2026) | Involuntary churn | Overall median churn | Budget implication |
|---|---|---|---|
| $250+ | 0.18% | 3.54% | Light-touch dunning is enough |
| $25-$250 (typical mid-tier) | Between the two bands | Between the two bands | Standard retry cadence |
| $10-$25 | 1.30% | 4.29% (highest measured) | Aggressive dunning plus a pause option |
What personalization has to do with retention spend
Retention and personalization budgets are increasingly the same line item. Twilio Segment's State of Personalization 2024 report, based on a survey of 521 director-level and above B2B and B2C decision-makers at companies with 500-plus employees, found 89% believe personalization is invaluable to business success over the next three years, 72% already use a customer data platform, and 48% use a data warehouse alongside it. None of that is ecommerce-specific, and the survey is now a year old against a fast-moving category, but it explains why the churn and loyalty data above increasingly gets read next to a personalization stack rather than a standalone email tool.
| Personalization fact (Twilio Segment 2024, n=521) | Figure | Why it matters to retention |
|---|---|---|
| Leaders calling personalization invaluable | 89% | Sets the internal budget mandate |
| Using a customer data platform | 72% | Infrastructure retention programs run on |
| Using a data warehouse for personalization | 48% | Where churn and loyalty data actually lives |
| Expect AI-driven daily workflows by 2025 | 59% | Context for how fast this stack is changing |
How this compares with the broader retention and loyalty picture
This page focuses on ecommerce specifically; for the cross-industry retention and customer lifetime value baselines this builds on, see our breakdowns of customer retention statistics and customer lifetime value statistics, and for the loyalty-program mechanics behind the Yotpo figures above, our loyalty program statistics page. Reading all three together is the fastest way to see where an ecommerce number sits against the wider category.
What this does not tell you
None of these datasets measure your brand. Recurly's numbers are network medians across its customer base, Yotpo's are drawn from its own merchants, and Bain's are old enough that Bain itself frames them as the reason retention matters rather than this year's figure. Use the bands as the bar to clear, then instrument your own churn and loyalty-redemption rate before assuming any of these percentages apply directly to your catalog. Our data and analytics practice builds that instrumentation before a retention program launches, not after.
What Shopify's own merchant data adds to the picture
Shopify's own platform blog, publishing a 2026 ecommerce sales strategy guide, cites its own 2025 survey of 500 Shopify merchants (established stores with two-plus years on the platform, across Australia, Canada, the UK, Ireland, New Zealand and the US) and independently confirms the same Recurly pause finding used above - "3 out of 4 subscribers who pause eventually return to the service." Shopify also reports natively on new-versus-returning customers as a built-in KPI, which is the operational starting point for any retention program on the platform: you cannot budget against a churn number you are not already tracking inside your own store reports.
Frequently Asked Questions
What is a normal churn rate for an e-commerce or subscription box brand?
Recurly's July 2026 network data, drawn from more than 2,000 subscription businesses, puts median annual churn for ecommerce and subscription-box brands at 4.25%, above the 3.04% median for SaaS and the 3.21% median for B2B professional services. Recurly attributes the gap to lower price points and impulse-driven signup patterns rather than a weaker product. Anything above 5% for a comparable ARPC band is worth investigating regardless of what the category average says.
Does retention really move profit as much as the old research says?
Bain's original loyalty-economics work, republished on bain.com, found that a 5-percentage-point increase in customer retention increased profits by 25% to 95% - and that applying the same lifecycle analysis to e-commerce categories including books, apparel, groceries and consumer electronics showed the same early-loss, later-profit pattern, only more exaggerated online because new e-commerce customers cost 20% to 40% more to acquire than customers at a traditional retailer with physical stores. That research is decades old and Bain has never re-run the exact percentages for 2026, so treat it as the reason retention matters, not as this year's number.
What does a working win-back or pause program actually recover?
Recurly's 2026 State of Subscriptions data, cited on its own churn-benchmarks page, found 38% of consumers prefer pausing a subscription over cancelling it outright. Brands that added a pause option saw pause usage increase by 337%, and three in four of those paused subscribers returned within months. Recurly also reports that roughly one in four new subscriptions now comes from a previously cancelled customer, which makes win-back a standing acquisition channel, not a one-off campaign.
What is a realistic return from a loyalty program?
Yotpo's loyalty benchmarks report, built from a subset of Yotpo merchants across verticals, found that within 90 days brands running a loyalty program saw an average 8.5x return, a 164.4% increase in revenue per redeeming customer, and a 71.3% increase in purchases per customer versus non-redeemers. Those figures are vendor data from a 2022 study on Yotpo's own customer base, not an independent audit, and results vary sharply by category - beauty brands saw a 66.3% revenue-per-redeemer lift, apparel 50.2%, health 56.7%.
Should a lean e-commerce brand build a loyalty program or fix churn first?
Fix churn first if involuntary (failed-payment) churn is any meaningful share of the total - Recurly reports brands recovering revenue through automated dunning, with its ecommerce cohort alone recovering more than USD 34 million network-wide. A loyalty program adds spend on top of a leaky bucket; dunning and a pause option patch the bucket. Sequence it in that order, then layer loyalty once churn is inside the 2% to 4% benchmark zone Recurly defines for well-run subscription businesses.
Sources
Recurly - Churn rate benchmarks: SaaS, media, retail and more industries (2026)
Bain & Company - Loyalty Rules, Chapter One (original loyalty-economics research)
Yotpo - Loyalty Program Benchmarks Report (2022 vendor data)
Twilio Segment - The State of Personalization 2024
Shopify - Ecommerce Sales Strategy: A Phased Framework (2026), own 2025 merchant survey


