



Table of contents
The disaster restoration services market is valued at $45.2 billion in 2026 and growing at 5.28% CAGR, yet most restoration companies spend $100–$300 per lead from Google Ads alone. Here are the advertising benchmarks, creative performance data, and market insights shaping restoration marketing strategy this year.
Key Takeaways
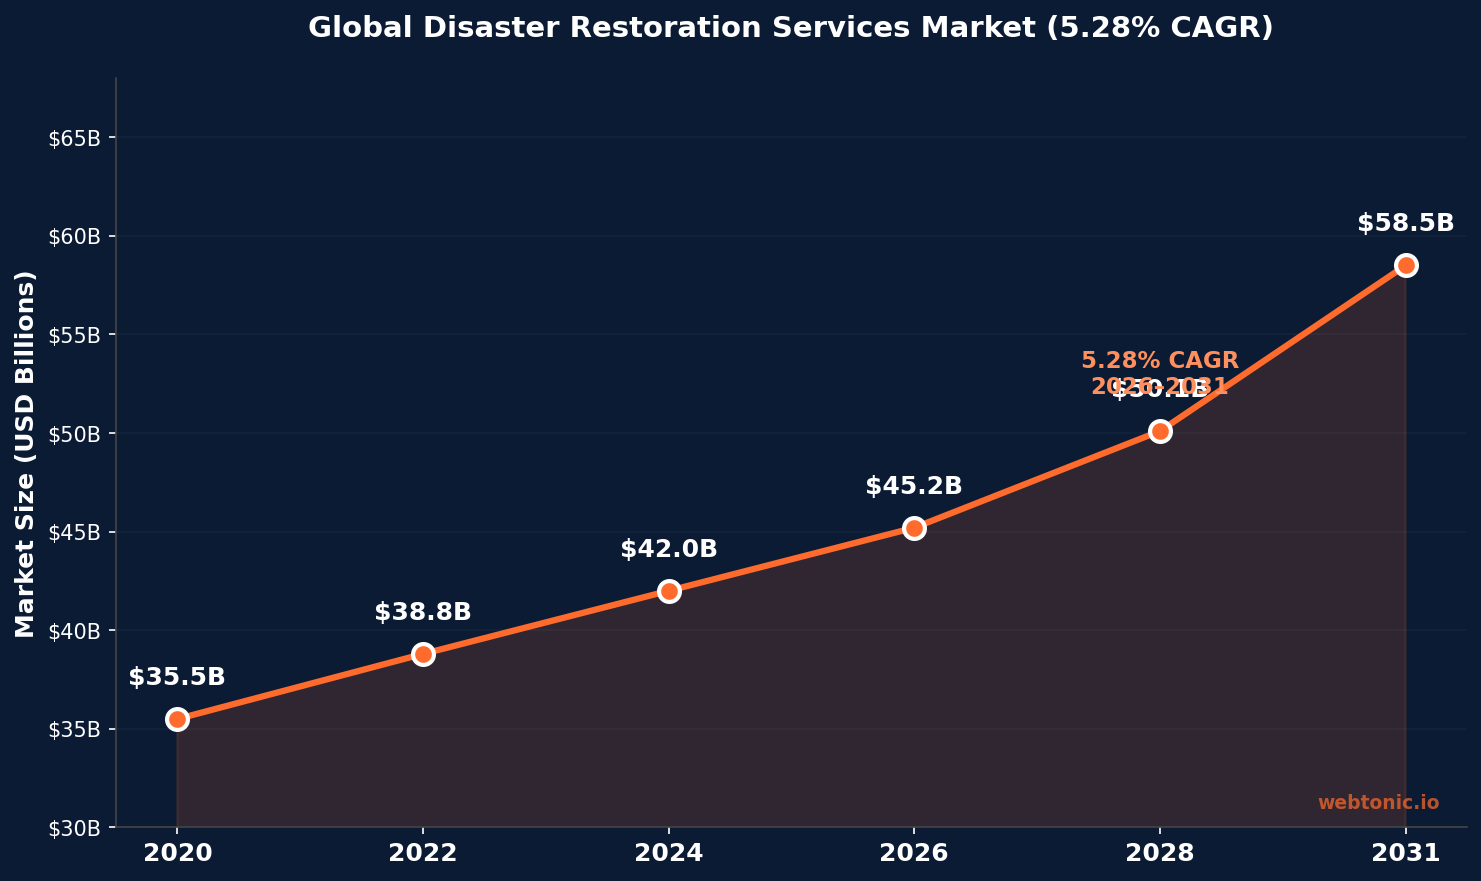
- $45.2 billion global disaster restoration services market in 2026, projected to reach $58.5 billion by 2031 at 5.28% CAGR
- 84% of restoration customers search online before contacting a company, making digital ad creative the first impression
- $100–$300 per lead from Google Ads for restoration companies, compared to $50–$150 from Local Services Ads
- 72% of restoration leads come from mobile devices during emergency situations
- 80% of demand is reactive — emergency-driven, compressing the decision window to hours rather than days
- SEO produces 5.3× higher long-term ROI than paid channels for restoration businesses
- North America dominates the global restoration market, with water damage and fire restoration as the largest service segments
Disaster Restoration Advertising at a Glance
| Metric | Value | Context |
|---|---|---|
| Market size (2026) | $45.2 billion | Global disaster restoration services market |
| Projected market size (2031) | $58.5 billion | 5.28% CAGR growth trajectory |
| Google Ads CPL | $100–$300 | Water damage, fire, mold restoration keywords |
| LSA CPL | $50–$150 | Local Services Ads with Google Guaranteed badge |
| SEO CPL (long-term) | $25–$50 | Lowest long-term cost per lead once established |
| Online search before contact | 84% | Share of customers who search before calling |
| Mobile lead share | 72% | Emergency searches overwhelmingly from mobile devices |
| Reactive demand share | 80% | Emergency-driven vs. relationship-driven work |
Cost Per Lead by Marketing Channel
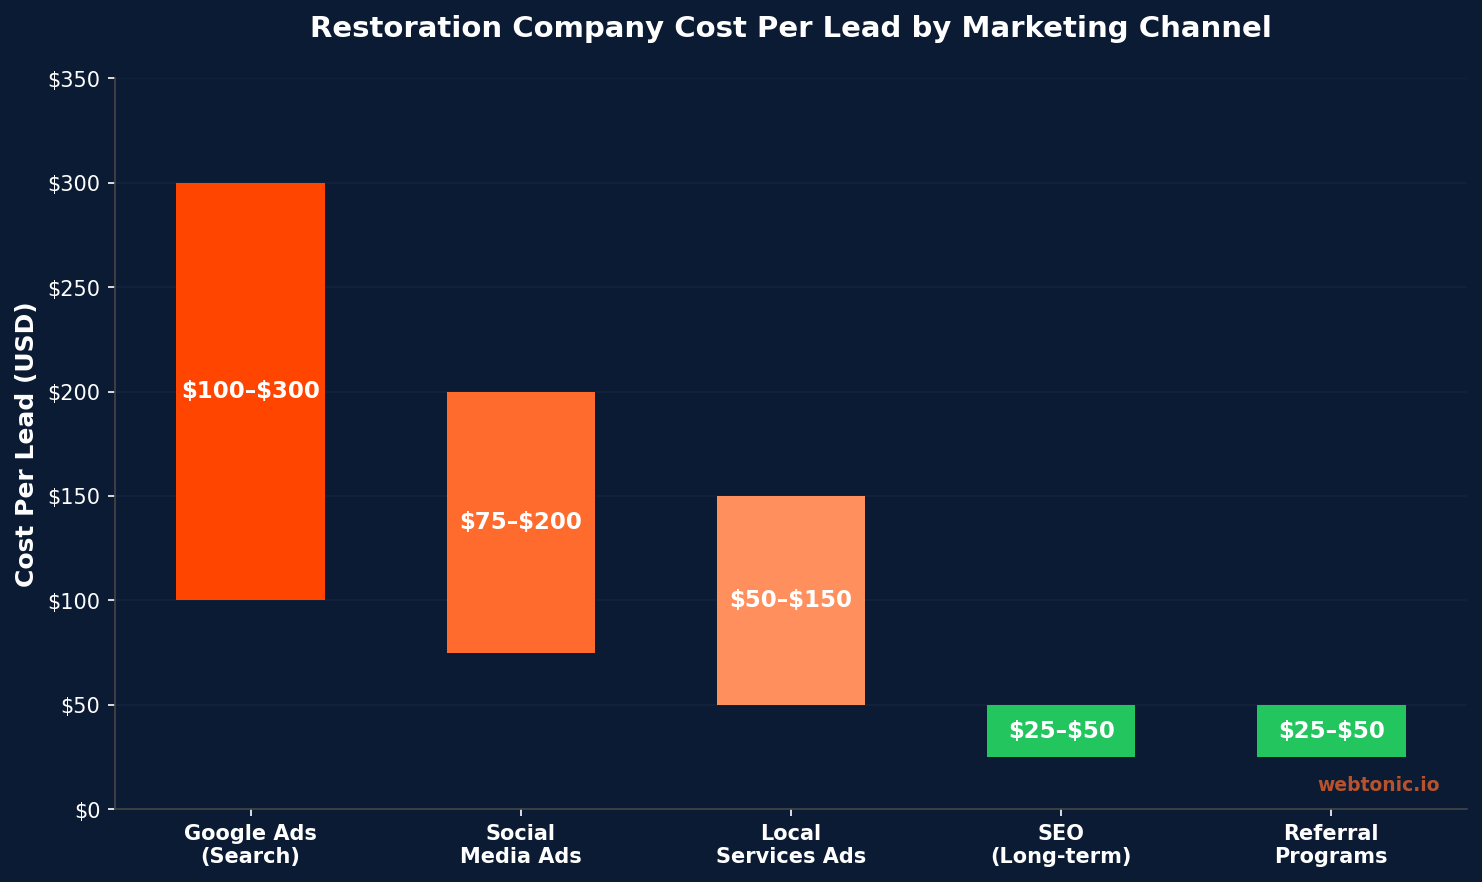
The cost gap between marketing channels in disaster restoration is massive — and understanding it is the foundation of effective ad creative strategy. Google Ads leads cost $100–$300 per lead, with water damage keywords commanding the highest CPCs due to intense competition among restoration companies, insurance adjusters, and franchise networks. Local Services Ads offer a more efficient alternative at $50–$150 per lead, leveraging the Google Guaranteed badge that builds immediate trust for emergency-driven searches.
On the organic side, SEO delivers leads at $25–$50 once the initial investment period matures — a 5.3× higher long-term ROI than paid channels. However, SEO requires sustained content investment and cannot capture the immediate emergency demand that drives 80% of restoration revenue. The most effective restoration companies layer all three channels: Google Ads for immediate capture, LSAs for trust-based local visibility, and SEO for long-term cost efficiency.
| Channel | Cost Per Lead | Speed to Lead | Best For |
|---|---|---|---|
| Google Ads (Search) | $100–$300 | Immediate | Emergency water/fire damage capture |
| Local Services Ads | $50–$150 | Immediate | Trust-driven local emergency calls |
| SEO / Organic | $25–$50 | 3–6 months ramp | Long-term cost reduction, informational queries |
| Referral programs | $25–$50 | Relationship-dependent | Insurance adjuster, property manager networks |
| Social media ads | $75–$200 | Moderate | Brand awareness, pre-disaster positioning |
Ad Creative Strategy for Emergency Services
Restoration advertising creative operates under fundamentally different rules than most home services marketing. The buying cycle is compressed to hours — a homeowner with water on the floor is not comparison-shopping across five websites. They need a company that answers immediately, conveys competence, and removes the feeling of crisis. This means restoration ad creative must prioritize speed signals, trust badges, and urgency-appropriate messaging over the educational content that works for planned services like remodeling or HVAC maintenance.
Effective restoration ad copy includes three core elements: 24/7 availability language ("Emergency water damage response — call now"), certification and insurance signals (IICRC certified, licensed, insured), and response time commitments ("On-site within 60 minutes"). Ad extensions amplify these signals — call extensions for immediate phone contact, location extensions for proximity credibility, and sitelink extensions linking to service-specific landing pages for water damage, fire damage, and mold remediation.
Market Segmentation and Growth Drivers
The $45.2 billion global restoration services market is segmented by damage type, property category, and geography. Water damage restoration represents the largest service segment, driven by increasing flood frequency, aging infrastructure, and plumbing failures. Fire and smoke damage restoration follows, with mold remediation and storm damage rounding out the primary service lines.
Growth is being driven by several converging factors: rising natural disaster frequency (climate-related severe weather events), government initiatives for disaster preparedness, IoT-enabled early damage detection systems, and the increasing sophistication of property restoration technologies. North America remains the largest regional market, but Asia Pacific is the fastest-growing region at a rate exceeding the global CAGR. For restoration marketing, this growth means increased competition for digital advertising space — particularly in disaster-prone markets like Houston, Denver, and the broader U.S. Southeast.
Digital Marketing Benchmarks for Restoration Companies
| Metric | Restoration Industry | Home Services Average |
|---|---|---|
| Google Ads CPC (search) | $15–$45 | $8–$20 |
| Google Ads conversion rate | 5–8% | 4–7% |
| LSA cost per lead | $50–$150 | $30–$80 |
| SEO long-term ROI multiplier | 5.3× | 3–4× |
| Mobile lead share | 72% | 60–65% |
| Average job value | $3,500–$12,000 | $500–$3,000 |
Restoration companies face significantly higher CPCs than the broader home services market, reflecting the high job values and intense competition in emergency service keywords. A single water damage lead can be worth $3,500–$12,000 in revenue, which justifies the elevated acquisition cost — but only if the ad creative and landing page experience convert at rates that make the unit economics work. Companies that fail to optimize their ad creative end up paying premium CPCs for low-converting clicks, rapidly burning through budget without proportional revenue.
Landing Page and Conversion Optimization
The connection between ad creative and landing page performance is especially tight in restoration marketing because of the compressed decision window. A property owner with active water damage who clicks a restoration ad needs to see immediate confirmation that they've found the right company — not a generic homepage. Best-performing restoration landing pages feature a click-to-call button above the fold, service area confirmation, response time commitment, and trust signals (IICRC certification, insurance company partnerships, before-and-after photos).
Given that 72% of restoration leads come from mobile, landing page optimization for mobile speed is non-negotiable. Pages that load in under 3 seconds convert at measurably higher rates than those with longer load times. For restoration companies running Google Ads campaigns, the combination of emergency-optimized ad copy with fast, mobile-first landing pages is the single highest-leverage improvement available.
Insurance Partnerships and Commercial Restoration
While consumer-facing digital advertising captures the reactive emergency segment, the commercial and insurance-referred channels represent the other 20% of restoration revenue — and often the higher-margin work. Restoration companies that build relationships with insurance adjusters, property management companies, and commercial facility managers reduce their dependence on expensive PPC advertising.
From an ad creative perspective, commercial-focused campaigns require fundamentally different messaging than residential emergency ads. Commercial restoration creative emphasizes capacity, compliance, and contract reliability — "IICRC-certified crews available 24/7", "Serving commercial properties up to 100,000 sq ft", and "Preferred vendor for [insurance carrier]". These campaigns typically run on LinkedIn, industry directories, and targeted display networks rather than Google Search, and their CPL is lower but the sales cycle is longer.
Regional Market Dynamics and Competitive Landscape
North America accounts for the largest share of the global disaster restoration market, driven by the high frequency of hurricanes, tornadoes, and winter storms across the United States and Canada. Within North America, markets like Houston, Denver, and the U.S. Southeast face the most intense advertising competition due to their exposure to water damage events, wildfire seasons, and severe weather patterns. Restoration companies operating in these high-demand regions can expect CPCs 20–40% above national averages for emergency keywords.
The competitive landscape is split between national franchise networks (SERVPRO, ServiceMaster, Paul Davis, BMS CAT) and independent restoration operators. Franchises benefit from brand recognition and national advertising budgets, but independent companies can compete effectively through hyper-local Google Ads targeting, Local Services Ads, and strong Google Business Profile management. The key differentiator is ad creative that emphasizes local presence and rapid response — "your neighbor's restoration company" messaging paired with specific response time guarantees resonates strongly against generic national franchise ads.
Internationally, Asia Pacific is the fastest-growing region with a CAGR exceeding the global average. Government initiatives for disaster preparedness in countries like Japan, Australia, and India are expanding the addressable market. European markets emphasize regulatory compliance and environmental remediation standards, requiring restoration marketing to incorporate certification and sustainability messaging alongside emergency response creative.
Emerging Trends in Restoration Advertising
- IoT-triggered advertising: Smart home water leak sensors and smoke detectors are creating a new pre-disaster advertising channel — restoration companies partner with IoT vendors to serve targeted ads at the moment of detection
- AI-powered damage assessment: Companies integrating AI photo assessment into their ad funnels allow property owners to submit damage photos for instant estimates, shortening the inquiry-to-job conversion cycle
- Video-first creative: Restoration companies using video ads showing actual mitigation processes (water extraction, board-up, drying equipment deployment) see higher engagement than static image ads
- Review-driven creative: Google Business Profile reviews and before-and-after galleries embedded in ad creative and landing pages drive measurably higher conversion rates
- Geographic micro-targeting: Restoration companies now trigger geo-targeted ad campaigns within hours of severe weather events in specific ZIP codes, capturing emergency demand at the moment of need
Related reading
- Water Damage Restoration Ad Creative Statistics: CPC, LSA & Performance Data (2026)
- How Medical Spa & Aesthetics Businesses Use Ad Creative in 2026: Stats & Insights
- Mold Removal Ad Creative Statistics (2026): Benchmarks & Trends
- Branding services at Web Tonic
Frequently Asked Questions
How much do restoration companies spend on advertising?
Digital advertising costs vary significantly by channel. Google Ads leads cost $100–$300 each for restoration keywords, while Local Services Ads are more efficient at $50–$150 per lead. Most restoration companies allocate 5–12% of revenue to marketing, with the majority going to digital channels due to the industry's emergency-driven, search-first customer journey.
What ad creative works best for disaster restoration?
The most effective restoration ad creative combines urgency signals (24/7 availability, response time commitments), trust elements (IICRC certification, insurance partnerships, Google Guaranteed badge), and service specificity (water damage, fire damage, mold remediation — not generic "restoration services"). Video ads showing actual mitigation processes increasingly outperform static image formats.
Why is the cost per lead so high for restoration companies?
Restoration CPLs are elevated because average job values range from $3,500–$12,000, justifying higher acquisition costs. Competition is intense among franchises (SERVPRO, ServiceMaster, Paul Davis) and independent operators, all bidding on a limited set of emergency keywords. The 80% reactive demand pattern also means advertising must capture customers in a narrow window, driving up keyword prices.
How important is mobile optimization for restoration ads?
72% of restoration leads come from mobile devices — typically from property owners dealing with active emergencies who search from their phones. Ad creative must be mobile-optimized with click-to-call buttons, and landing pages must load in under 3 seconds. Desktop-first ad strategies miss the majority of the market in this industry.
What is the disaster restoration market growth forecast?
The global market is valued at $45.2 billion in 2026 and projected to reach $58.5 billion by 2031, growing at a 5.28% CAGR. Growth is driven by increasing natural disaster frequency, aging building infrastructure, government disaster preparedness initiatives, and IoT-enabled early detection systems. North America is the largest market, while Asia Pacific is the fastest-growing region.
Sources
Marketing LTB — Restoration Marketing Statistics 2026: 92+ Stats & Insights
Tygart Media — The Complete Restoration Marketing Guide for 2026
PushLeads — Cost Per Lead for Restoration Companies: Channel Comparison
Fortune Business Insights — Disaster Recovery Services Market Size & Forecast
Precedence Research — Disaster Recovery Market Analysis
Dataintelo — Disaster Restoration Services Market Report
MarketsandMarkets — Disaster Recovery Services Market
Restoration Industry Association — Industry Resources


