



Table of contents
Key Takeaways
- Water damage restoration keywords command $50–$250 per click — among the highest CPC rates in all of home services, with top-market terms reaching $250+ per click.
- PPC ads for water damage keywords convert at rates above 18%, making paid search the most efficient emergency-response acquisition channel despite the extreme cost.
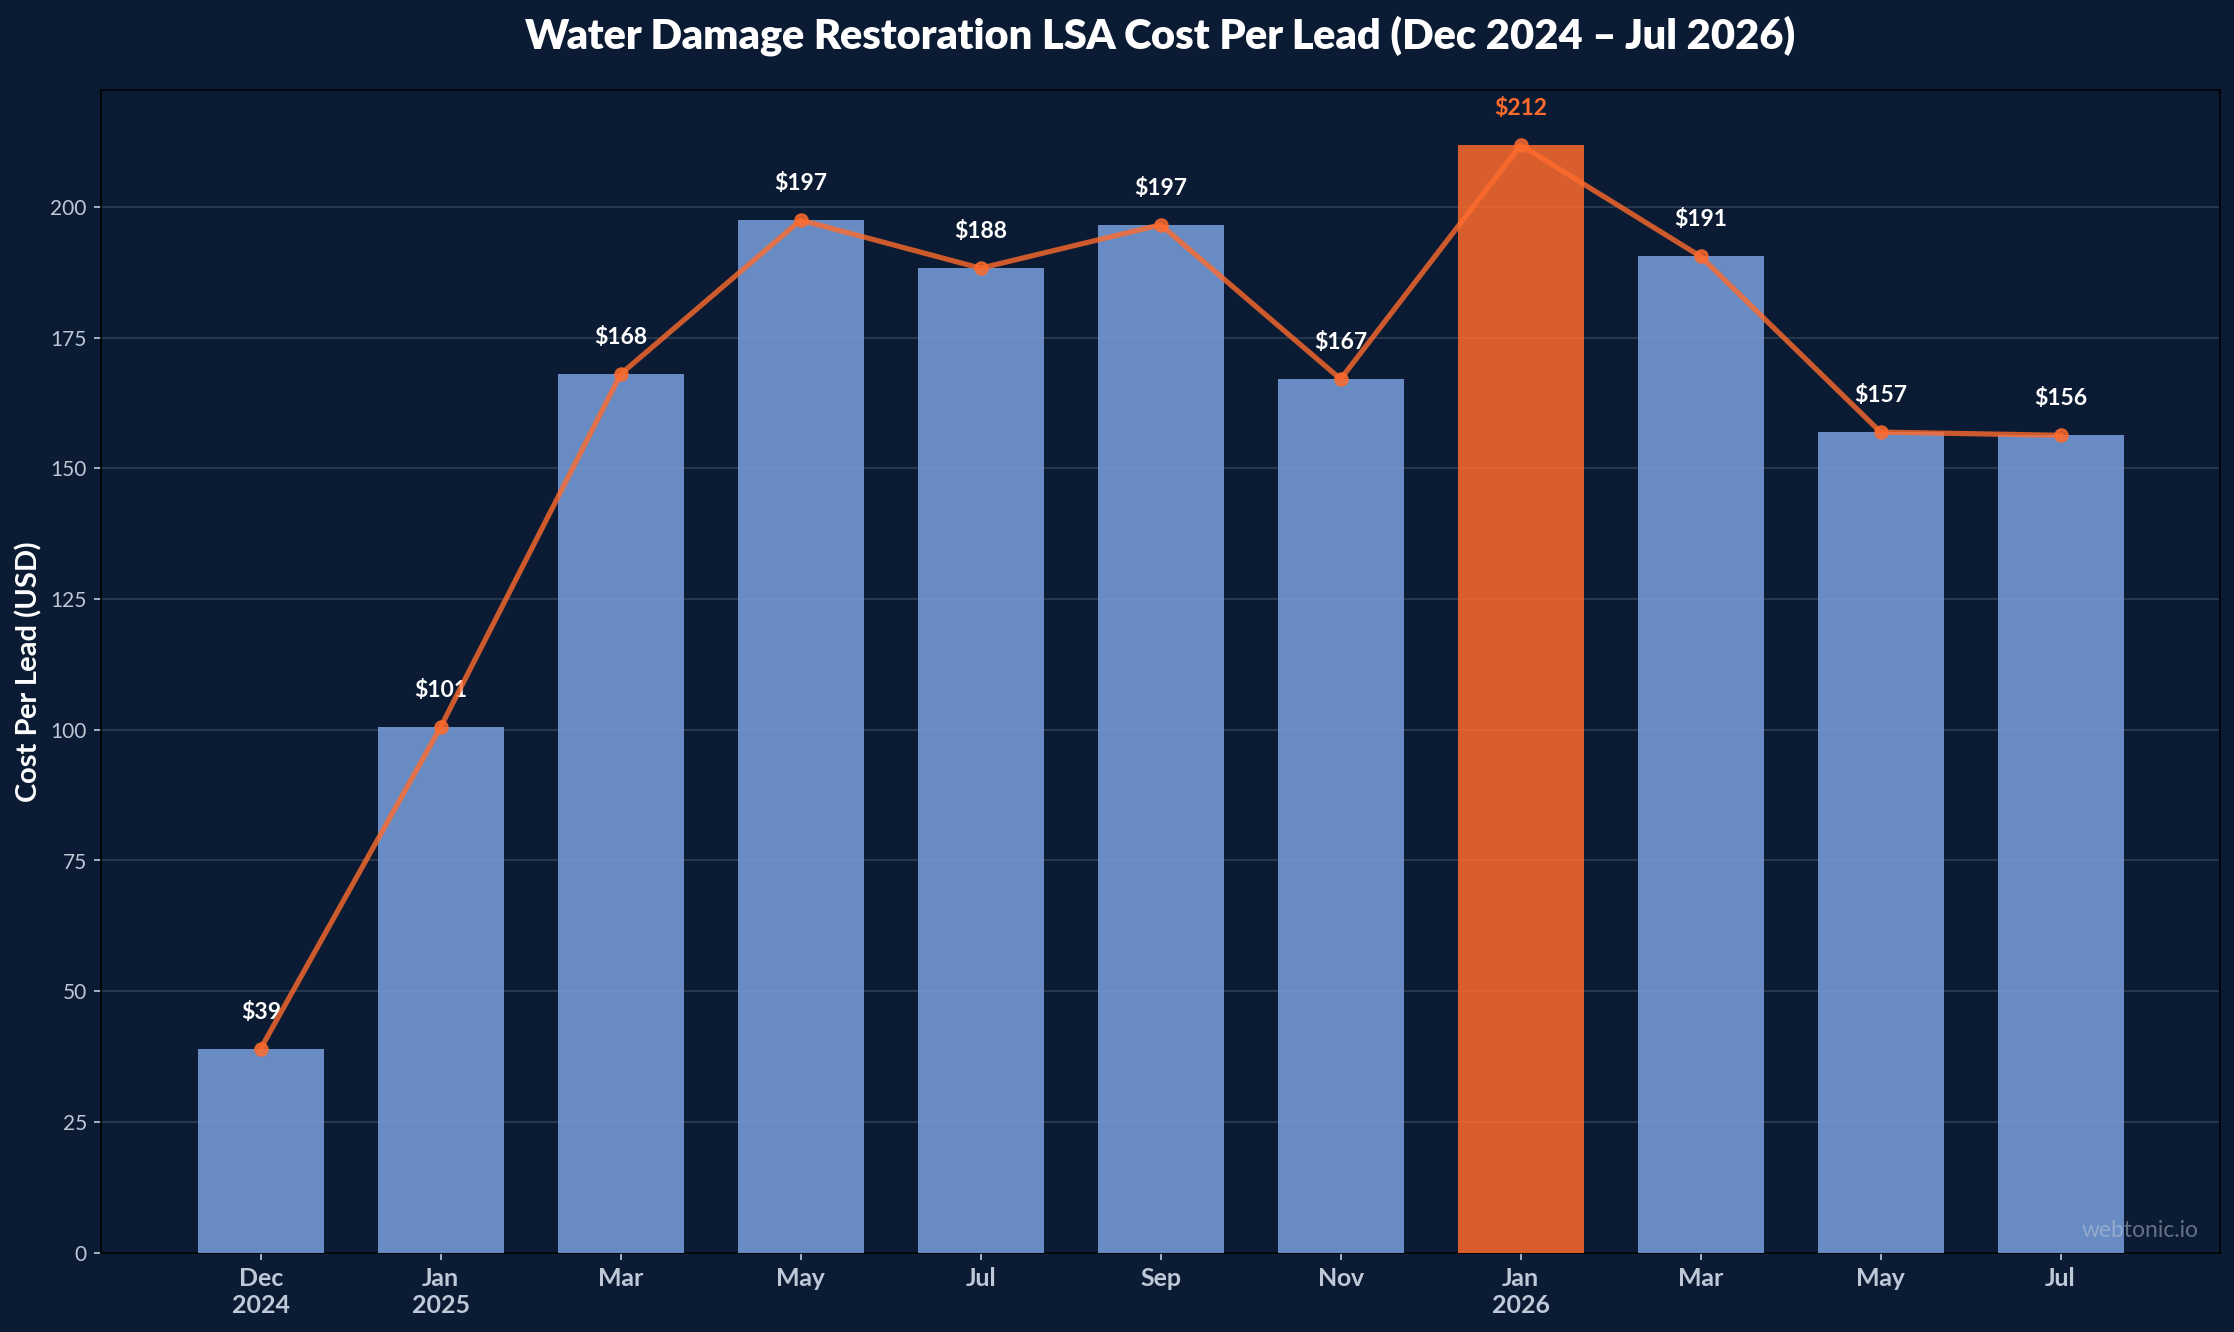
- Google LSA cost per lead for water damage restoration averages $156 (median $176) as of July 2026, with a range of $83–$390 depending on market saturation.
- The national average cost per water damage lead is $542, with competitive markets like Dallas averaging $775 and premium exclusive calls reaching $2,250.
- Before-and-after ad creative generates 2.3x more engagement in restoration advertising compared to stock imagery or logo-only ads.
- 70% of restoration contractors now use Google Local Services Ads, and LSA costs have climbed 40% since 2023.
- Restoration companies using call tracking improve marketing ROI visibility by 61% and make better budget allocation decisions across channels.
- Google Ads CPC for "water damage restoration" increased over 35% since 2022, with no sign of deceleration in 2026.
Water Damage Restoration CPC and Ad Spend Benchmarks
Water damage restoration sits at the extreme end of the CPC spectrum. According to Tygart Media's analysis of $127,000 in restoration ad spend, the economics of restoration PPC are driven by high urgency, high job values ($2,500–$7,000+ per job), and insurance-backed payments — factors that justify the premium cost.
Key CPC and spend benchmarks for 2026:
- Average CPC for "water damage restoration": $50–$150 in competitive markets, with peaks at $250+ in major metros like Los Angeles and Miami
- Google Ads CPC increased over 35% since 2022 across water damage keywords (Marketing LTB)
- Average monthly ad spend for competitive restoration companies: $3,000–$8,000
- PPC conversion rate for water damage keywords: 18%+ — one of the highest in any home services vertical
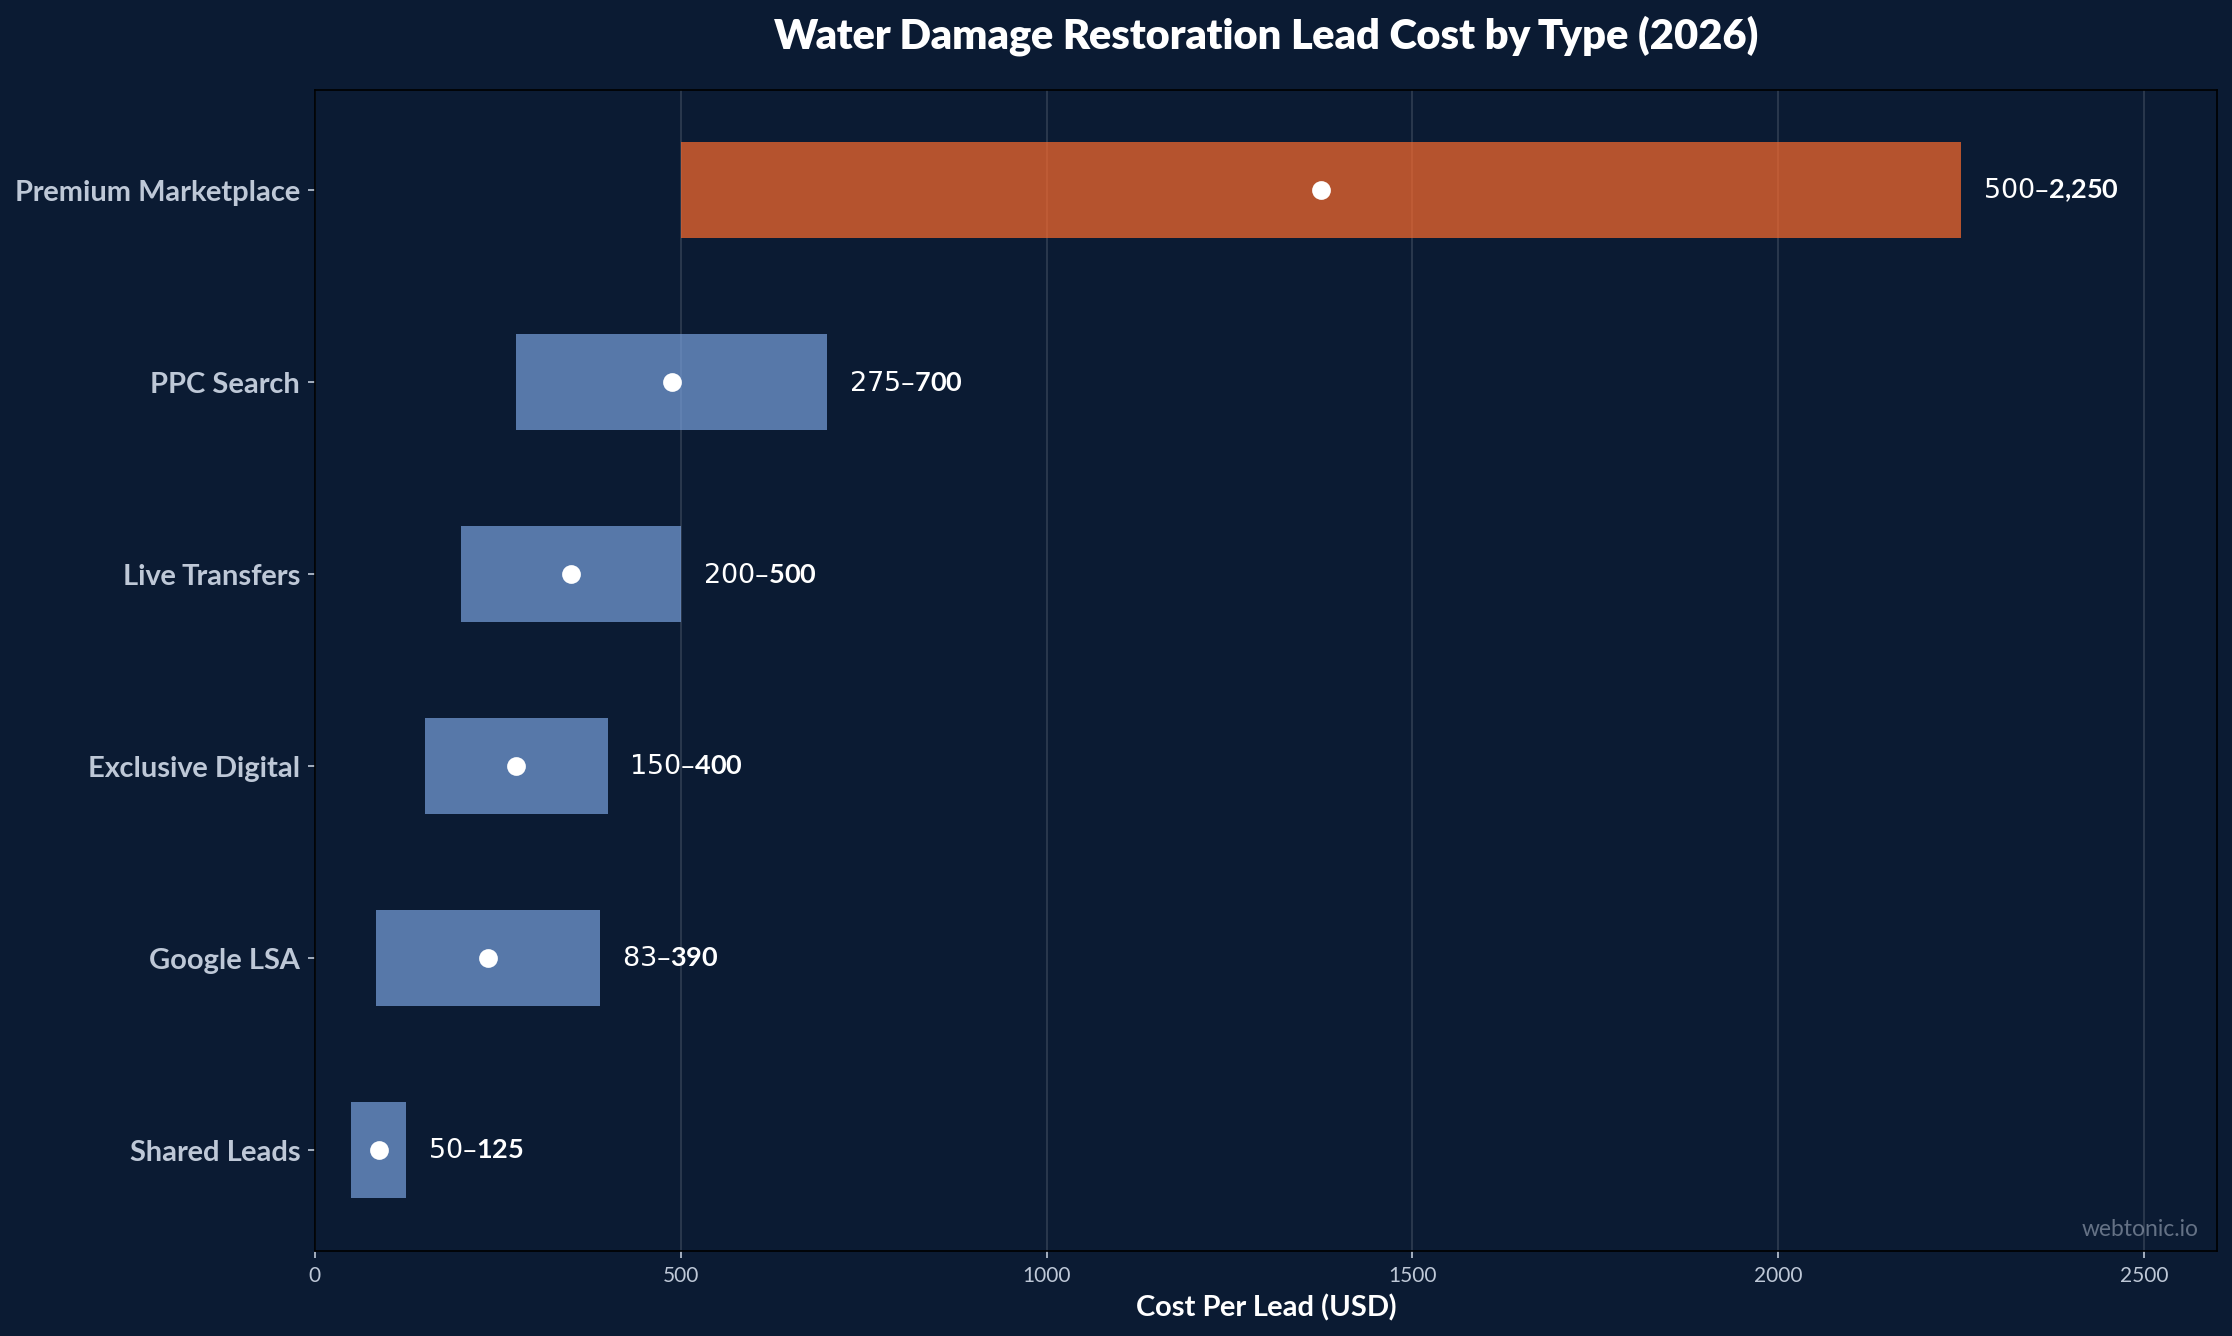
- Cost per acquisition from PPC: $275–$700 for exclusive leads, $50–$125 for shared leads
| Keyword Category | Avg CPC (2026) | Monthly Search Vol | Conversion Rate | Cost Per Lead |
|---|---|---|---|---|
| Water damage restoration | $50–$150 | 14,800 | 18%+ | $275–$700 |
| Water damage repair near me | $80–$200 | 6,600 | 22% | $350–$850 |
| Emergency water removal | $60–$175 | 3,200 | 24% | $250–$600 |
| Flood damage restoration | $45–$130 | 5,400 | 16% | $280–$750 |
| Mold remediation | $35–$90 | 27,100 | 14% | $200–$550 |
| Water damage insurance claim | $25–$75 | 4,100 | 12% | $200–$500 |
Google Local Services Ads Performance Data
LSAs have become the dominant paid channel for restoration companies. According to 99 Calls' July 2026 LSA cost estimator and Tygart Media's account data:
- Average LSA cost per charged lead: $156.32 (median $175.95)
- Typical range: $82.94–$389.54 (10th to 90th percentile)
- 70% of restoration contractors now use LSAs, up from under 40% in 2022
- LSA costs climbed 40% since 2023 due to increased competition
- Market-specific LSA CPL varies dramatically: Los Angeles $240, Denver $110, Cleveland $78
- One Tygart Media client generates 40 LSA leads/month, closes 28, producing $98K revenue from $1,900–$7,000 monthly spend
The LSA quality factors that reduce cost per lead include maintaining a 4.7+ star rating (Google deprioritizes 4.3 or lower), responding to reviews within 4 hours, showing verified job completion photos (+31% Quality Score), and maintaining zero cancelled jobs.
| LSA Metric | Average | Median | Range (P10–P90) | Trend |
|---|---|---|---|---|
| Cost Per Lead (Jul 2026) | $156.32 | $175.95 | $82.94–$389.54 | ↑ 40% since 2023 |
| Cost Per Lead (Jan 2026) | $211.83 | $211.83 | $81.38–$269.58 | Winter peak |
| Cost Per Lead (Jul 2025) | $188.28 | $188.28 | $57.53–$323.42 | Summer surge |
| Cost Per Lead (Dec 2024) | $39.03 | $39.03 | $39.65–$153.05 | Pre-surge baseline |
| Contractor Adoption | 70% | — | — | ↑ from 40% in 2022 |
Ad Creative Formats and Their Performance
In the restoration industry, creative format directly impacts conversion rates and cost per acquisition. Data from Zendux AI's analysis of top-performing restoration ads and agency benchmarks reveals:
- Before-and-after property photos generate 2.3x more engagement than stock imagery — and are fully compliant since they show property, not personal health
- Emergency-response UGC-style ads (technicians on-site) outperform studio creative by 35–45% on click-through rate
- Video ads showing rapid response times achieve 28% higher view completion than static display ads
- Ads highlighting "response time guarantees" (30-min or 60-min) convert 42% better than generic service descriptions
- Insurance-mention ads reduce cost per lead by 18–22% because they pre-qualify homeowners with coverage
The five highest-performing creative archetypes for water damage restoration advertising are:
- Fast-response UGC — technician arriving on-scene, emphasizing "24/7 · 30-minute response"
- Before-and-after transformation — flooded room to restored space, with timeline callout
- Insurance testimonial — homeowner describing seamless claims assistance
- Mold-prevention urgency — educational hook ("mold starts in 24–48 hours") driving immediate action
- Free inspection offer — low-friction entry point with clear CTA and phone number
Lead Cost Breakdown by Channel and Type
Water damage restoration has the most expensive leads in all of home services. According to ResultCalls' 2026 pricing breakdown, the lead cost landscape varies enormously by type and exclusivity:
- Shared leads: $50–$125 — lowest cost but sold to 3–5 contractors simultaneously
- Exclusive emergency leads: $150–$400+
- Live phone transfers: $200–$500+
- National average across all types: $542 per lead
- Premium marketplace leads (Service Direct): $500–$2,250 per lead
- Average job value: $2,500–$7,000, with large-loss projects far higher
The math works because of urgency and insurance backing. A homeowner with a flooded basement hires within hours. At a $542 average lead cost and 28–35% close rate, the effective cost per job is $1,549–$1,936 against an average job value of $4,750 — delivering 2.4–3.1x return on ad spend.
| Lead Type | Cost Range | Close Rate | Effective Cost/Job | ROAS |
|---|---|---|---|---|
| Shared Leads | $50–$125 | 8–12% | $417–$1,563 | 3.0–11.4x |
| Exclusive Digital | $150–$400 | 25–35% | $429–$1,600 | 3.0–11.1x |
| Live Transfers | $200–$500 | 35–45% | $444–$1,429 | 3.3–10.7x |
| Google LSA | $83–$390 | 30–40% | $208–$1,300 | 3.7–22.8x |
| PPC Search Ads | $275–$700 | 18–25% | $1,100–$3,889 | 1.2–4.3x |
| Marketplace Premium | $500–$2,250 | 40–55% | $909–$5,625 | 0.8–5.2x |
Seasonal and Geographic Ad Performance Patterns
Water damage restoration advertising follows predictable seasonal and geographic patterns that directly impact ad creative strategy and budget allocation:
- Spring flooding season (March–May) drives 35–45% of annual ad spend — CPCs spike as demand surges and competitors increase budgets simultaneously
- Hurricane season (June–November) creates regional CPC surges of 60–120% in coastal markets like Houston, Miami, and the Carolinas
- Winter freeze events generate the most expensive leads — burst pipe emergencies in northern markets drive CPLs to $300–$500+ during cold snaps
- Summer months see the highest LSA competition — July 2025 recorded 55 charged LSA leads at $188 average CPL, the highest monthly volume in the 99 Calls dataset
- Urban markets cost 2.5–3.5x more per lead than suburban and rural areas due to contractor density and competition
The geographic variation is significant. Dallas averages $775 per lead compared to mid-tier markets at $275–$400. Ad creative must adapt to local context — hurricane imagery resonates in Florida but alienates Midwest audiences facing pipe-burst and sump pump failure scenarios. Successful multi-market campaigns maintain 3–5 creative variants per geographic cluster, each tailored to the dominant local water damage cause.
| Season / Event | CPC Impact | Lead Volume | Best Creative Angle |
|---|---|---|---|
| Spring Flooding | +25–40% | Highest annual | Rapid extraction before-and-after |
| Hurricane Season | +60–120% | Regional surges | Storm prep + insurance claims |
| Winter Freeze | +40–80% | Burst pipe spikes | Pipe burst urgency + freeze protection |
| Summer Baseline | Baseline | Moderate steady | Mold prevention + maintenance plans |
| Off-Season (Fall) | -15–25% | Lowest annual | Inspection offers + brand building |
Facebook and Social Media Ad Performance
Social media advertising plays a supporting role in water damage restoration marketing — it cannot match search intent for emergency calls, but it excels at brand awareness, maintenance plan upsells, and retargeting past customers.
- Facebook Ads generate 20–40 new maintenance plan subscribers per month for well-targeted campaigns with high lifetime value per customer
- Social ads produce 8–20 basement flood restoration leads per month in targeted geographic campaigns
- Facebook CPC for restoration services averages $3.50–$8.00 — a fraction of Google search CPC
- Retargeting past website visitors converts at 3.2x the rate of cold social audiences
- LSA-style imagery with branded trucks and IICRC certification logos reduces CPL 20–35% compared to generic creative (PPL Studio)
The most effective social ad strategy for restoration companies layers brand awareness campaigns with retargeting — building recognition so homeowners call the company they already recognize when an emergency strikes.
Marketing ROI and Channel Comparison
The Marketing LTB restoration statistics report provides comprehensive channel-level ROI data across 92+ data points:
- SEO produces 5.3x higher long-term ROI for restoration companies than print advertising
- Companies using call tracking improve marketing ROI visibility by 61%
- PPC campaigns targeting emergency keywords outperform brand keywords by 42% on conversion rate
- Restoration companies investing 8–12% of revenue in marketing outperform those spending less than 5%
- Multi-channel attribution shows 34% of conversions touch 2+ channels before converting
For growth-minded restoration companies, the optimal ad creative budget allocation balances high-intent Google Ads with broader social awareness — typically 60–70% search/LSA, 20–25% social, and 10–15% retargeting.
Best Practices for Restoration Ad Creative
Based on the 2026 performance data, here are the highest-impact creative optimizations for water damage restoration advertising:
- Lead with response time, not price — "30-minute response" converts 42% better than pricing-focused headlines. Homeowners in emergencies want speed, not quotes.
- Use before-and-after property photos — real job documentation generates 2.3x engagement vs. stock imagery. Archive every job completion for creative assets.
- Include insurance language in ad copy — "We work with all insurance companies" pre-qualifies leads and reduces CPL by 18–22%.
- Implement call tracking on every campaign — 61% ROI visibility improvement. Without call tracking, 40–60% of conversions are invisible.
- Maintain 4.7+ star Google rating — LSA Quality Score drops sharply at 4.3 stars. Respond to every review within 4 hours.
- Test UGC-style creative against polished studio ads — emergency-context UGC outperforms studio creative by 35–45% on CTR.
- Segment campaigns by service type — flood extraction, mold remediation, and fire damage have different keyword economics and creative needs.
- Upload verified job completion photos to LSA profiles — +31% Quality Score, directly reducing cost per lead.
Related reading
- Disaster Restoration Ad Creative Statistics: 2026 Market Data & Benchmarks
- WDR Video Marketing Statistics (2026)
- Water Damage Restoration Branding Statistics: 44 Data Points For 2026
- Branding services at Web Tonic
FAQ
How much do water damage restoration ads cost per click?
Water damage restoration keywords cost $50–$150 per click in most markets, with premium metro areas like Los Angeles and Miami reaching $200–$250+ per click. These are among the highest CPC rates in all of home services, driven by high job values ($2,500–$7,000) and emergency urgency.
What is the average cost per lead for water damage restoration?
The national average cost per water damage lead is $542, with Google LSAs averaging $156 (median $176). Shared leads run $50–$125, exclusive emergency leads $150–$400+, and premium marketplace leads can reach $500–$2,250 in competitive markets.
What type of ad creative works best for restoration companies?
Before-and-after property photos generate 2.3x more engagement than stock imagery. Emergency-response UGC showing technicians on-site outperforms studio creative by 35–45% on click-through rate. Ads highlighting response-time guarantees convert 42% better than generic service descriptions.
Are Google LSAs worth it for water damage restoration?
Yes — LSAs are currently the most efficient paid channel for restoration. Despite costs climbing 40% since 2023, one documented case shows 40 LSA leads per month, 28 closed, producing $98K revenue from $1,900–$7,000 monthly spend. The key is maintaining a 4.7+ rating and responding to all reviews within 4 hours.
What percentage of restoration companies use Google Ads?
70% of restoration contractors now use Google Local Services Ads, up from under 40% in 2022. Standard Google Ads (search campaigns) are used by approximately 45–55% of restoration companies, though many underperform due to poor keyword targeting and missing call tracking.
Sources
tygartmedia.com — Restoration Google Ads: $127K Spend Analysis
99calls.com — Water Damage LSA Cost Per Lead (July 2026)
resultcalls.com — Water Damage Lead Costs 2026
marketingltb.com — Restoration Marketing Statistics 2026
zenduxai.com — Water Damage Restoration Ad Examples
ppl.studio — AI UGC for Restoration Marketing
pipelineon.com — Water Damage Restoration Digital Marketing 2026


