



Table of contents
Account-based marketing wins more often than the traditional demand-gen mix in 2026's best-published dataset - but it is still just 11% of what B2B marketers actually run. This page puts Demandbase's 1,452-tenant benchmark next to Sagefrog's tactic-usage survey to show where the two approaches actually diverge.
Key Takeaways
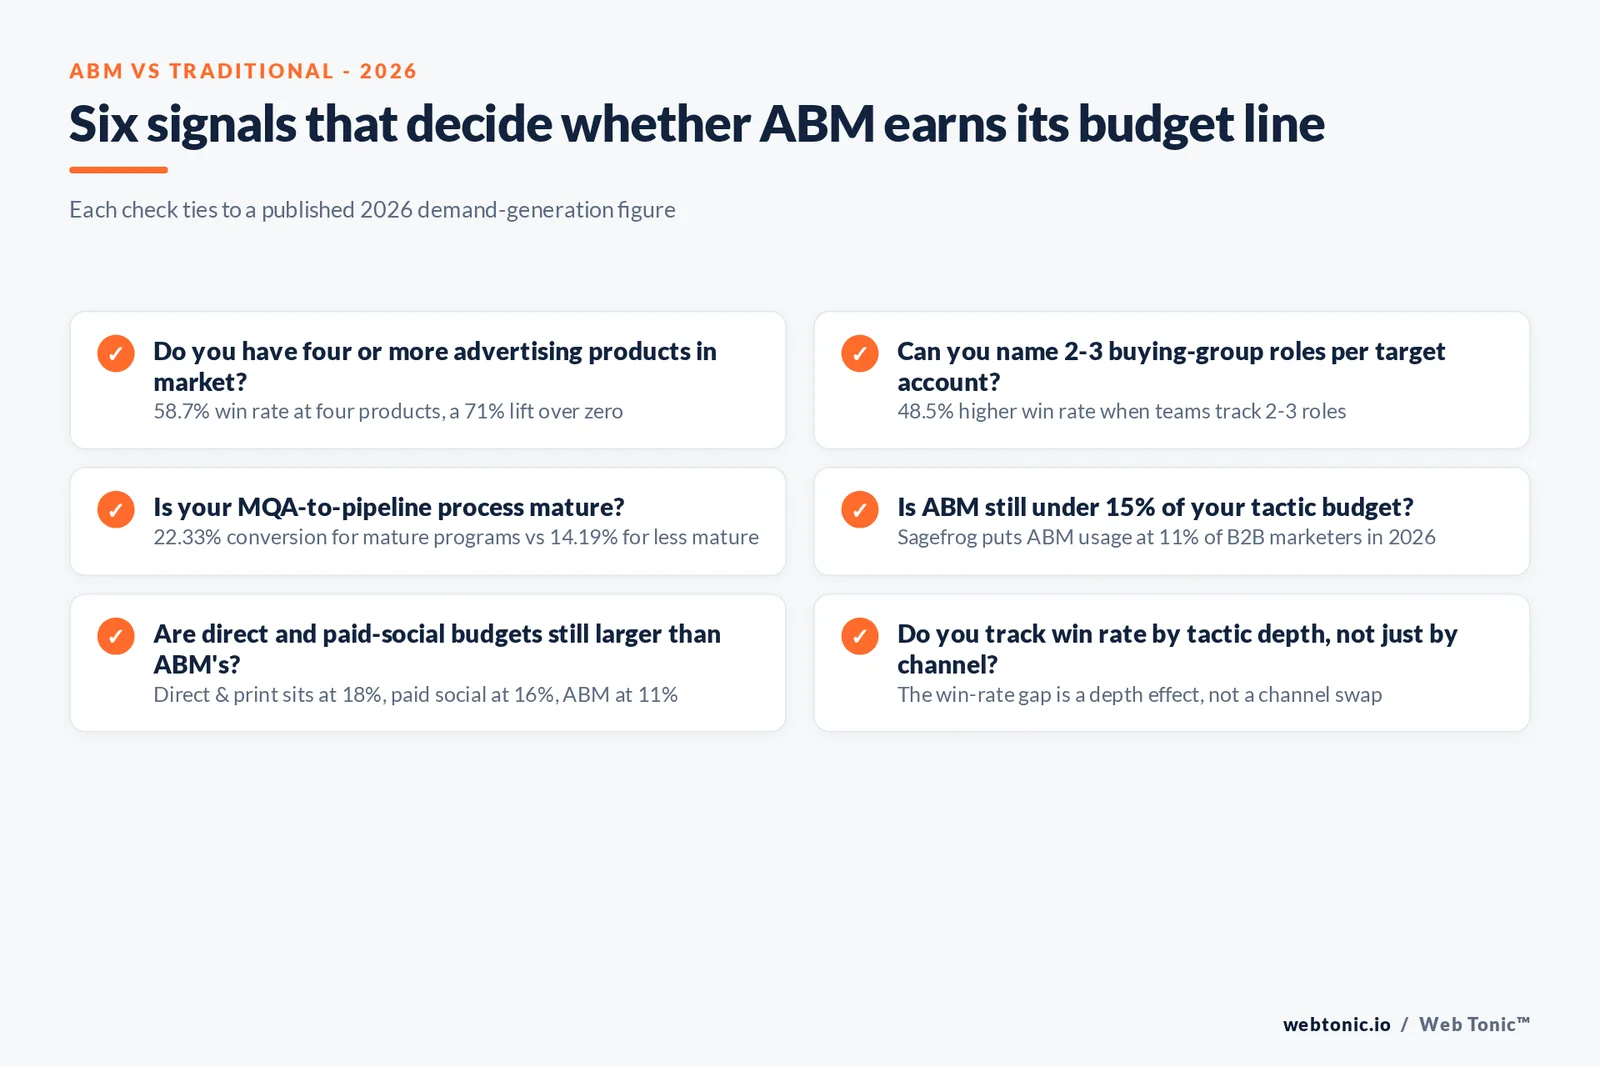
- 58.7% win rate for accounts run with four advertising products, a 71% lift over zero.
- 48.5% higher win rate when teams track two to three buying-group roles per account.
- 22.33% median MQA-to-pipeline conversion for mature ABM frameworks.
- 14.19% median conversion for less mature ABM programs, the same dataset.
- Demandbase's sample spans 1,452 tenants and 429,634 advertising campaigns.
- That dataset also covers 38 million marketing activities and 9.7 million sales interactions.
- Account-based marketing is used by just 11% of B2B marketers in 2026 (Sagefrog).
- Direct and print advertising still leads tactic usage at 18%.
- Search engine marketing usage sits at 20%, ahead of ABM by nearly double.
- SEO usage holds at 16%, tied with paid social media campaigns.
- 70% of B2B marketers increased their marketing budget for 2026.
- Only 13% decreased budget across the same survey.
- Qualified leads have shifted toward targeted, digital-first channels since 2024.
- Content syndication and partner networks now tie for the top qualified-lead source.
- 56% of new-account acquisition is the primary ABM goal for programs surveyed.
- 28% run ABM primarily for account expansion instead.
The headline number: ABM's win-rate lift is a depth effect
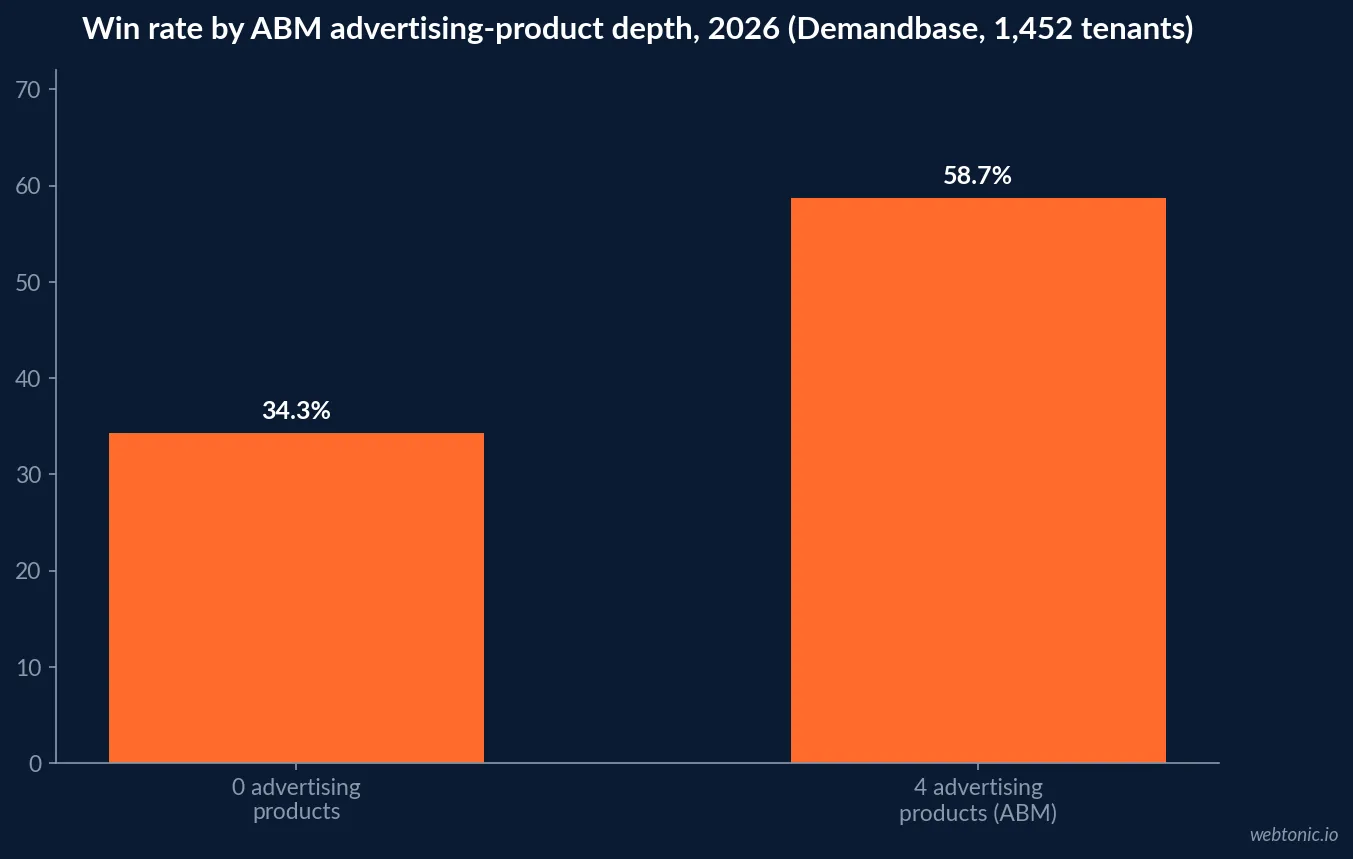
Demandbase Labs' 2026 State of ABM benchmark report, built from 1,452 Demandbase tenants, analyzed 429,634 advertising campaigns, 38 million marketing activities and 9.7 million sales interactions. Its clearest finding: accounts targeted with four advertising products close at a 58.7% win rate, a 71% lift over accounts targeted with none. That is a real vendor's own customer base rather than an independent census, but at this sample size it is the strongest evidence available on the question.
The lift is not flat across programs - it compounds with how many signals and channels a team actually runs per account, which is the opposite of "turn on ABM and win more."
| ABM depth signal (2026, Demandbase) | Published figure | What it measures |
|---|---|---|
| Win rate, 0 advertising products | 34.3% | Baseline account coverage |
| Win rate, 4 advertising products | 58.7% | Full-depth ABM execution |
| Win-rate lift at full depth | +71% | The gap the benchmark is known for |
| Win-rate lift, 2-3 buying-group roles tracked | +48.5% | Coverage inside the account, not just ads |
| MQA-to-pipeline conversion, mature programs | 22.33% | Process maturity, not just spend |
| MQA-to-pipeline conversion, less mature programs | 14.19% | The gap process maturity closes |
Now the traditional side of the ledger
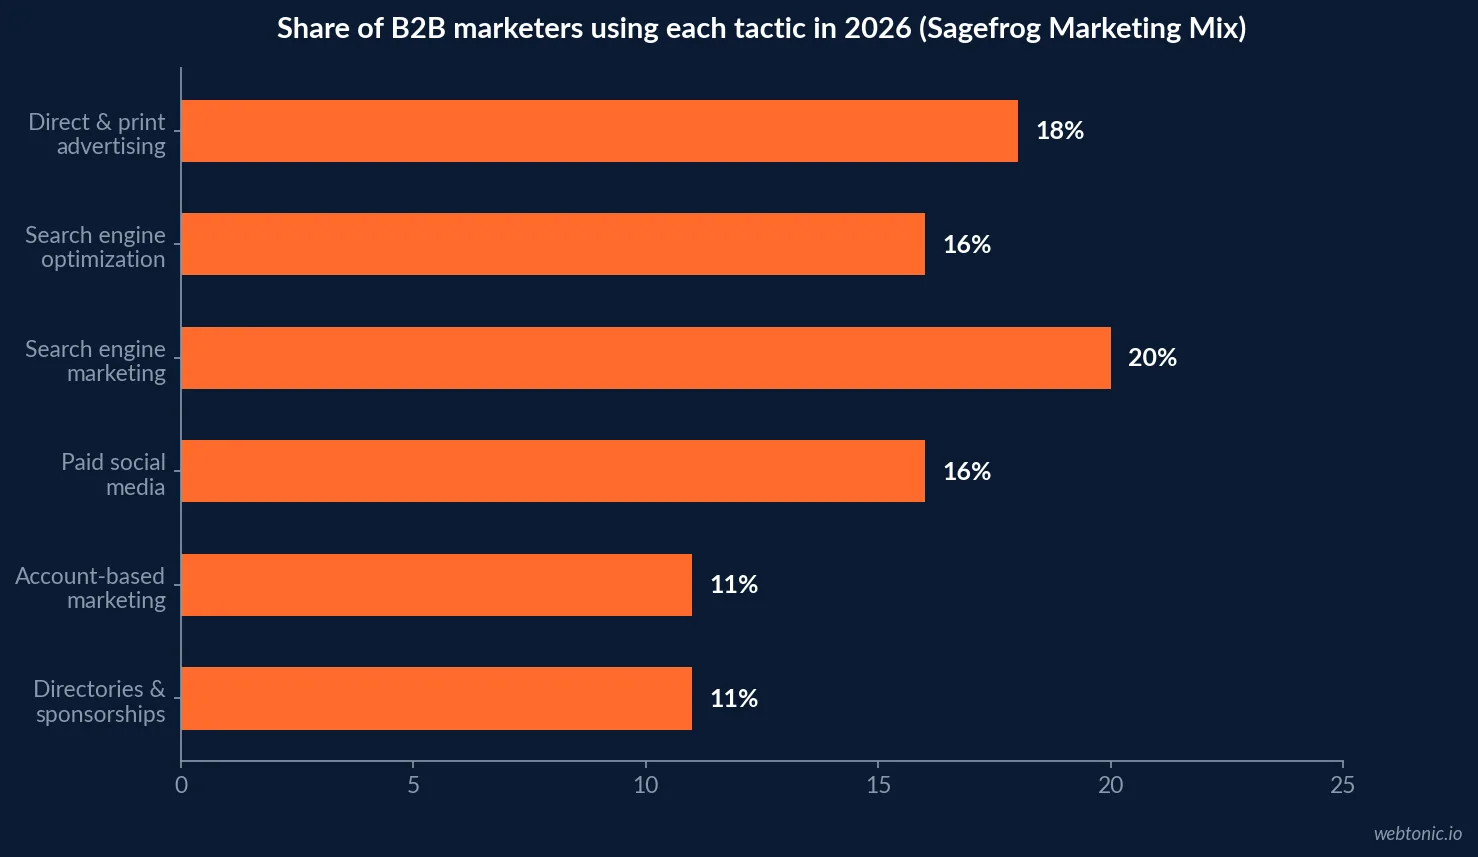
Sagefrog Marketing Group's 2026 B2B Marketing Mix Report, now in its 19th year, surveys B2B marketers directly on tactic usage rather than modelling win rate. Direct and print advertising still leads usage at 18%, search engine marketing sits at 20%, SEO and paid social both hold at 16%, and account-based marketing sits at the bottom of the list at 11%, tied with directories/sponsorships and email marketing platforms.
Traditional tactics are not shrinking - 70% of respondents increased marketing budget overall for 2026, with only 13% cutting it. The mix is simply weighted toward the tactics that have always carried B2B volume.
| Tactic (2026, Sagefrog B2B Marketing Mix) | Share of B2B marketers using it |
|---|---|
| Direct & print advertising | 18% |
| Search engine marketing (SEM) | 20% |
| Search engine optimization (SEO) | 16% |
| Paid social media campaigns | 16% |
| Market research & competitive analysis | 16% |
| Marketing technology | 15% |
| Account-based marketing (ABM) | 11% |
| Directories & sponsorships | 11% |
| Email marketing platforms & campaigns | 11% |
| Event marketing (in-person & virtual) | 8% |
Which lead sources B2B teams actually rate as qualified
Tactic usage and lead quality are two different tables in Sagefrog's data, and they diverge in a way that matters for this comparison. Asked which sources produce their most qualified leads rather than which tactics they simply run, B2B marketers ranked content syndication and partner networks and directories, sponsorships or industry listings tied for the top spot at 36% each, with email marketing at 33% and paid social at 30%. Account-based marketing sits mid-table for lead quality at 23%, the same rate as outbound sales outreach - ahead of print advertising and SEO, but well behind the top-ranked targeted, digital-first channels.
| Lead source (2026, rated for lead quality by Sagefrog respondents) | Share ranking it a top source |
|---|---|
| Content syndication or partner networks | 36% |
| Directories, sponsorships or industry listings | 36% |
| Email marketing | 33% |
| Paid social media | 30% |
| Events, tradeshows & webinars | 28% |
| Referrals or word of mouth | 26% |
| Search engine marketing (SEM) | 25% |
| Account-based marketing (ABM) | 23% |
| Search engine optimization (SEO) | 11% |
HubSpot's 2026 State of Marketing survey of more than 1,500 marketers offers an independent cross-check on the traditional side: website/blog/SEO ranks as the top channel by both usage (48.4% of B2B marketers) and by ROI (30.2% naming it a top-three ROI driver), with email marketing second on both counts. Neither ABM nor a broad demand-gen tactic tops either list - the two datasets agree that owned, compounding channels currently out-earn most paid or account-targeted tactics on a pure ROI basis, even where ABM wins on win rate for the accounts it does target.
Where qualified leads are actually shifting
Sagefrog's report also tracks lead-source quality, not just usage, and 2025-2026 shows a real change in direction: in 2024, in-person and virtual events topped the list of lead sources. In the current survey, B2B marketers report their most qualified leads now come from more targeted, digital-first channels - content syndication and partner networks tied with directories and sponsorships for the top spot, followed closely by email marketing.
That shift favors account-based tactics indirectly: partner networks and directories are precisely the channels a defined target-account list can prioritize, while a broad events motion cannot.
| ABM program goal (2026, industry benchmark surveys) | Share reporting it as primary goal |
|---|---|
| New account acquisition | 56% |
| Account expansion | 28% |
| Other / mixed objectives | 16% |
Cost and volume: the other half of the comparison
Win rate is not the only variable that matters when a budget owner picks between the two motions. ABM's advertising-product depth costs more per account to run, which is a fit for a bounded target account list rather than a broad top-of-funnel motion. WordStream's 2026 Google Ads benchmark data - a reasonable proxy for the paid-search leg of a traditional mix - puts the average cost per click at USD 5.42 and average cost per lead at USD 66.69 across roughly 13,000 US campaigns. ABM's per-account cost is typically far higher, which is exactly why it earns its keep on account depth and win rate rather than on lead volume.
Our growth marketing practice models this trade-off by account tier before recommending a split, rather than defaulting to either motion.
| Cost/volume signal (2026) | Figure | Source |
|---|---|---|
| Average Google Ads CPC (proxy for traditional paid demand gen) | USD 5.42 | WordStream 2026 benchmarks |
| Average Google Ads CPL | USD 66.69 | WordStream 2026 benchmarks |
| ABM win-rate lift at full advertising-product depth | +71% | Demandbase Labs 2026 |
| Sample size behind the ABM figures | 1,452 tenants | Demandbase Labs 2026 |
Traditional demand gen's own improvement story
Content-led demand generation, the largest traditional bucket outside paid tactics, is not standing still either. The Content Marketing Institute's 2026 B2B Content and Marketing Trends report, drawn from more than 1,000 B2B marketers, found 61% reporting improved content marketing performance over the past year. The driver was not bigger budgets or more headcount: 74% credited strategy refinement, ahead of 51% who credited new technology and just 16% who credited budget adjustments. That is the same lesson Demandbase's ABM data teaches from a different angle - depth and coordination beat raw spend, in both the account-based and the content-led halves of demand generation.
| Driver of 2026 content-marketing improvement (CMI, n=1,000+ B2B marketers) | Share crediting it |
|---|---|
| Strategy refinement | 74% |
| New technology implementation | 51% |
| Team restructuring / resourcing | 40% |
| Measurement capability improvements | 26% |
| Budget adjustments | 16% |
How to actually split the budget
The two datasets are not really arguing about the same question. Demandbase's benchmark measures win rate on accounts a team has already decided to target with depth; Sagefrog's measures which tactics the broader B2B market runs at all. Read together, the practical split is: use traditional, broad-reach tactics - direct/print, SEO, SEM, paid social - to fill and qualify a wide funnel, and reserve full-depth ABM (four-plus advertising products, tracked buying groups) for the subset of accounts large enough to justify the higher per-account cost. Running ABM thin, at one or two products with no buying- group tracking, gives up most of the lift the benchmark actually shows.
If you want a second opinion on where your own account list should split, talk to us, or see how our data and analytics practice tracks win rate by tactic depth rather than by channel label alone.
One more distinction worth holding onto: usage share and lead-quality share are not the same ranking. Sagefrog's tactic-usage table puts direct/print and SEM ahead of ABM by volume, but its lead-quality table puts ABM roughly level with outbound sales outreach and well above SEO and print for the leads teams actually rate as qualified. A tactic can be under-used relative to its quality, and ABM is currently the clearest example of that gap in the 2026 data - which is the argument for growing its share before growing its budget line for volume's sake.
Frequently Asked Questions
Does ABM really produce a higher win rate than traditional demand gen?
The best-evidenced 2026 dataset says yes, and by a wide margin at depth. Demandbase's Labs research, drawn from 1,452 tenants, 429,634 advertising campaigns and 38 million marketing activities, found a 58.7% win rate for accounts run with four advertising products, a 71% lift over accounts run with none. It is one vendor's own customer base, not an independent industry census, but it is the largest verifiable sample published on this question.
If ABM wins, why is it only 11% of the B2B tactic mix?
Sagefrog's 2026 B2B Marketing Mix Report, now in its 19th year, found account-based marketing used by just 11% of B2B marketers, tied with directories/sponsorships and email platforms for the bottom of the list. Direct and print advertising still leads tactic usage at 18%. ABM's win-rate advantage shows up at depth and maturity, and most programs have not reached either.
What does 'buying group' targeting actually change?
Demandbase's data ties a 48.5% higher win rate to teams tracking two to three buying group roles per target account, and a 22.33% median MQA-to-pipeline conversion rate for organizations with mature ABM frameworks against 14.19% for less mature ones. The mechanism is coverage: a deal with three engaged stakeholders converts more reliably than one with a single champion, ABM tooling or not.
Is traditional demand gen actually declining?
Not in usage share. Sagefrog's 2026 data shows 70% of B2B marketers increasing budget across their tactic mix broadly, with SEO at 16% usage and paid social at 16% holding steady alongside ABM. What is shifting is where qualified leads actually originate: marketers report their most qualified leads have moved toward more targeted, digital-first channels rather than the in-person and virtual events that led in 2024.
What is the honest way to decide ABM vs traditional for a specific budget?
Match the tactic to deal size and account count, not to which one 'wins' in a vendor benchmark. Demandbase's own lift is largest at higher advertising-product depth, which costs more per account to run - a fit for a defined target account list, not for a broad top-of-funnel motion. Traditional tactics still carry the volume Sagefrog measures at 18% usage for direct/print and 16% for SEO, which is where most net-new pipeline still originates.
Sources
Demandbase Labs - The State of ABM 2026 Benchmark Report
Sagefrog Marketing Group - 2026 B2B Marketing Mix Report
Sagefrog Marketing Group - 2026 B2B Marketing Mix Report landing page
WordStream - 2026 Google Ads Benchmarks
Demand Gen Report - Labs by Demandbase publishes new GTM-centered report
Content Marketing Institute - B2B Content and Marketing Trends 2026
HubSpot - The top marketing channels of 2026, according to marketers


