



Table of contents
Customer success is judged on renewal-cycle account math, not ticket-level service scores, and 2026 public-company data draws a clear line between the two. Net revenue retention, gross revenue retention and the churn rate underneath both are the benchmarks a CS function actually owns.
Key Takeaways
- Median net revenue retention across 105 public SaaS companies is 122% (Cust).
- Top-decile net revenue retention clears 155%.
- Median gross revenue retention is 84% (Benchmarkit CY-2025).
- Top-quartile gross revenue retention reaches 91%.
- Median annual SaaS churn is 3.22% (Recurly).
- Voluntary churn is 2.16%; involuntary churn is 1.06%.
- Top-quartile SaaS churn is 1.78% or below.
- Median CAC payback period is 16 months across 342 SaaS companies.
- Median LTV:CAC ratio is 4.1x.
- Median blended CAC ratio is USD 1.30 (Benchmarkit).
- 40% of SaaS companies at USD 15-30M ARR run negative net churn (ChartMogul).
- 94% of sales leaders with AI agents call them essential to targets (Salesforce).
- 83% of consumers say support experiences should still be better (Zendesk).
- 76% say less than half their CRM data is accurate and complete (Validity).
- 37% report losing revenue directly because of poor CRM data quality.
What customer success is actually scored on
A CS team can run a flawless renewal call and still miss its number if the account math behind it was already broken. The function's real scorecard in 2026 is net revenue retention, gross revenue retention, and the churn rate that feeds both - not ticket volume or CSAT alone.
| CS-owned metric (2026) | Median | Best-in-class | Source |
|---|---|---|---|
| Net revenue retention | 122% | 155% (top decile) | Cust (105 public SaaS companies) |
| Gross revenue retention | 84% | 91% (top quartile) | Benchmarkit |
| Annual churn rate | 3.22% | 1.78% or below | Recurly |
| CAC payback period | 16 months | Shorter with strong renewals | Benchmarkit |
Net revenue retention: the number the board actually reads
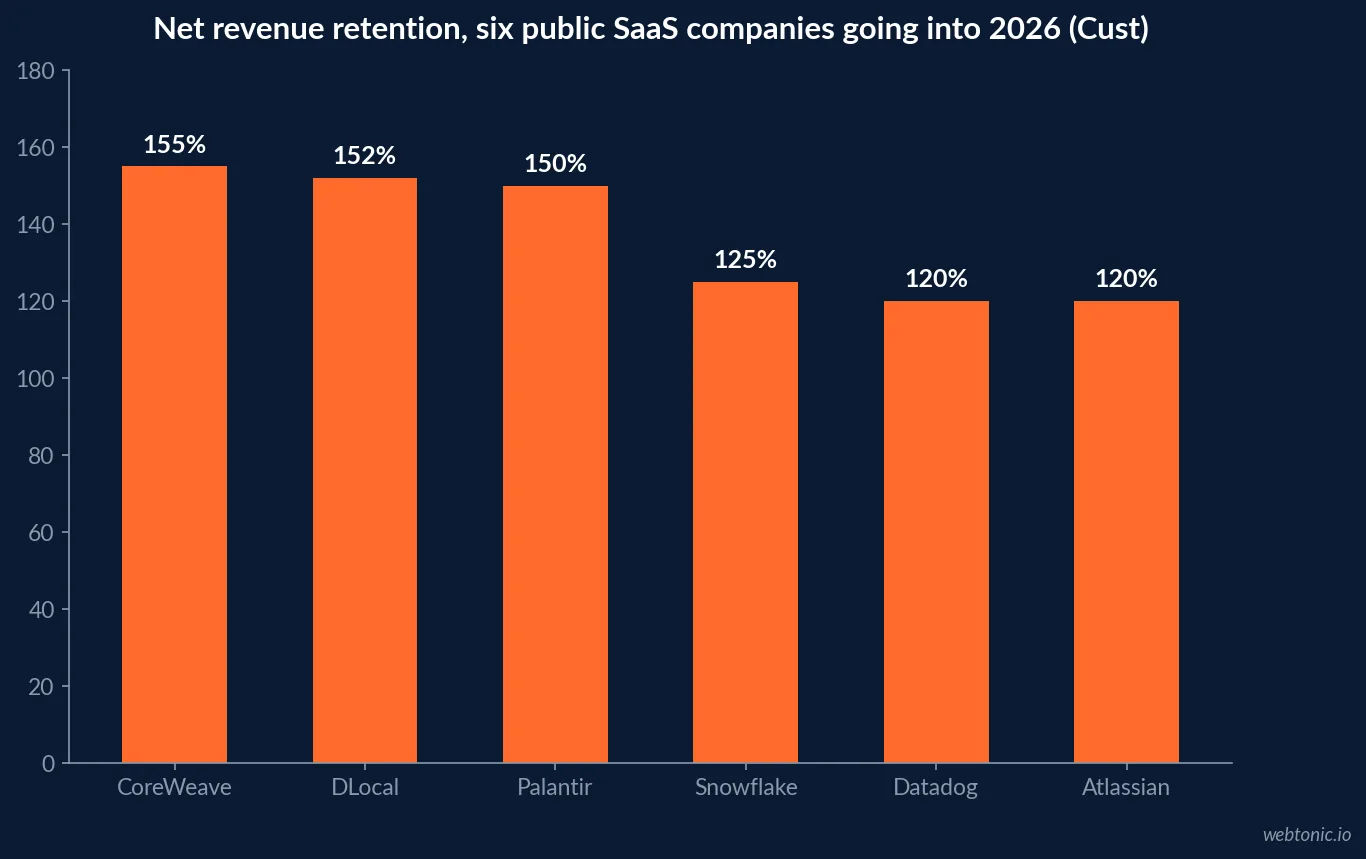
Cust's dataset of 105 public B2B SaaS companies, sourced directly from SEC filings across 913 verified disclosures, finds median NRR at 122% going into 2026, with the top decile clearing 155%. Public standouts include CoreWeave at 155%, DLocal at 152% and Palantir at 150% in their most recently disclosed periods. The 2024-2026 window has also been a period of broad NRR compression: 2022 standouts such as Snowflake, then at 178%, have settled into the 110-130% range as expansion-led growth runs into saturation.
| Public SaaS company (2026 disclosure) | NRR | Vertical |
|---|---|---|
| CoreWeave | 155% | AI Infrastructure |
| DLocal | 152% | Fintech SaaS |
| Palantir | 150% | AI Infrastructure |
| Snowflake | 125% | AI Infrastructure |
| Datadog | 120% | Dev Tools |
| Atlassian | 120% | Collaboration Software |
Gross revenue retention: the number without a safety net
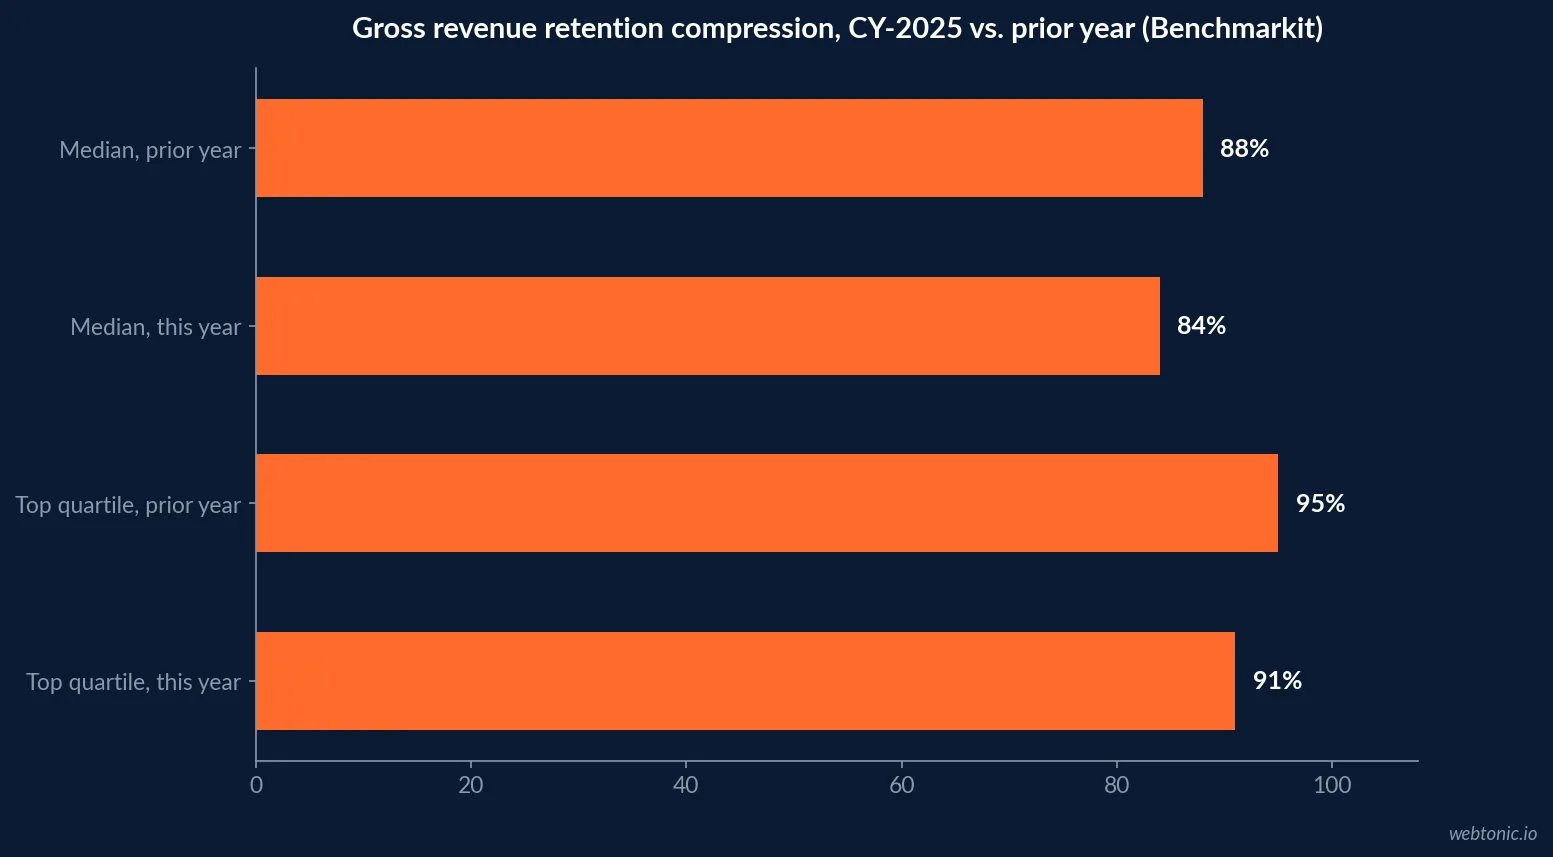
Gross revenue retention strips out every dollar of expansion, so it shows what a CS function held onto without any credit for upsell or cross-sell. Benchmarkit's CY-2025 report, covering 342 B2B SaaS and AI-native companies, puts median GRR at 84% - down from 88% the prior year - with the top quartile at 91%, also down from 95%. The gap between an 84% GRR and a 122% NRR at the same hypothetical company is almost entirely the expansion motion the CS team drove on top of pure retention.
ChartMogul's SaaS Benchmarks Report shows what the best of that expansion motion looks like: 40% of SaaS businesses in the USD 15-30M ARR range already run negative net MRR churn, the point where expansion revenue exceeds every dollar of churn and contraction combined.
| Benchmarkit CY-2025 signal | This year | Prior year | Direction |
|---|---|---|---|
| Median gross revenue retention | 84% | 88% | Compressing |
| Top-quartile gross revenue retention | 91% | 95% | Compressing |
| Median net revenue retention | 102% (Benchmarkit sample) | - | - |
| Usage-based NRR | 108% | - | - |
| Seat-based NRR | 98% | - | - |
Churn rate is the raw material both retention numbers are built from
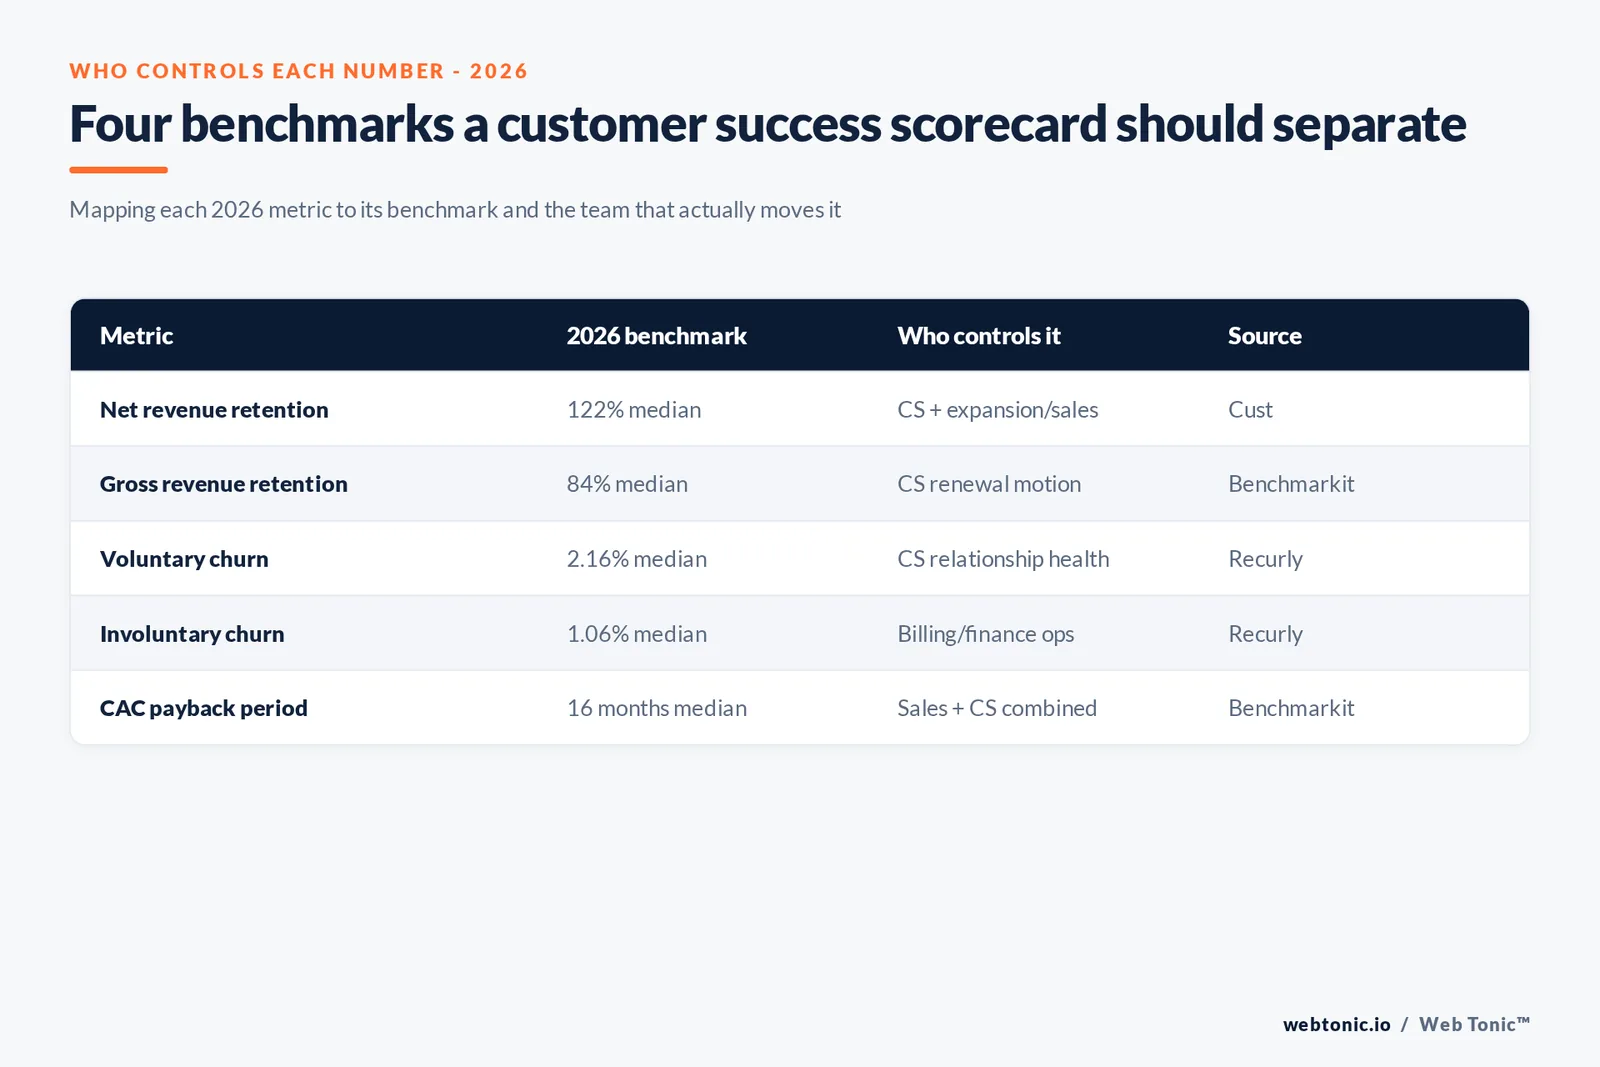
Recurly's 2026 network data puts median annual SaaS churn at 3.22% (voluntary 2.16%, involuntary 1.06%), with top-quartile performers at 1.78% or below. That split matters for how a CS team should be judged: involuntary churn is a billing-operations failure the finance and product teams can fix without a single renewal conversation, while voluntary churn is the number that actually reflects CS performance.
Inside the USD 250-plus ARPC enterprise cohort, involuntary churn drops to just 0.18%, meaning enterprise CS teams are being judged almost entirely on the voluntary rate - there is very little billing noise left to blame.
| Churn component (Recurly, 2026) | SaaS overall | Enterprise (USD 250+ ARPC) |
|---|---|---|
| Total annual churn | 3.22% | 3.54% |
| Voluntary churn | 2.16% | — (majority of the total) |
| Involuntary churn | 1.06% | 0.18% |
What a saved renewal is actually worth
The financial case for customer success runs through acquisition economics, not just the renewal line itself. Benchmarkit's CY-2025 data puts the median CAC payback period at 16 months and the median LTV:CAC ratio at 4.1x, with a median blended CAC ratio of USD 1.30 spent per dollar of new revenue. Every renewal a CS team protects keeps accruing revenue past the point sales and marketing assumed break-even, which is the concrete mechanism behind "retention is cheaper than acquisition" - it is not a slogan, it is a payback-period calculation.
AI is already inside the renewal motion
Salesforce's 2026 State of Sales report, surveying 4,050 sales and revenue professionals across 22 countries, finds 94% of sales leaders with AI agents already in place call them essential to hitting targets, and roughly nine in ten teams use agents or expect to within two years. For CS specifically, the tooling question is less about adoption and more about whether the underlying account data is trustworthy enough to automate against - see the data-quality section below before scaling any AI-driven renewal workflow.
The support layer underneath the success metrics
Support experience still sets the tone for whether a renewal conversation starts from goodwill or frustration. Zendesk's 2026 CX Trends research, drawing on more than 11,000 respondents worldwide, finds 83% of consumers still believe service experiences should be better than they are today, and 76% would choose a company that lets them move between text, image and video in one support thread. Those are support metrics, not CS metrics, but a team that ignores them is negotiating a renewal against a customer whose most recent experience already needed to be better.
Why the data behind these numbers is the real risk
Every benchmark on this page depends on a customer or billing record being accurate, and 2026 evidence on that record is uneven. Validity's survey of 602 CRM users and administrators found 76% saying less than half of their organization's CRM data is accurate and complete, and 37% reporting lost revenue tied directly to poor data quality. A CS team reporting NRR or churn off a record that is wrong half the time is not reporting a benchmark - it is reporting a guess with a percentage sign attached.
How CS comp and headcount decisions read these numbers
Renewal-cycle math also decides how a CS org gets staffed and paid. HubSpot's State of Sales in 2026 report, based on interviews with 1,000-plus sales and revenue professionals, finds AI use now standard across revenue teams rather than a differentiator - which shifts the CS headcount argument from "how many people" to "how many accounts per person, once AI absorbs the reporting and data-gathering work." A team that cannot show its NRR, GRR and voluntary-churn numbers cleanly is the one still buying headcount to compensate for a measurement gap rather than a genuine capacity gap.
Bain & Company's NPS Prism benchmarking, surveying more than 20,000 consumers per industry across 10-plus industries, is the leading-indicator layer most CS scorecards still skip: a relationship-loyalty score sliding while episode scores hold steady is visible in an NPS program months before it shows up as churn in any of the tables above.
| Leading and lagging signal (2026) | Figure | Source |
|---|---|---|
| Sales/revenue professionals surveyed for AI-in-CS context | 1,000+ | HubSpot State of Sales 2026 |
| Consumers surveyed per industry for loyalty benchmarking | 20,000+ | Bain & Company NPS Prism |
| Industries covered by that loyalty benchmark | 10+ | Bain & Company NPS Prism |
How to build a CS scorecard from this data
Report net and gross revenue retention side by side, never one alone, so expansion and pure retention are visible separately. Split churn into voluntary and involuntary before assigning accountability, since only the voluntary share is genuinely a CS outcome. Then audit the CRM record the whole scorecard depends on before trusting any of it in a board deck. Our data and analytics practice builds that retention and churn instrumentation, and our growth marketing practice can connect the acquisition side of the CAC payback math once the renewal data is trustworthy. See our guide to what acquisition actually costs before setting a payback target, or talk to us about the build.
None of the benchmarks above are a target to hit blindly. A 122% median NRR describes a population of public companies with very different contract structures, ACVs and expansion motions, and a business well below that number with clean gross retention and disciplined voluntary-churn tracking is in a stronger position than one hitting the median on inflated, unverified account data. Benchmark the method, not just the headline figure.
Frequently Asked Questions
What metrics is customer success measured on in 2026?
The two headline numbers are net revenue retention (NRR) and gross revenue retention (GRR). Cust's 2026 dataset of 105 public B2B SaaS companies, sourced from SEC filings, finds median NRR at 122%, with the top decile clearing 155%. Benchmarkit's CY-2025 report, covering 342 B2B SaaS and AI-native companies, puts median GRR at 84%. CS teams are increasingly judged on both together, since GRR shows whether they stopped the bleeding and NRR shows whether they also grew the account.
What is a good net revenue retention rate for a SaaS company?
Cust's SEC-sourced data puts the 2026 median at 122%, so anything meaningfully below that is behind the public-company benchmark, while the top decile above 155% - companies like CoreWeave and DLocal - shows what a strong expansion motion can add on top of pure retention. The 2024-2026 period has also been one of broad NRR compression: several 2022 standouts such as Snowflake (178% at its peak) have settled into the 110-130% range as expansion-led growth meets market saturation.
How does churn rate connect to customer success benchmarks?
Churn rate is the raw input that revenue retention nets against expansion. Recurly's 2026 network data puts median annual SaaS churn at 3.22% (voluntary 2.16%, involuntary 1.06%), with top-quartile performers at 1.78% or below. A customer success team's core job is keeping the voluntary component of that number down, since involuntary churn is mostly a billing-operations problem, not a relationship one.
Does customer success affect payback period and LTV, not just retention?
Yes. Benchmarkit's CY-2025 data across 342 companies puts the median CAC payback period at 16 months and the median LTV:CAC ratio at 4.1x. A renewal a CS team protects does not just avoid a churn event - it also shortens the effective payback period on every dollar of acquisition spend already committed, because that customer's revenue keeps accruing past the point sales and marketing assumed break-even.
What is the difference between customer success and customer support benchmarks?
Support benchmarks measure response time, resolution and satisfaction on individual tickets - Zendesk's 2026 CX Trends research, for instance, reports 83% of consumers still believe support experiences should be better than they are today. Customer success benchmarks measure account-level outcomes over a renewal or contract cycle: retention, expansion and churn. A team can score well on support tickets and still lose the account if the success metrics behind it are ignored.
Sources
Cust - 2026 State of Customer Success, SaaS retention benchmarks
Benchmarkit - CY-2025 B2B SaaS performance metrics benchmarks
Recurly - Churn rate benchmarks by industry, 2026
ChartMogul - SaaS Benchmarks Report
Salesforce - State of Sales Report, 2026 (7th edition)
Zendesk - CX Trends 2026 report
Validity - The State of CRM Data Management in 2025
HubSpot - The State of Sales in 2026
Bain & Company - NPS Prism benchmarking


