



Table of contents

Global cross-border e-commerce revenue reached roughly USD 1.2 trillion in 2026, a market-size headline that tells a marketer almost nothing about why a specific shopper in Stockholm or Sao Paulo finishes - or abandons - a checkout. This page works from consumer-behavior surveys, not trade totals, to show what actually moves a cross-border sale.
Key Takeaways
- Cross-border e-commerce revenue is about USD 1,209 billion in 2026.
- That is up from USD 562 billion in 2020, a 7.7% CAGR since 2023.
- 92% of shoppers prefer prices shown in their local currency.
- 33% will likely abandon a checkout priced only in US dollars.
- 75% of international shoppers want to buy in their native language.
- Cross-border shoppers convert about 31% less often than domestic ones.
- But their average order value runs 44% higher.
- And their return rate is about 22% lower.
- Conversion rate spans 2.51% to 3.99% across just six markets.
- Apparel and footwear are 43% of recent cross-border purchases.
- That share rises to 62% among 16-24 year-olds.
- 85% of US buyers bought a foreign brand after a social-media touch.
- 70% of those discoveries happened on Instagram.
- 56% of cross-border transactions use a digital or mobile wallet.
- PayPal processed 320 million US cross-border transactions in 2025.
- 83% of shoppers are satisfied with cross-border delivery speed.
- A 23% conversion lift follows three local payment methods per market.
The size of the market, stated honestly
ECDB's Cross-Border eCommerce 2026 report puts global cross-border revenue at approximately USD 1,209 billion in 2026, following USD 1,135 billion in 2025 and a market that only recently cleared its post-Covid air pocket - a 0.5% contraction in 2022 as physical retail reopened. The 2023-2026 window ran at a 7.7% compound annual growth rate. Capital One Shopping's cross-border research separately projects the market at USD 1.84 trillion on an 8.71% annual growth rate, with cross-border retail sales broadly projected past USD 7.5 trillion by 2028.
Those two numbers are not in conflict; they are measuring overlapping but different baskets (pure cross-border storefront revenue versus all retail sales touched by a cross-border leg). Either way, the trend line only points one direction.
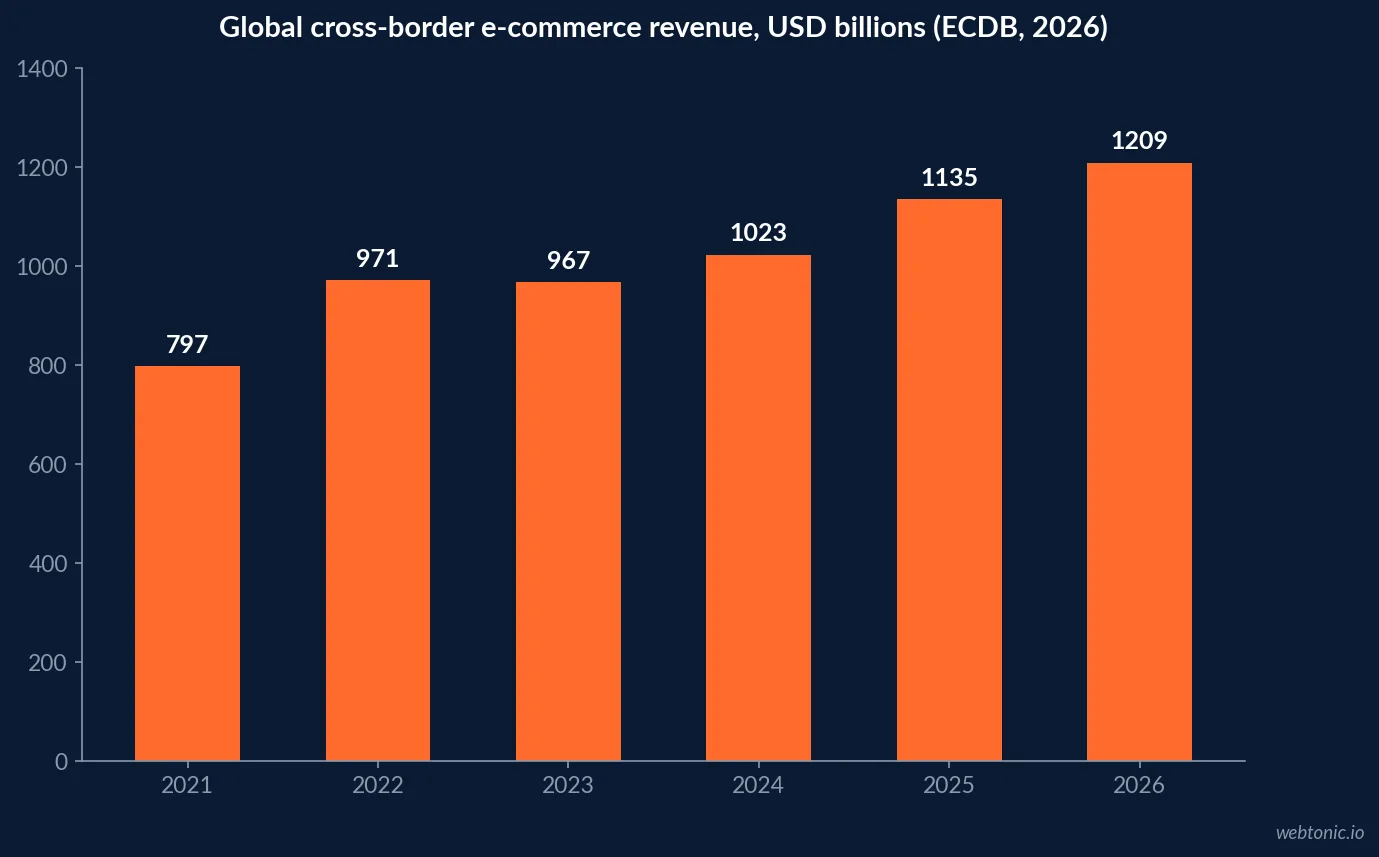
| Year | Global cross-border revenue (USD billions) | YoY change | Source |
|---|---|---|---|
| 2021 | 797 | +41.8% | ECDB, 2026 |
| 2022 | 971 | +21.8% | ECDB, 2026 |
| 2023 | 967 | -0.5% | ECDB, 2026 |
| 2024 | 1,023 | +5.8% | ECDB, 2026 |
| 2025 | 1,135 | +10.9% | ECDB, 2026 |
| 2026 | 1,209 (forecast) | +6.5% | ECDB, 2026 |
The two frictions that decide checkout
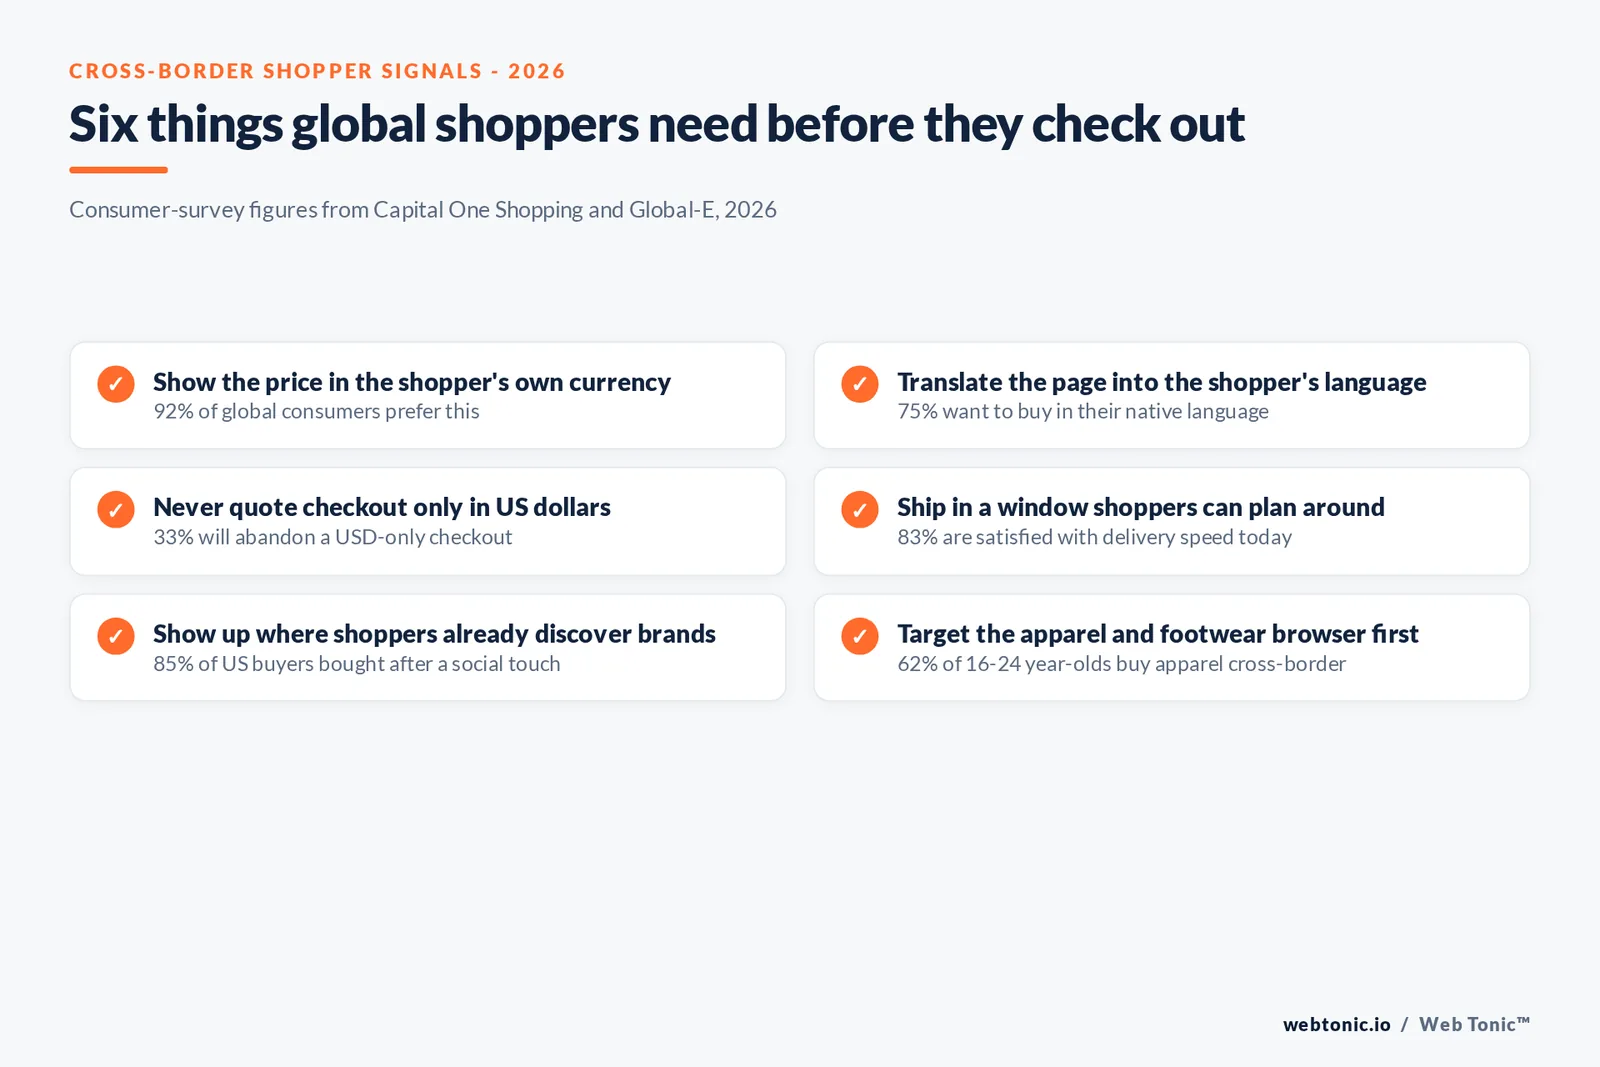
Currency and language are not localization nice-to-haves; they are the two biggest levers on cross-border cart abandonment. Capital One Shopping's data shows 92% of global consumers prefer purchasing from e-commerce websites that state prices in their local currency, and 33% of international e-commerce shoppers will likely abandon an online purchase if pricing is only available in US dollars. On language, 75% of international shoppers want to buy products online in their native language, and Spanish-speaking consumers in particular rarely or never buy from English-only websites.
Neither fix requires a new market strategy - both are checkout and product-page configuration. Getting them wrong is one of the cheapest ways to lose a cross-border sale that already cleared the harder step of getting a shopper to the site.
| Friction point | Share of shoppers affected | What it does to the sale | Source |
|---|---|---|---|
| No local-currency pricing | 92% prefer local currency | Depresses trust and completion | Capital One Shopping |
| USD-only checkout | 33% likely to abandon | Direct cart abandonment | Capital One Shopping |
| No native-language pages | 75% want native language | Lowers time-on-page and trust | Capital One Shopping |
| Missing local payment methods | 23% conversion lift with 3+ methods | Blocks payment step entirely | Adyen merchant data, 2026 |
| Unclear duties/customs fees | Rising share pay fees at delivery | Damages repeat-purchase intent | Capital One Shopping |
Conversion, order value and returns move in opposite directions
The most counter-intuitive finding in cross-border data is that a lower conversion rate does not mean a worse customer. Reporting on 2026 merchant data shows cross-border shoppers convert at a rate roughly 31% lower than domestic shoppers on the same brand's storefront - but their average order value runs about 44% higher and their return rate is about 22% lower. Run the revenue-per-visitor math with all three variables, not conversion rate alone, before deciding a cross-border segment is underperforming.
Conversion rate itself is also not one number. ECDB's E-Commerce KPI and Benchmarks Report 2026 shows a 2025 conversion rate of 2.51% in Sweden against 3.99% in the Netherlands - a spread of nearly 1.5 points hidden inside any single "global average" conversion figure.
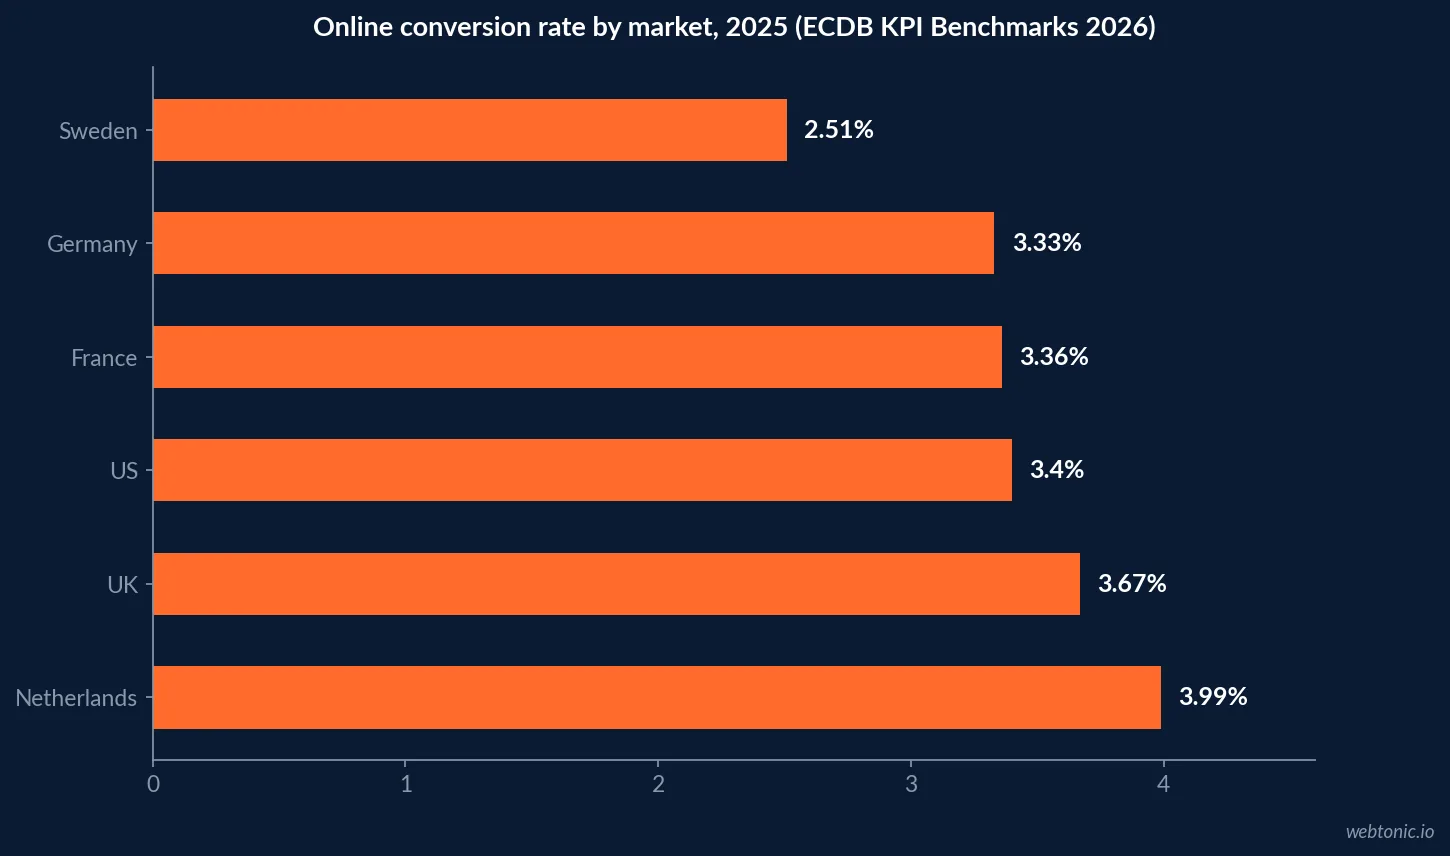
| Market | 2025 conversion rate | Distance from lowest | Source |
|---|---|---|---|
| Sweden | 2.51% | baseline | ECDB, 2026 |
| Germany | 3.33% | +0.82 pts | ECDB, 2026 |
| France | 3.36% | +0.85 pts | ECDB, 2026 |
| US | 3.40% | +0.89 pts | ECDB, 2026 |
| UK | 3.67% | +1.16 pts | ECDB, 2026 |
| Netherlands | 3.99% | +1.48 pts | ECDB, 2026 |
What cross-border shoppers actually buy
Apparel and footwear dominate cross-border demand across every age group, accounting for roughly 43% of recent cross-border e-commerce purchases overall. That share climbs to 62% among shoppers aged 16 to 24, per Capital One Shopping's breakdown, with consumer electronics (19%) and accessories (18%) trailing well behind. Physical products account for 97% of cross-border e-commerce against digital products at 3% - a reminder that fulfilment and customs, not just checkout UX, still gate most of this demand.
Discovery increasingly runs through social platforms rather than search. Global-E's US Cross-Border Ecommerce Shopper Survey found 85% of respondents purchased from a brand because they engaged with it on social media, and 70% of those engagements happened on Instagram. Our growth marketing practice builds that discovery-to-checkout path for brands expanding into new markets.
| Category or segment | Share of cross-border purchases | Note | Source |
|---|---|---|---|
| Apparel & footwear, all ages | 43% | Top category everywhere | Capital One Shopping |
| Apparel & footwear, ages 16-24 | 62% | Highest of any age band | Capital One Shopping |
| Consumer electronics | 19% | Second-largest category | Capital One Shopping |
| Physical vs. digital products | 97% / 3% | Fulfilment still dominates | Capital One Shopping |
| Discovery via social media (US) | 85% | Purchase followed a social touch | Global-E, 2026 |
| Discovery via Instagram specifically | 70% | Of the social-driven purchases above | Global-E, 2026 |
Payment and delivery are the trust layer
Payment method choice is itself a localization decision. Data cited in 2026 industry reporting shows 56% of cross-border e-commerce transactions worldwide use a digital or mobile wallet, ahead of credit cards at 20% and debit cards at 10%. PayPal's own 2026 data shows it processed over 320 million cross-border transactions for US businesses in 2025 alone, connecting more than 1.4 million US businesses to international buyers. Separately, merchant data cited in 2026 industry coverage found brands offering at least three locally preferred payment methods per market see roughly a 23% lift in cross-border conversion rate.
Delivery experience closes the loop on trust. 83% of cross-border shoppers are satisfied with the delivery speed of their most recent purchase per Capital One Shopping's data, with the majority of purchases arriving within 5 to 7 days. Where that promise breaks - unexpected customs fees at the door - is one of the more reliable ways to lose a repeat cross-border customer.
| Payment or delivery signal | 2026 figure | What it enables | Source |
|---|---|---|---|
| Digital/mobile wallet share of transactions | 56% | Table-stakes payment option | 2026 industry data |
| PayPal US cross-border transactions, 2025 | 320 million+ | Scale of one payment rail alone | PayPal, 2026 |
| US businesses selling internationally via PayPal | 1.4 million+ | SMB reach into global buyers | PayPal, 2026 |
| Conversion lift from 3+ local payment methods | ~23% | Direct revenue impact of localization | 2026 merchant data |
| Shoppers satisfied with delivery speed | 83% | Trust signal for repeat purchase | Capital One Shopping |
Reading the country-level imbalance
Cross-border demand is not evenly distributed. ECDB's data shows the United States and China sit among the largest cross-border importers, while China in particular is also a dominant exporter - most other large markets skew heavily toward importing more than they export. Practically, that means a brand's addressable cross-border audience is concentrated in a short list of countries, and the localization work above should be sequenced against where the volume actually sits rather than spread evenly across every market a store ships to.
Our data and analytics practice builds that market-priority view from a brand's own order data before recommending which currency, language and payment work to fund first.
Regional demand is lopsided, not global
Cross-border demand concentrates hard in Asia. Capital One Shopping's data shows 64% of global e-commerce sales come from Asian markets, with China alone commanding 51.1% of the world's e-commerce sales and an estimated 937 million Chinese consumers, or 66.7% of the population, buying online in 2025. Europe shows the opposite pattern - demand for imports rather than a dominant exporter - with 25% of EU consumers buying from non-EU sellers and Portugal recording Europe's largest cross-border import share at 41% of total online sales shipped in from foreign retailers.
Canada leads North American cross-border buying at 55.5% of online shoppers purchasing from a foreign retailer in the past year, well ahead of the wider regional average, which is one reason a US brand's second market is more often Canada than a market three time zones away.
| Region or market | Cross-border signal | 2025-2026 figure | Source |
|---|---|---|---|
| Asia (share of global e-commerce) | Regional dominance | 64% of global e-commerce sales | Capital One Shopping |
| China (share of global e-commerce) | Single-country dominance | 51.1% of world e-commerce sales | Capital One Shopping |
| China online shopping penetration | Population reach | 66.7% of population (937M consumers) | Capital One Shopping |
| EU consumers buying from non-EU sellers | Import demand | 25% | Capital One Shopping |
| Portugal's cross-border import share | Import concentration | 41% of online sales | Capital One Shopping |
| Canada shoppers buying from foreign retailers | North America leader | 55.5% in the past year | Capital One Shopping |
Peak moments still move disproportionate volume
Cross-border demand also spikes around specific calendar moments rather than spreading evenly across the year. Capital One Shopping's data cites e-commerce sales in Turkey rising 269% during Black Friday 2021, and notes that roughly 50% of Indian consumers deliberately delay online purchases until Diwali sales week. Day-of-week patterns matter too: 42% of German and 40% of French online purchases occur on Mondays specifically, a scheduling detail that matters for when a cross-border promotion or ad budget should actually go live in a given market.
What this means for a cross-border launch plan
Treat currency display, native-language product pages, three-plus local payment methods and realistic delivery windows as the baseline cost of entry, not optional polish. Then measure success on revenue-per-visitor and repeat-purchase rate, not conversion rate in isolation, since a market with a lower conversion rate but a higher order value and lower return rate can still be the more profitable one to keep investing in.
If a cross-border expansion needs the media plan and the reporting layer built together, talk to us, or read how our team frames international growth on the about page before scoping the first market.
Frequently Asked Questions
How big is cross-border e-commerce in 2026?
ECDB puts global cross-border e-commerce revenue at approximately USD 1,209 billion in 2026, up from USD 1,135 billion in 2025 and USD 562 billion in 2020. The market dipped 0.5% in 2022 as physical stores reopened post-pandemic, then resumed a 7.7% compound annual growth rate through 2026. Capital One Shopping's research separately projects the market reaching USD 1.84 trillion at an 8.71% annual growth rate, and cross-border retail sales overall are projected to exceed USD 7.5 trillion by 2028.
Why do cross-border shoppers abandon their carts?
Currency and language are the two biggest friction points. Capital One Shopping's research found 92% of global consumers prefer buying from sites that state prices in their local currency, and 33% of international shoppers will likely abandon a purchase if pricing shows only in US dollars. Separately, 75% of international shoppers want to buy in their native language, and Spanish-speaking consumers rarely or never buy from English-only sites. Fix the currency and language display before touching the ad budget.
Do cross-border shoppers convert at the same rate as domestic shoppers?
No, and the gap cuts both ways on revenue. Cross-border shoppers convert at a rate reported as roughly 31% lower than domestic shoppers on the same storefront, but their average order value runs about 44% higher and their return rate about 22% lower, so the net revenue-per-visitor math can still favor the international visitor. Conversion rate itself also varies by up to 1.5 points across markets - ECDB's 2025 data shows Sweden at 2.51% against the Netherlands at 3.99% - so a single global average misleads either way.
Which products and demographics drive cross-border purchases?
Apparel and footwear lead every age group, accounting for roughly 43% of recent cross-border purchases overall and 62% among shoppers aged 16 to 24, per Capital One Shopping's data. Physical products make up 97% of cross-border e-commerce against 3% for digital products. Global-E's US shopper survey adds a discovery layer: 85% of respondents who bought from a foreign brand did so after engaging with it on social media, and 70% of those discoveries happened on Instagram specifically.
How does payment and delivery experience affect cross-border trust?
Payment method matters as much as price: 56% of cross-border e-commerce transactions worldwide use a digital or mobile wallet, ahead of credit cards at 20% and debit cards at 10%. PayPal alone reports processing over 320 million cross-border transactions for US businesses in 2025. On fulfilment, 83% of cross-border shoppers say they are satisfied with delivery speed on their most recent purchase, and a reported 23% lift in cross-border conversion follows from offering at least three locally preferred payment methods per market.
Sources
ECDB - Cross-Border eCommerce 2026 report
ECDB - E-Commerce KPI and Benchmarks Report 2026
Capital One Shopping Research - Cross-Border Online Shopping Statistics
Global-E - US Cross-Border Ecommerce Shopper Survey Report
PayPal - 15 Cross-Border Ecommerce Trends for 2026
PayPal Newsroom - No Trade Without Payments, 2026
PayPal - Cross-Border Commerce: How to Succeed in 2026
EMARKETER - Worldwide Ecommerce Benchmarks: Q2 2026


