



Table of contents
The global countertop market reached $133 billion in 2025 and is projected to hit $209.5 billion by 2034, making digital marketing essential for manufacturers, fabricators, and distributors competing for high-value remodeling contracts.
Key Takeaways
- The global countertop market is growing at a 5.02% CAGR from 2026 to 2034, reaching an estimated $209.5 billion (IMARC Group).
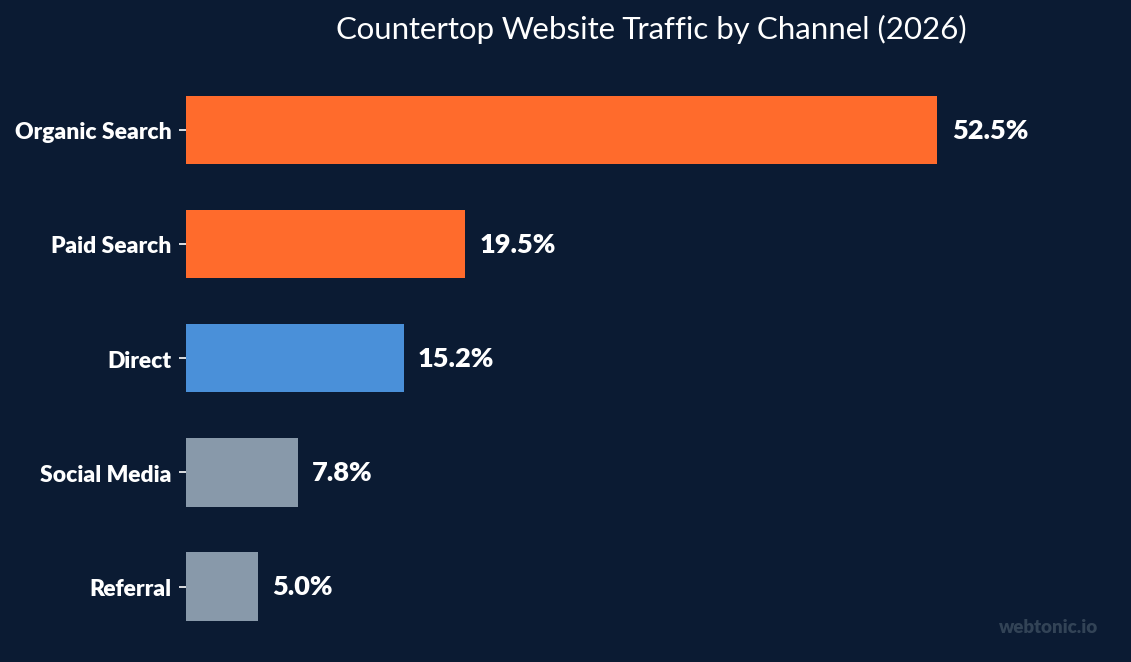
- Organic search drives 52.5% of all countertop manufacturer website traffic globally, making SEO the dominant acquisition channel (CuFinder).
- Google Ads CPC for countertop keywords averages $3.85, with high-intent terms like "quartz countertops near me" reaching $8–$12 (CuFinder).
- The average conversion rate for countertop websites is 2.9%, while top-performing sites achieve 6.5% through AR visualizers and instant quoting tools (CuFinder).
- Home improvement businesses earn $36–$42 for every $1 spent on email marketing, the highest ROI of any digital channel (Kore Komfort Solutions).
- Mobile traffic accounts for 58% of countertop site visits, up from 52% in 2024, yet desktop still drives the majority of quote requests (CuFinder).
- Kitchen remodeling leads cost between $10 and $600+ depending on the channel, with SEO delivering the lowest CPL at $10–$63 (Kitchen Remodeling SEO).
- Facebook lead ads for kitchen remodeling generate leads at $5–$167 per lead depending on offer type and market (Kitchen Remodeling SEO).
Countertop Market Size and Growth Projections
Understanding the broader market context helps digital marketers size their opportunity and allocate budgets proportionally. The countertop sector spans residential kitchen and bathroom remodeling, commercial construction, and new housing starts — all segments with distinct digital marketing needs.
| Metric | Value | Source |
|---|---|---|
| Global Market Size (2025) | $133.0 billion | IMARC Group |
| Projected Size (2034) | $209.5 billion | IMARC Group |
| CAGR (2026–2034) | 5.02% | IMARC Group |
| U.S. Countertops Market (2025) | $31.4 billion | GII Research |
| Asia Pacific Market Share | 37.1% | IMARC Group |
| North America Market Share | 28.3% | DataIntelo |
| Quartz Segment Growth Rate | 6.8% CAGR | GII Research |
| Avg. Kitchen Countertop Project Value | $3,200–$5,800 | Houzz 2026 Kitchen Trends |
The modular kitchen trend and rising demand for engineered quartz and natural stone surfaces are primary growth drivers. For digital marketers, the high average project value ($3,200–$5,800) means even modest conversion rate improvements translate into significant revenue gains. Countertop manufacturers like Caesarstone, Cambria, and Wilsonart are investing heavily in direct-to-consumer digital channels to complement their traditional distributor networks.
Website Traffic and Digital Channel Benchmarks
Knowing where countertop buyers come from and how they behave on-site is critical for budget allocation. These benchmarks are drawn from an analysis of 47 countertop fabricators, national surface brands, and stone distributors tracked through 2026.
| Channel / Metric | Benchmark | Notes |
|---|---|---|
| Organic Search (Global) | 52.5% | Dominant traffic source |
| Paid Search (U.S.) | 19.5% | Higher in competitive metros |
| Direct Traffic | 15.2% | Brand awareness indicator |
| Social Media | 7.8% | Instagram and Pinterest lead |
| Referral Traffic | 5.0% | Houzz, Angi, design blogs |
| Mobile Traffic Share | 58% | Up from 52% in 2024 |
| Average Session Duration | 2 min 45 sec | AR visualizers boost engagement |
| Pages Per Session | 3.8 | Higher than home improvement avg. |
| Bounce Rate (Average) | 48% | Top 20% hit 35% |
The dominance of organic search (52.5% of global traffic) underscores the importance of SEO and content marketing for countertop businesses. Paid search captures 19.5% of U.S. traffic, reflecting the commercial intent behind keywords like "quartz countertops near me" and "kitchen countertop installation." Companies using AR visualizer tools on their websites see session durations climb above 3 minutes, directly correlating with higher quote request rates.
Google Ads and Paid Search Performance
Pay-per-click advertising remains the fastest path to qualified leads for countertop companies. However, rising competition from national brands and eco-friendly surface manufacturers is pushing costs higher across all ad formats.
| PPC Metric | Countertops Avg. | Home Improvement Avg. |
|---|---|---|
| Google Ads CPC | $3.85 | $3.50–$6.50 |
| High-Intent CPC | $8–$12 | $10–$25 |
| Search CTR | 4.2% | 3.5%–5.0% |
| Conversion Rate (Website) | 2.9% | 2.5%–4.0% |
| Top Performer CVR | 6.5% | 5.0%–8.0% |
| Cost Per Lead (Avg.) | $45–$85 | $40–$120 |
| Google LSA CPL | $49–$112 | $25–$150 |
The average Google Ads CPC of $3.85 for countertop keywords is competitive within the home improvement vertical. Long-tail keywords like "engineered quartz countertops installation [city]" often deliver CPCs 40–60% below the category average while maintaining strong conversion intent. Smart Google Ads strategies targeting these high-intent keywords can reduce cost per lead to $45–$65 for qualified quote requests.
Lead Generation Cost by Channel
Not all digital marketing channels deliver leads at the same cost or quality. This breakdown helps countertop businesses allocate marketing budgets based on lead economics and supply chain considerations.
| Channel | Cost Per Lead | Lead Quality |
|---|---|---|
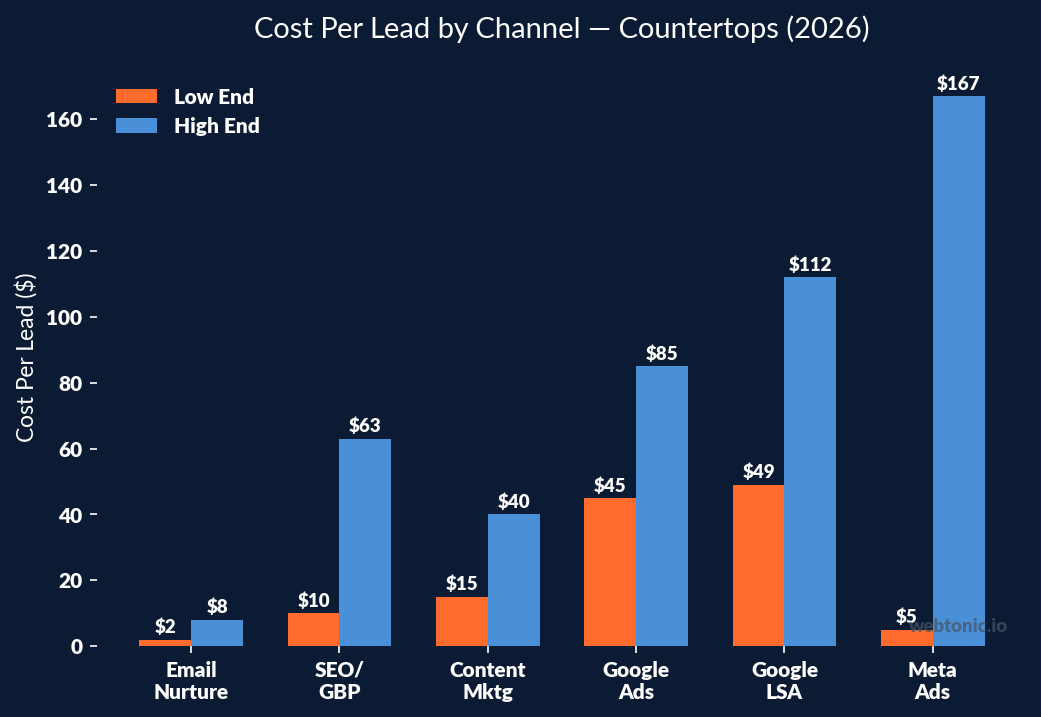
| SEO / Google Business Profile | $10–$63 | High (active searchers) |
| Google Ads (Search) | $45–$85 | High (intent-driven) |
| Google Local Services Ads | $49–$112 | High (verified) |
| Facebook / Meta Lead Ads | $5–$167 | Medium (awareness stage) |
| Home Advisor / Angi | $25–$75 | Medium (shared leads) |
| Email Marketing (Nurture) | $2–$8 | High (warm contacts) |
| Content Marketing / Blog | $15–$40 | Medium-High (educational) |
SEO delivers the lowest cost per lead at $10–$63 when measured at maturity, but requires 6–12 months of consistent investment before delivering results. For countertop companies seeking immediate lead flow, Google Ads provides predictable lead volume at a $45–$85 CPL. The wide range on Facebook lead ads ($5–$167) reflects the gap between well-optimized local campaigns and broader brand awareness efforts.
Conversion Rate Optimization Benchmarks
Converting website visitors into quote requests is where countertop companies either thrive or bleed ad spend. The gap between average and top-performing conversion rates represents a significant growth opportunity for most fabricators and distributors.
- Average countertop website conversion rate: 2.9% across all traffic sources (CuFinder 2026 benchmarks).
- Top 20% of countertop sites convert at 6.5%, primarily through instant quoting tools and AR material visualizers.
- Mobile conversion rates trail desktop by 35% despite accounting for 58% of traffic — a critical gap for businesses without mobile-optimized quote forms.
- Sites with AR countertop visualizers see 2.3x higher engagement and 40% more quote completions.
- Live chat or instant quote widgets increase conversion rates by 28–45% compared to contact-form-only sites.
- Landing pages with customer project galleries convert 22% higher than generic product pages for local searches.
- Page load time under 2.5 seconds correlates with 15% higher conversion rates across countertop manufacturer sites.
The most impactful quick win for most countertop businesses is closing the mobile conversion gap. With 58% of traffic coming from mobile devices but most quotes submitted on desktop, adding click-to-call buttons, simplified mobile forms, and SMS quote follow-ups can capture leads that currently bounce from mobile sessions.
Social Media Marketing Performance
Social media plays a growing role in the countertop customer journey, particularly for visual discovery and brand awareness. Instagram and Pinterest are the dominant platforms for surface material inspiration, while LinkedIn drives B2B relationships with designers and builders.
| Platform | Engagement Rate | Primary Use Case |
|---|---|---|
| 1.45% | Visual showcases, project galleries | |
| 0.85% | Kitchen design inspiration | |
| 0.65% | Local community, reviews | |
| 1.20% | B2B, designer partnerships | |
| TikTok | 2.10% | Process videos, transformations |
Instagram leads social engagement at 1.45% for countertop businesses, driven by before-and-after project galleries featuring quartz, granite, and marble installations. TikTok shows the highest raw engagement rate (2.10%) with fabrication process videos and kitchen transformation content, though its audience skews younger and converts at lower rates for high-ticket remodeling projects.
SEO and Content Marketing Statistics
With organic search driving over half of all countertop website traffic, search engine optimization is the highest-ROI long-term investment for manufacturers and fabricators targeting qualified leads through digital channels.
- 52.5% of countertop manufacturer traffic comes from organic search, the single largest channel (CuFinder).
- "Quartz countertops" keywords generate 450,000+ monthly U.S. searches, with "near me" variants growing 18% year-over-year.
- Local SEO drives 3x more qualified leads per dollar than paid search for single-location fabricators.
- Content marketing costs 62% less per lead than paid advertising while producing 3x as many leads over 12 months (StructureM).
- Countertop companies ranking on page one receive 91% of all organic clicks, reinforcing the importance of top-3 positioning.
- Blog content targeting "countertop material comparison" keywords generates 4x more engagement than product-only pages.
- Voice search queries for "best countertop material" grew 24% in 2025, requiring natural language optimization.
For growth marketing strategies, countertop businesses should prioritize local SEO, material comparison content, and Google Business Profile optimization. These efforts compound over time, reducing the overall cost per lead while building brand authority against competitors relying solely on paid channels.
Industry vs. All-Industries Digital Marketing Comparison
| Metric | Countertops | All Industries Avg. | Difference |
|---|---|---|---|
| Google Ads CPC | $3.85 | $2.69 | +43% |
| Website CVR | 2.9% | 3.75% | -23% |
| Organic Traffic Share | 52.5% | 53% | -1% |
| Bounce Rate | 48% | 47% | +2% |
| Email Open Rate | 23.5% | 21.3% | +10% |
| Social Engagement (Avg.) | 1.05% | 0.60% | +75% |
| Email Marketing ROI | $39 per $1 | $36 per $1 | +8% |
Countertop businesses pay 43% more per click than the all-industries average, reflecting the high competition and project values in the remodeling sector. However, they also benefit from 75% higher social media engagement (driven by visual content appeal) and above-average email marketing ROI. The lower-than-average conversion rate (2.9% vs. 3.75%) highlights the opportunity gap — performance creative and CRO improvements could unlock significant revenue.
Best Practices for Countertop Digital Marketing
- Invest in local SEO and Google Business Profile optimization — organic search delivers 52.5% of traffic at the lowest cost per lead ($10–$63).
- Deploy AR visualizer tools on your website — companies using augmented reality material selectors see 2.3x engagement and 40% more quote completions.
- Target long-tail keywords in Google Ads — phrases like "engineered quartz countertops installation [city]" deliver CPCs 40–60% below the $3.85 average.
- Build mobile-first quote experiences — 58% of traffic is mobile, but most conversions happen on desktop due to poor mobile forms.
- Create material comparison content — blog posts comparing granite, quartz, marble, and eco-friendly surfaces generate 4x more engagement than product pages.
- Implement email nurture sequences — email marketing delivers $39 ROI per $1 spent, the highest of any digital channel for home improvement.
- Showcase fabrication processes on social media — TikTok process videos drive 2.10% engagement rates, building trust before prospects request quotes.
- Track cost per booked project, not just cost per lead — with project values of $3,200–$5,800, even an $85 CPL can deliver 30–60x ROAS on closed deals.
Related reading
- Food Service & Catering Digital Marketing Statistics: Benchmarks and Performance Data
- Health & Wellness Digital Marketing Statistics 2026: Benchmarks, CPA & Market Growth
- HVAC Digital Marketing Stats (2026)
- Marketing Strategy Consulting services at Web Tonic
FAQ
What is the average Google Ads CPC for countertop businesses in 2026?
The average Google Ads CPC for countertop keywords is $3.85 in 2026, according to CuFinder benchmarks. High-intent keywords like "quartz countertops near me" or "kitchen countertop installation" can cost $8–$12 per click. Long-tail geographic keywords typically cost 40–60% less while maintaining strong conversion intent for local fabricators and installers.
How much does a countertop lead cost through digital marketing?
Countertop leads cost between $10 and $167 depending on the channel. SEO and Google Business Profile deliver the cheapest leads at $10–$63 at maturity, Google Ads averages $45–$85 per lead, and Facebook lead ads range from $5–$167 depending on offer type and targeting. Email marketing nurture campaigns cost just $2–$8 per re-engaged lead, making them the most cost-efficient channel for existing contacts.
What conversion rate should countertop websites target?
The industry average conversion rate for countertop websites is 2.9% in 2026. Top-performing countertop companies achieve 6.5% conversion rates by implementing AR visualizer tools, instant quoting widgets, and mobile-optimized forms. If your site converts below 2.9%, focus on page speed optimization, click-to-call buttons, and project gallery landing pages before increasing ad spend.
Which digital marketing channel delivers the best ROI for countertop companies?
Email marketing delivers the highest ROI at $39 per $1 spent for home improvement businesses, followed by SEO at $10–$63 CPL at maturity. For immediate results, Google Ads provides predictable lead flow at $45–$85 CPL. The best strategy combines paid search for immediate leads, SEO for long-term cost reduction, and email nurturing to maximize lifetime customer value across the supply chain.
How important is mobile optimization for countertop marketing?
Mobile optimization is critical — 58% of countertop website traffic comes from mobile devices, up from 52% in 2024. However, mobile conversion rates trail desktop by 35%, creating a significant revenue leak. Countertop businesses that implement click-to-call, simplified mobile forms, and SMS follow-ups can capture leads that currently abandon mobile sessions before submitting a quote request.
Sources
cufinder.io/blog/benchmarks/countertop-manufacturing
imarcgroup.com/countertop-market
giiresearch.com — U.S. Countertops Market Report
dataintelo.com/report/global-countertop-market
korekomfortsolutions.com/email-marketing-contractors
pipelineon.com/blog/email-marketing-for-contractors
bgcollective.com — Google Ads Remodeler Statistics 2026
pipelineon.com — Home Service Meta Ads Q2 2026


