



Table of contents
Food Service & Catering Digital Marketing Statistics
U.S. restaurant industry sales are projected to reach $1.55 trillion in 2026, and 74% of hospitality businesses now invest in online marketing. Here are the digital marketing benchmarks shaping food service and catering strategy.
Key Takeaways
- U.S. restaurant industry sales projected at $1.55 trillion in 2026, with 859,000 active locations across the country (National Restaurant Association / Datassential)
- 74% of hospitality businesses invest in online marketing, but only 19% of independent restaurants actively invest in SEO (Searchlab / BrightLocal)
- Mobile traffic accounts for 68.4% of catering website visits, with desktop at 29.1% and tablet at 2.5% (CuFinder)
- Catering website conversion rate averages 3.8%, rising to 5.5% for PPC landing pages (CuFinder)
- Restaurants with a digital marketing strategy see 2.4× more online bookings than those without (OpenTable Insights)
- 89% of hospitality businesses use social media as a marketing channel, making it the most adopted digital channel (NRA Tech Report)
- The average hospitality business spends $450–$1,350 per month on marketing, or 3–5% of revenue — but the SBA recommends 7–8% for restaurants under $5M (Searchlab / RestaurantVelocity)
- Customer lifetime value for catering averages $12,500, with corporate clients showing a 65% repeat purchase rate within 90 days (CuFinder)
Digital Marketing Benchmarks at a Glance
The table below consolidates the core digital marketing performance metrics for food service and catering businesses in 2026, drawn from industry benchmarks and verified sources.
| Metric | 2026 Value | Context |
|---|---|---|
| Mobile traffic share | 68.4% | Desktop 29.1%, tablet 2.5% |
| Average bounce rate | 55.2% | Industry average for catering sites |
| Pages per session | 2.8 | Small-mid caterer benchmark |
| Avg. time on page | 1 min 45 sec | Engagement benchmark |
| Monthly unique visits (small-mid) | 1,500–3,500 | Organic + paid combined |
| Website conversion rate | 3.8% | All traffic sources blended |
| Landing page CVR (PPC) | 5.5% | PPC-specific traffic |
| Google Ads CPC | $2.85 | 39% below cross-industry avg |
| Customer lifetime value | $12,500 | Blended catering average |
Source: CuFinder Catering Industry Marketing Benchmarks 2026
Traffic Sources and Channel Distribution
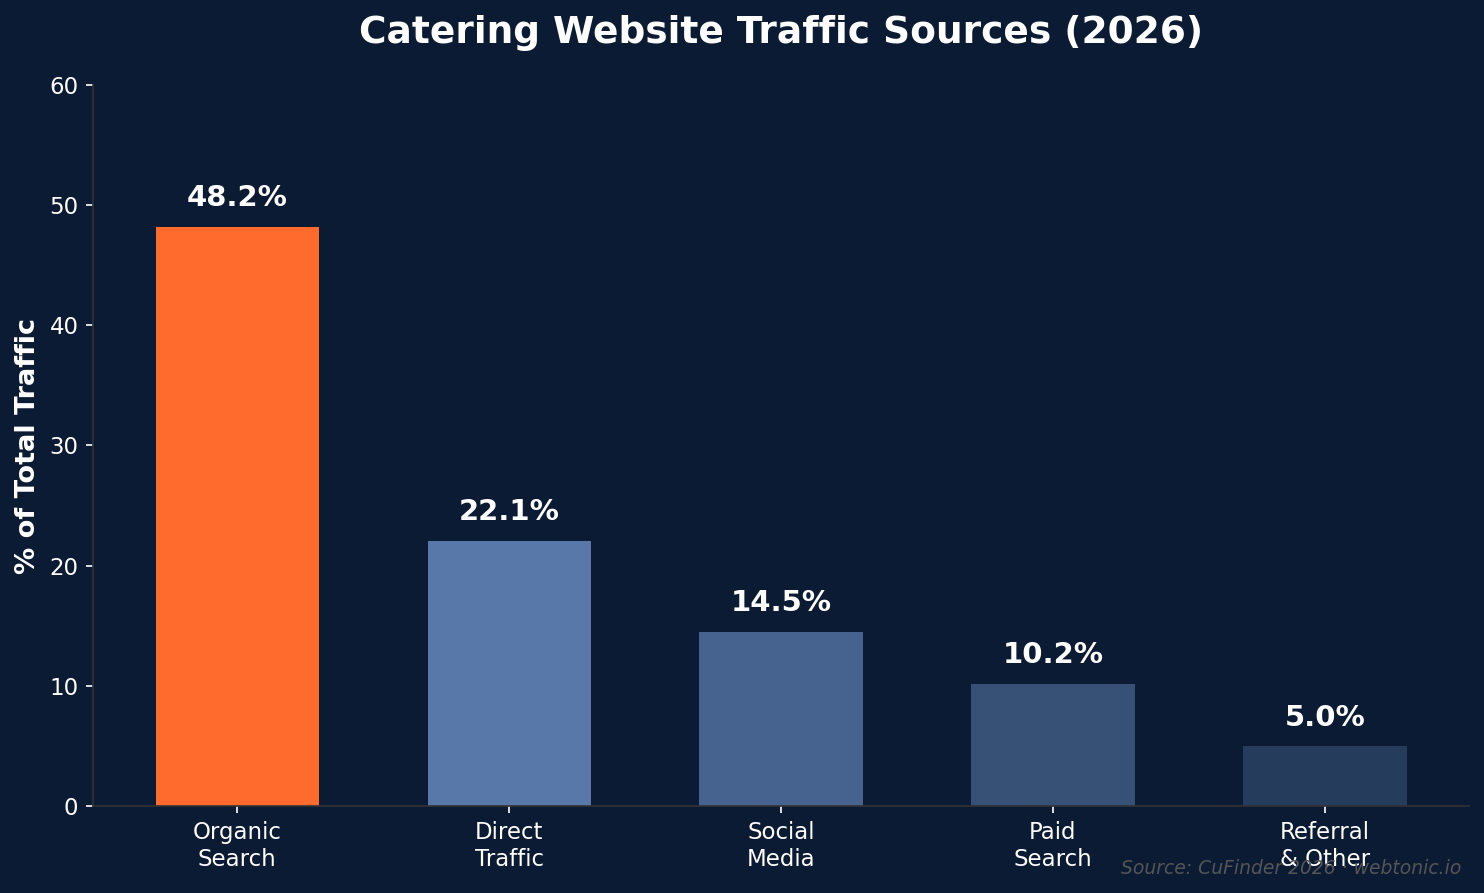
Understanding where catering customers come from is fundamental to digital marketing budget allocation. According to CuFinder's 2026 benchmarks, the traffic source distribution for catering websites globally breaks down as follows:
- Organic search: 48.2% — the dominant acquisition channel, driven by local and event-specific queries
- Direct traffic: 22.1% — reflecting brand awareness and repeat visitors
- Social media: 14.5% — Instagram and Facebook as primary discovery channels
- Paid search: 10.2% — Google Ads and Bing Ads for high-intent keywords
- Referral and other: 5.0% — venue directories, wedding planning platforms, and partner sites
The dominance of organic search reinforces why only 19% of independent restaurants investing in SEO represents a major missed opportunity. Authority Specialist's catering analysis confirms that event-specific search terms such as "corporate catering near me" and "wedding caterer" drive the highest-value inquiries, with mobile accounting for the majority of initial discovery searches. Catering companies ranking in the top-3 local pack positions convert at meaningfully higher rates than those on page two.
Marketing Budget and Spend Benchmarks
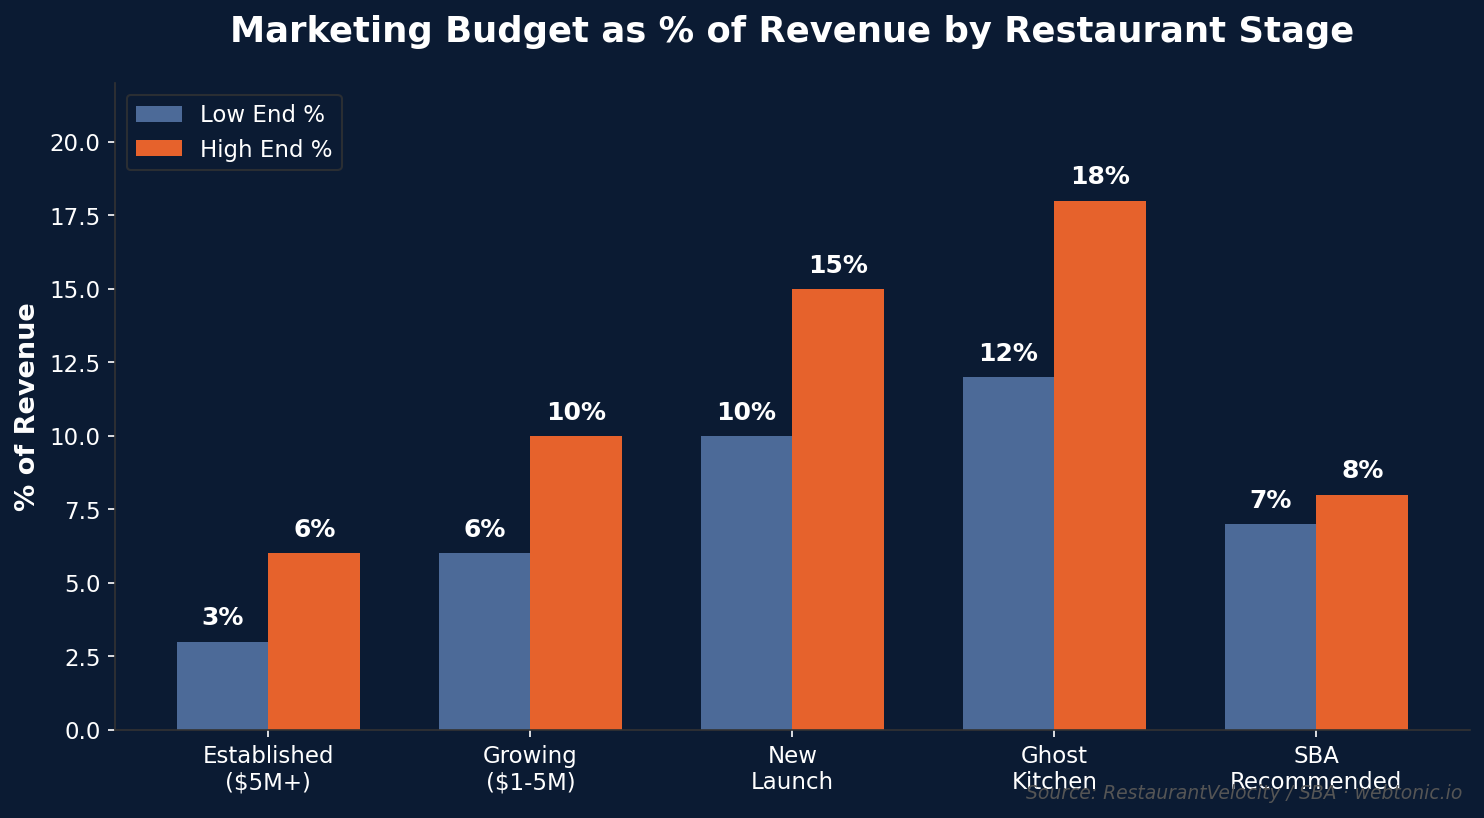
How much should food service businesses spend on digital marketing? The answer depends on revenue level and growth ambitions. Searchlab's 2026 data shows the average hospitality business spends $450 to $1,350 per month, or 3–5% of revenue.
However, RestaurantVelocity's 2026 operator guide reveals significant nuance beneath these averages:
| Revenue Level | Recommended Marketing % | Context |
|---|---|---|
| Established ($5M+) | 3–6% of revenue | Brand equity provides base traffic |
| Growing ($1–5M) | 6–10% of revenue | Acquiring new customers aggressively |
| New/launching | 10–15%+ of revenue | Building visibility from zero |
| SBA recommendation (under $5M) | 7–8% of revenue | Higher than industry convention |
| Competitive urban markets | 25–35% of revenue | New concepts in dense corridors |
| Ghost kitchens (delivery-only) | 12–18% of revenue | 100% digital visibility dependent |
The gap between the conventional "3–6% rule" and the SBA's 7–8% recommendation matters. Popeyes raised its national advertising fund from 4.5% to 5% of gross sales in April 2025, with a path to 5.5%, while McDonald's franchisees contribute approximately 4% to national advertising on top of local budgets. If professionally managed franchise systems are not operating at 3%, independent operators should question whether that floor is realistic for their own growth marketing strategy.
Social Media Marketing Performance
Social media is the most widely adopted digital marketing channel in food service, with 89% of hospitality businesses using it and 84% maintaining an active Instagram presence. The platform-by-platform performance data reveals clear winners:
- Instagram: 45% of diners have visited a restaurant after seeing it on Instagram (Toast / Social Media Today). Restaurants posting 4+ times per week see 31% more profile visits and 22% more direction requests.
- TikTok: 38 billion annual views for restaurant-related content. 67% of Gen Z choose restaurants based on social media (MGH/YPulse).
- UGC generates 6.9× higher engagement than brand-created content for restaurants (Stackla/Nosto).
- Video posts generate 4.2× more engagement than static images (Sprout Social).
- Influencer partnerships return $5.20 for every $1 spent in hospitality (Influencer Marketing Hub).
For catering companies specifically, Restroworks' analysis notes that social media has evolved from a brand-awareness tool into a full revenue engine: it drives high-intent discovery, conversion through personalization, and customer advocacy that amplifies reach without additional ad spend.
Email Marketing and Retention Benchmarks
CuFinder's catering benchmarks reveal strong retention metrics that make email marketing particularly valuable for food service businesses:
- Customer retention rate: 38% annually for the catering industry overall
- Repeat purchase rate: 65% within 90 days for corporate catering clients — the industry's most valuable segment
- Customer lifetime value: $12,500 blended average, driven heavily by recurring corporate contracts
- New vs. returning visitor ratio: 60% / 40%, indicating a substantial base for retention marketing
According to Authority Specialist's catering industry data, email marketing to past clients and event planners typically produces the highest return-per-dollar of any catering marketing channel. Only 42% of hospitality businesses use email marketing (NRA Tech Report), which means the majority of catering companies are leaving their highest-ROI channel largely untapped.
For food service businesses investing in email, the 65% repeat purchase rate among corporate clients translates directly to campaign strategy: automated post-event follow-ups and quarterly outreach to corporate contacts can drive significant recurring revenue without incremental ad spend.
SEO and Organic Search Performance
Despite organic search delivering 48.2% of all catering website traffic, SEO remains the most underinvested digital marketing channel. Only 19% of independent restaurants actively invest in SEO, according to BrightLocal, while 76% maintain a Google Business Profile — a notable gap between presence and optimization.
Authority Specialist's catering-specific analysis shows that Google Business Profile visibility matters disproportionately for catering because most searches are local and high-intent. Catering companies in mid-size markets face less search competition than those in major metros, making local SEO more accessible. Seasonal search patterns also differ significantly: Q4 and spring represent the highest-stakes ranking windows for wedding and corporate event catering.
Meanwhile, AI search is reshaping how catering buyers discover providers. Authority Specialist's study found that Gemini names specific hospitality providers in 63% of answers, more than triple ChatGPT's rate, suggesting that AI-visibility optimization is becoming a new dimension of food service SEO.
Paid Advertising Benchmarks
| Paid Channel Metric | Catering Value | Cross-Industry Avg. |
|---|---|---|
| Google Ads CPC | $2.85 | $4.66 |
| Google Ads CVR | 4.6% | 4.4% |
| Facebook/Instagram CPC | $1.15 | $1.72 |
| Facebook/Instagram CVR | 2.8% | 2.5% |
| Search Network CTR | 5.2% | 3.5% |
| Cost Per Acquisition | $42.50 | $66.69 |
| Google Shopping CPC | $0.95 | $1.24 |
Catering paid advertising costs sit well below cross-industry averages across every metric. The $2.85 CPC is 39% below the $4.66 average, while the $42.50 CPA is 36% below the $66.69 average. Combined with an above-average CVR of 4.6%, Google Ads for catering businesses represents one of the more cost-effective paid channels in local services marketing. Only 38% of hospitality businesses actively spend on paid digital ads, meaning the competitive landscape remains relatively open for food service advertisers.
Digital Marketing Best Practices for Food Service and Catering
- Prioritize mobile experience. With 68.4% of traffic coming from mobile devices, catering websites must load fast and convert on small screens. A 55.2% bounce rate suggests room for improvement on mobile UX.
- Invest in SEO before paid. Organic search delivers 48.2% of traffic and only 19% of competitors invest in it — the ROI opportunity is disproportionately large.
- Optimize your Google Business Profile. 76% of hospitality businesses maintain one, but top-3 local pack positions convert at meaningfully higher rates. Complete profiles with reviews drive booking inquiry clicks.
- Segment marketing by customer type. Corporate clients (65% repeat rate, $12,500 CLV) require different digital marketing strategies than wedding or private event prospects.
- Allocate 7–8% of revenue to marketing if under $5M. The SBA's recommendation exceeds the 3–6% industry convention, but independent operators need the higher rate to compete against franchise systems.
- Build email sequences for post-event follow-up. Email is the highest-ROI channel for catering, yet only 42% of hospitality businesses use it. Automated follow-ups to corporate clients compound the 65% repeat rate.
- Use video-first social content. 4.2× engagement advantage over static posts, 38B annual TikTok views, and 67% of Gen Z choosing restaurants based on social media all point to video as the default content format.
- Track bookings, not clicks. The AI Advantage Agency case study achieving 8× ROAS on Meta Ads credited daily optimization against confirmed bookings as the key differentiator.
FAQ
How much should a catering company spend on digital marketing?
The industry convention is 3–6% of revenue for established businesses, 6–10% for growing companies, and 10–15%+ for new launches. However, the U.S. SBA recommends 7–8% for restaurants under $5 million in revenue. In dollar terms, the average hospitality business spends $450 to $1,350 per month. Ghost kitchens allocate 12–18% because they depend entirely on digital visibility.
What is the average conversion rate for catering websites?
The average catering website conversion rate is 3.8% across all traffic sources. PPC-specific landing pages convert at 5.5%. Mobile traffic dominates at 68.4%, and the bounce rate averages 55.2%, suggesting that improving mobile page speed and user experience can lift conversion rates significantly.
Which digital marketing channels work best for food service businesses?
Organic search drives 48.2% of traffic and is the highest-volume channel. Social media accounts for 14.5%, with Instagram leading discovery (45% of diners visit after seeing a restaurant there). Only 38% of hospitality businesses use paid digital ads, meaning less competition than in most industries. Google Ads CPC for catering averages just $2.85, well below the cross-industry average.
What is the customer lifetime value for catering businesses?
The blended average CLV is $12,500, driven primarily by corporate clients who show a 65% repeat purchase rate within 90 days. The overall annual customer retention rate is 38%. Email marketing to past clients and event planners typically produces the highest return-per-dollar of any catering channel.
How important is social media for food service marketing?
89% of hospitality businesses use social media, making it the most widely adopted digital channel. Instagram is the leading platform for food discovery, with 84% of hospitality businesses maintaining an active presence. TikTok generates 38 billion restaurant-related views annually, and influencer partnerships return $5.20 per $1 spent in the hospitality sector.
Sources
CuFinder — Catering Industry Marketing Benchmarks 2026
Searchlab — Hospitality Marketing Statistics 2026
RestaurantVelocity — Restaurant Marketing Budget Guide 2026
Authority Specialist — Catering Industry Marketing Statistics
Datassential — Foodservice Industry Trends 2026
Restroworks — Restaurant Social Media Statistics
National Restaurant Association — 2026 State of the Industry
MakeMyReceipt — Food Delivery Statistics 2026


