



Table of contents

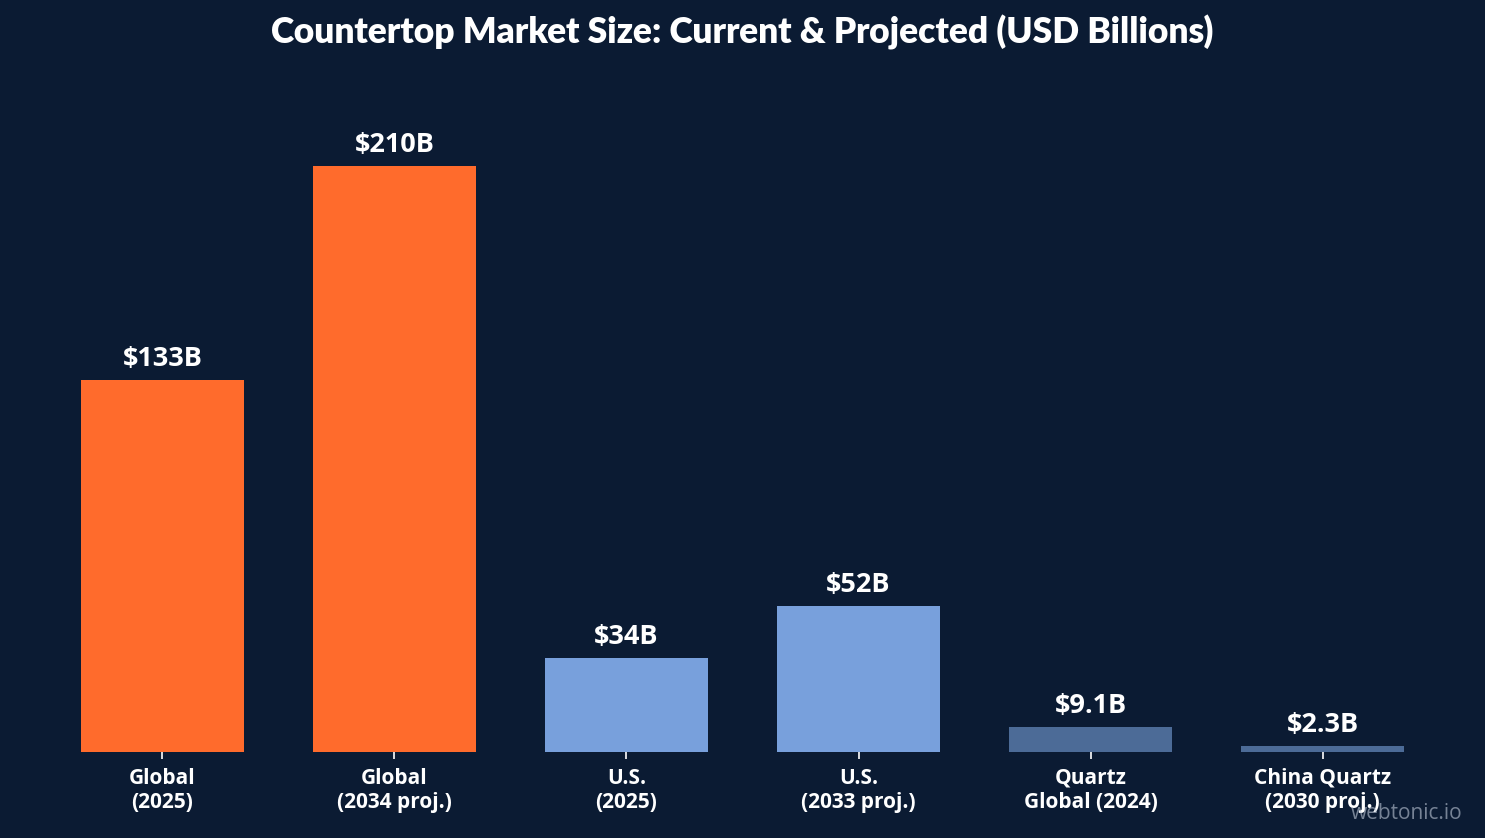
The global countertop market reached $133.0 billion in 2025, growing at a 5.02% CAGR toward $209.5 billion by 2034. Companies investing in analytics tools outperform competitors by wide margins. Here are the market data, tracking benchmarks, and insights countertop businesses need in 2026.
Key Takeaways
- The global countertop market size reached $133.0 billion in 2025, with projections to hit $209.5 billion by 2034 at a 5.02% CAGR (IMARC Group).
- The U.S. countertops market was valued at $33.77 billion and is expected to reach $52.48 billion by 2033 at a 5.7% CAGR (Grand View Research).
- Quartz countertops hold a 28.5% market share, the largest of any material, with the global quartz segment valued at $9.1 billion in 2024 (Dataintelo; GII Research).
- Countertop manufacturers average a 2.9% conversion rate, while top performers with AR visualizers reach 6.5% — a 124% gap (CuFinder, 2026).
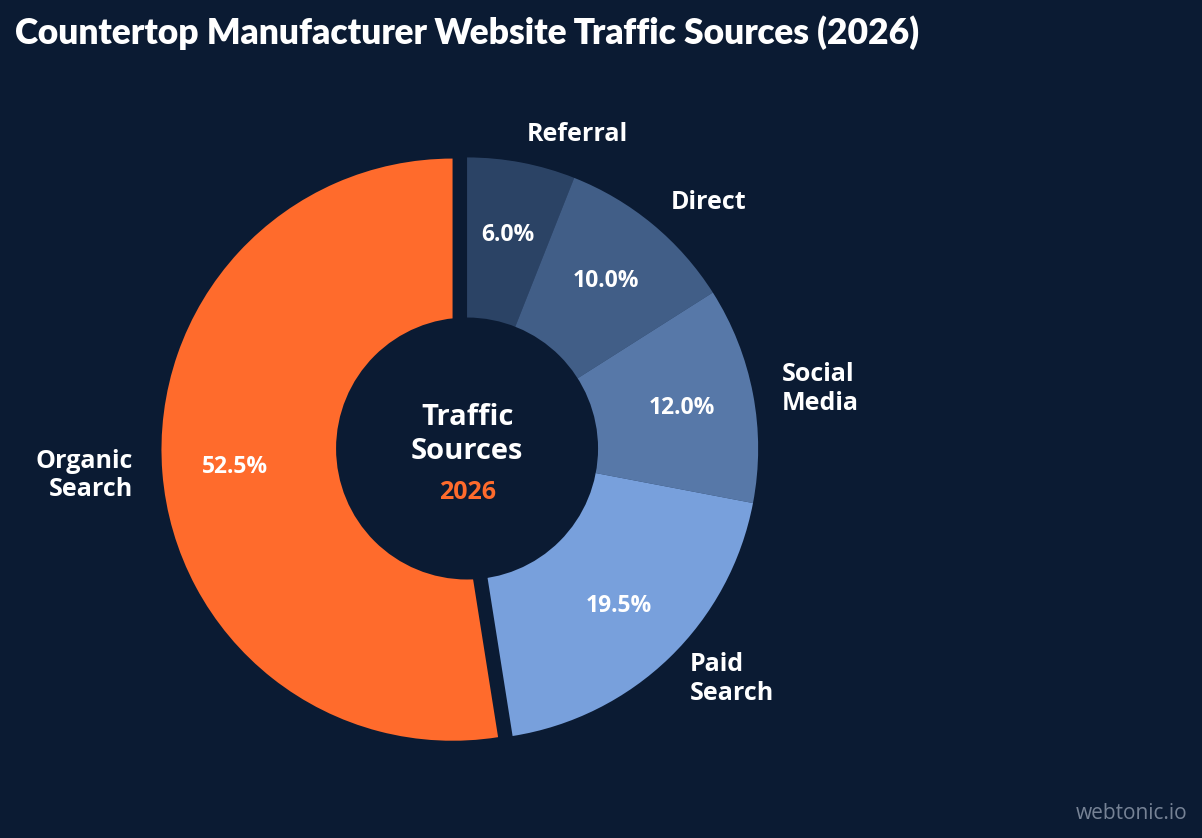
- Organic search drives 52.5% of countertop manufacturer traffic, making it the dominant analytics channel ahead of paid search at 19.5% (CuFinder).
- Multi-location countertop fabricators save $11,500/month by centralizing analytics, inventory, and workflow automation on a single platform (SlabWise, 2026).
- 91% of renovating homeowners upgrade countertops during kitchen projects, making it the #1 upgraded feature ahead of backsplashes (85%) and sinks (85%) (Houzz, 2026).
- Mobile traffic accounts for 58% of countertop website visits, up from 52% in 2024, while desktop still drives the majority of B2B quoting activity (CuFinder).
Countertop Market Size and Forecast Data
Understanding the countertop market's size and trajectory is the best starting point for any analytics strategy. The data reveals a large, steadily growing market with distinct regional and material dynamics.
| Market Metric | Value | Source | Notes |
|---|---|---|---|
| Global Market Size (2025) | $133.0 billion | IMARC Group | All materials, all applications |
| Global Forecast (2034) | $209.5 billion | IMARC Group | 5.02% CAGR |
| U.S. Market Size (2025) | $33.77 billion | Grand View Research | ~25% of global market |
| U.S. Forecast (2033) | $52.48 billion | Grand View Research | 5.7% CAGR |
| Global Quartz Segment (2024) | $9.1 billion | GII Research | Growing at 4.4% CAGR to $11.7B by 2030 |
| U.S. Quartz Segment (2024) | $2.5 billion | GII Research | Largest single-country quartz market |
| China Quartz Market (2030) | $2.3 billion (proj.) | GII Research | 6.8% CAGR — fastest major market |
| Asia Pacific Market Share | 37.1% | IMARC Group | Largest regional share |
The market size data shows that Asia Pacific dominates with a 37.1% share, driven by modular kitchen adoption in China and rapid urban construction across the region. China's quartz countertop market alone is projected to reach $2.3 billion by 2030 at a 6.8% CAGR — the fastest growth rate among major markets. For enterprise analytics platforms, this means international tracking and multi-currency reporting capabilities are increasingly important.
Quartz Countertops Market Share and Material Analytics
Material-level analytics reveal clear winners in the countertop market. Dataintelo's 2025 data shows engineered quartz commands a 28.5% market share, the largest of any single material category. Quartz countertops offer durability, low maintenance, and stain resistance — attributes that drive strong retail analytics performance.
| Material | Market Share | Key Analytics Signal | Growth Trend |
|---|---|---|---|
| Engineered Quartz | 28.5% | Highest search volume, best CVR | Stable leader |
| Granite | ~18% | Premium price, high AOV | Slow decline |
| Marble | ~12% | Highest engagement, low volume | Niche premium |
| Solid Surface | ~10% | Remodel segment, mid-tier | Stable |
| Laminate | ~8% | Budget segment, high volume | Slow decline |
For analytics teams, the quartz vs. granite tracking split matters most. Quartz countertops generate the highest search volume and conversion rates, while granite commands higher average order values. Retail store analytics should segment customer behavior by material preference to optimize pricing, inventory, and marketing attribution models.
Digital Marketing Analytics Benchmarks for Countertop Manufacturers
CuFinder's 2026 analysis across 47 countertop manufacturers provides the best available industry benchmarks. The data reveals a widening gap between analytics-mature and analytics-lagging companies.
| Analytics Metric | Industry Average | Top 20% | Gap |
|---|---|---|---|
| Website Conversion Rate | 2.9% | 6.5% | +124% |
| Bounce Rate | 48% | 35% | −13 pp |
| Avg. Session Duration | 2m 45s | 4m 10s+ | +52% |
| Pages Per Session | 3.8 | 5.5+ | +45% |
| Google Ads CTR | 4.1% | 6.0%+ | +46% |
| Google Ads CPC | $3.85 | $2.80 | −27% |
| Email Open Rate | 23.5% | 30%+ | +28% |
| Instagram Engagement | 1.45% | 2.5%+ | +72% |
The 124% conversion rate gap between top performers and the industry average is the most critical data point. Manufacturers with AR visualizer tools and transparent pricing on their platform convert at 6.5%, while those relying on request-a-quote forms average just 2.9%. This analytics insight directly impacts platform investment decisions and total cost of implementation planning.
Customer Behavior and Traffic Analytics
Understanding how customers interact with countertop websites is essential for optimizing the sales funnel. The analytics data reveals clear patterns:
- Mobile traffic: 58% — Up from 52% in 2024, mobile browsing dominates countertop research. However, desktop still drives the majority of B2B quoting and enterprise purchase activity at 38%.
- Organic search: 52.5% of traffic — The dominant channel for countertop manufacturers. Google remains the primary search platform, with "quartz countertops" and "kitchen countertop" queries generating the highest volume.
- Paid search: 19.5% — Higher in competitive metro markets where Google Ads pricing for countertop keywords rises above the $3.85 average.
- Average session duration: 2m 45s — AR visualizers and interactive store locator tools push this above 4 minutes for the best performers.
- Bounce rate: 48% — Top 20% of countertop sites achieve 35% by using real-time customer engagement features like chat and visualizers.
The 2026 Houzz Kitchen Trends Study adds consumer behavior context: 91% of renovating homeowners upgrade countertops during kitchen projects. White remains the most popular countertop color at 37%, followed by off-white at 26%. These consumer preferences should inform how analytics dashboards segment and track customer journeys from initial browse to purchase decision.
Multi-Location Analytics and Operations Data
For multi-location countertop fabrication businesses, centralized analytics platforms deliver measurable ROI. SlabWise's 2026 case study documents how a 3-location fabrication shop with 45 employees and 350+ monthly jobs achieved $11,500 in net monthly savings after implementing centralized workflow automation and analytics:
- Material savings: $5,200/month — Cross-location slab sharing and supply chain optimization reduced waste from unused inventory sitting in individual store locations.
- Remake reduction: 8 to 2 per month — AI-powered verification tools caught measurement errors before fabrication, cutting remakes by 75% across all locations.
- Admin savings: 60+ hours/month — Centralized reporting eliminated manual data consolidation that previously required each location to build separate spreadsheets.
- Implementation timeline: 6 months — The total cost of implementation was recovered within the first quarter of full deployment.
This data demonstrates that enterprise-grade analytics and data intelligence tools pay for themselves quickly in the countertop industry. Multi-location operations need a unified platform for real-time inventory visibility, pricing consistency, and customer tracking across all retail locations.
Marketing Attribution and Analytics Tool Benchmarks
Countertop businesses face unique marketing attribution challenges. The purchase journey spans multiple touchpoints — from initial Google search to showroom visit to final purchase — making cross-channel tracking essential. Industry data shows these tool adoption patterns:
- Google Analytics — The most widely used analytics platform among countertop manufacturers. Tracks website behavior, conversion funnels, and traffic sources. The best implementation includes enhanced ecommerce tracking for product-level analytics.
- CRM integration — Enterprise countertop retailers increasingly connect their analytics data with CRM platforms like Salesforce or HubSpot for end-to-end customer journey tracking.
- Marketing attribution tools — Multi-touch attribution models help countertop businesses understand which channels drive initial awareness versus final conversion. According to G2 reviews, platforms with custom pricing models that include real-time reporting score highest for countertop industry use cases.
- Call tracking — Critical for countertop businesses where phone calls drive 40–60% of leads. Analytics platforms that integrate call tracking with digital attribution provide the most complete picture.
- Heat mapping and session recording — Tools like Hotjar reveal how customers interact with product visualizers, pricing pages, and store locator features on countertop websites.
The best analytics stack for a countertop business combines Google Ads conversion tracking with CRM data and call attribution. This provides full-funnel visibility from the first ad impression through to the completed installation — the only way to calculate true customer acquisition cost and optimize marketing spend.
Analytics Implementation Best Practices for Countertop Businesses
Based on the industry data, the best countertop analytics implementations share these characteristics:
- Track material-level conversions — Segment quartz countertops, granite, marble, and solid surface queries separately. Each material attracts a different customer with different pricing expectations and purchase timelines.
- Implement cross-device tracking — With 58% mobile and 38% desktop traffic, customers frequently research on mobile but request quotes on desktop. Without cross-device analytics, attribution data will misrepresent channel value.
- Connect online and offline touchpoints — Countertop purchases typically involve a showroom visit. The best analytics platforms connect digital ad clicks to in-store foot traffic and final purchase, providing a true total cost per acquisition.
- Set up custom dashboards by location — Multi-location businesses need per-store analytics covering foot traffic, quote requests, close rates, and average order value. Enterprise tools with custom pricing tiers make this scalable.
Analytics Software and Management Systems for Countertop Businesses
Choosing the right analytics software is critical for countertop businesses looking to start tracking their performance metrics. The best systems are built specifically for the countertop and stone fabrication industry, with dedicated features for margin tracking, revenue analysis, and automated reporting that general-purpose tools lack. The right system integrates with existing workflows.
Key categories of analytics management software for countertop companies:
- Fabrication management systems — Purpose-built software like SlabWise and Moraware that track install schedules, user workflows, material margins, and per-job revenue. These dedicated pro tools connect design specifications to production data in days rather than months.
- Website analytics — Google Analytics 4 remains the most widely used app for tracking countertop website users and conversion funnels. Enhanced ecommerce tracking provides specific material-level and product-category data that standard configurations miss.
- Marketing attribution platforms — Automated multi-touch attribution systems connect ad spend to revenue, helping countertop businesses measure true margin on each acquisition channel. Implementation timelines range from 7–30 days for basic setup.
- Inventory management — Software that tracks slab inventory across locations with automated alerts when specific materials run low. Pro-tier platforms include visual slab selection tools that integrate with customer-facing design visualizers.
The total cost of analytics software for a mid-sized countertop business typically starts at $200–$500/month for entry-level systems and scales to $1,500–$5,000/month for enterprise platforms with custom built-in reporting dashboards, multi-user access, and automated margin analysis across all locations.
Related reading
- Tracking Data and Analytics for Garage Doors and Windows
- Most Renovation Retailers Miss Offline Attribution: Home Renovation Retail Tracking Data
- Google Analytics Goals: Setup Guide, Key Events & GA4 Migration
- Marketing Analytics services at Web Tonic
FAQ
How big is the countertop market in 2026?
The global countertop market was valued at $133.0 billion in 2025 and is projected to reach $209.5 billion by 2034 at a 5.02% CAGR. The U.S. market alone was worth $33.77 billion in 2025, expected to grow to $52.48 billion by 2033 at 5.7% CAGR. Asia Pacific leads with 37.1% of the global market share.
What is the average conversion rate for countertop websites?
Countertop manufacturer websites average a 2.9% conversion rate in 2026. However, top performers with AR visualizer tools and transparent pricing achieve 6.5% — a 124% improvement over the industry average. The best-performing sites also have lower bounce rates (35% vs. 48%) and longer session durations (4+ min vs. 2:45).
Which countertop material has the largest market share?
Engineered quartz countertops hold a 28.5% market share, the largest of any material. The global quartz countertop market was valued at $9.1 billion in 2024 and is projected to reach $11.7 billion by 2030. The U.S. quartz segment alone is worth $2.5 billion, while China's quartz market is growing fastest at 6.8% CAGR.
How can multi-location countertop businesses improve their analytics?
Multi-location fabricators that centralize their analytics and workflow automation platform see significant returns. One documented case study showed $11,500/month in net savings from cross-location slab sharing ($5,200), remake reduction ($3,000+), and admin time savings (60+ hours/month). Enterprise analytics implementation typically pays for itself within one quarter.
What percentage of traffic to countertop sites comes from organic search?
Organic search drives 52.5% of countertop manufacturer website traffic, making it the dominant channel. Paid search accounts for 19.5%, with higher concentration in competitive metro markets. Mobile traffic now represents 58% of all visits, up from 52% in 2024, though desktop remains dominant for B2B quoting and enterprise purchases.
Sources
IMARC Group — Global Countertop Market Size & Forecast 2034
Grand View Research — U.S. Countertops Market 2026–2033
Dataintelo — Global Countertop Market Report 2034
GII Research — Global Quartz Countertops Market 2030
CuFinder — Countertop Manufacturing Benchmarks 2026
Houzz — 2026 U.S. Kitchen Trends Study
SlabWise — Multi-Location Case Study 2026


