



Table of contents
The countertop industry's advertising landscape is shifting fast. Home improvement ad creatives achieve an average CTR of 2.92% across platforms, but TikTok countertop ads outperform at 2.17% CTR with a dramatically lower $0.90 CPC — less than a third of Google Search costs. This data report covers the ad creative benchmarks, design trends, and material-specific performance data that countertop manufacturers and kitchen remodeling firms need in 2026.
Key Takeaways
- Home improvement ads average a 2.92% CTR across all platforms, with Google Search leading and LinkedIn trailing at 0.47% (CreativeGrade, 2026).
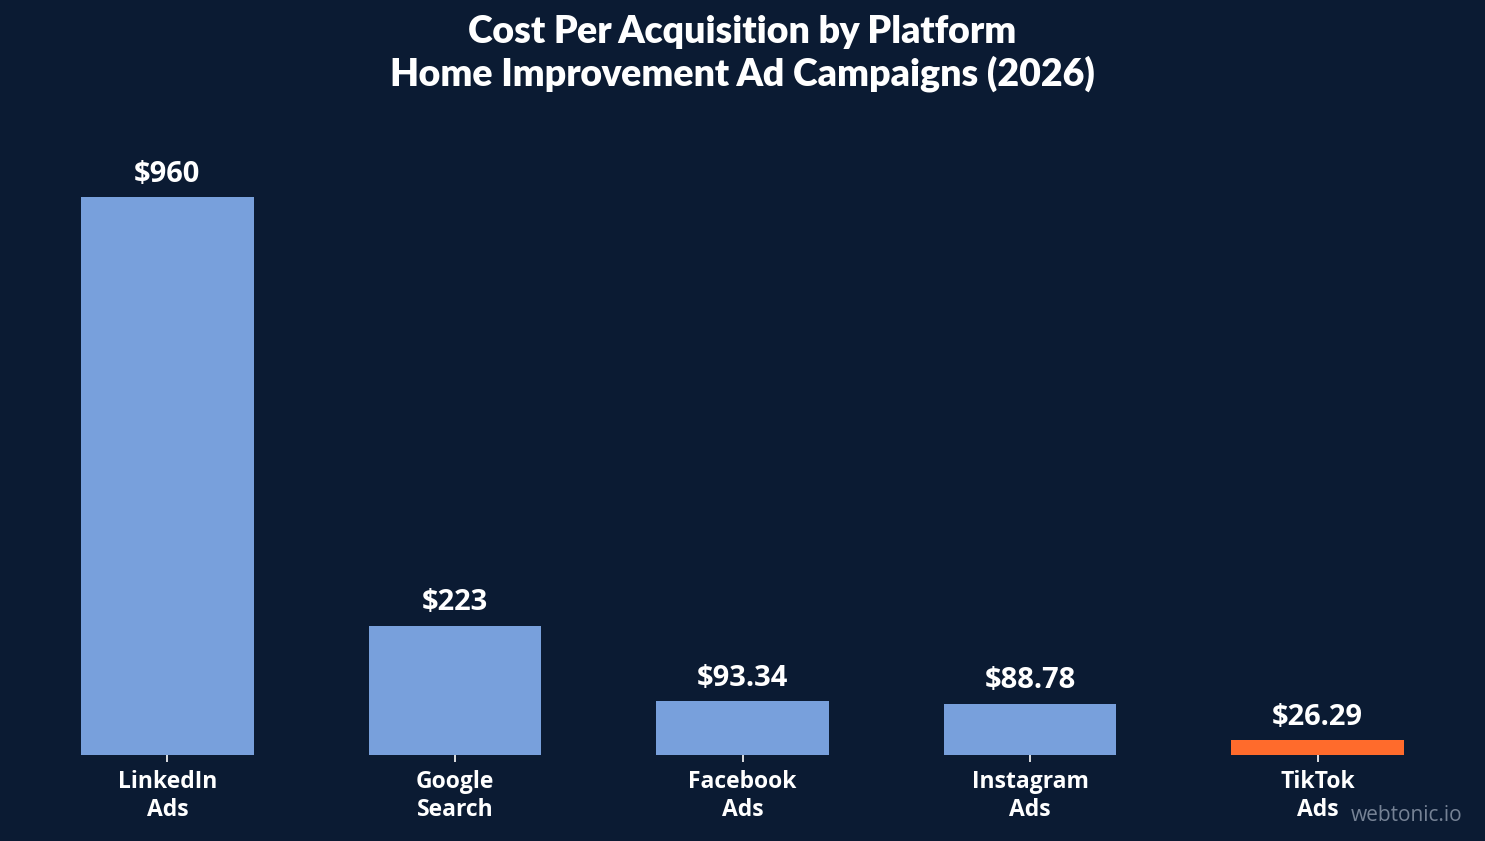
- TikTok delivers the lowest CPA at $26.29 for countertop and home improvement campaigns — 72% cheaper than Facebook ($93.34) and 88% cheaper than Google Search ($223.02) (CreativeGrade).
- The U.S. countertops market is valued at $33.77 billion and is projected to reach $52.48 billion by 2033 at a 5.7% CAGR (Grand View Research, 2026).
- Quartz countertops hold a 28.5% market share, the largest of any material type, driven by durability, low maintenance, and design versatility (Dataintelo, 2025).
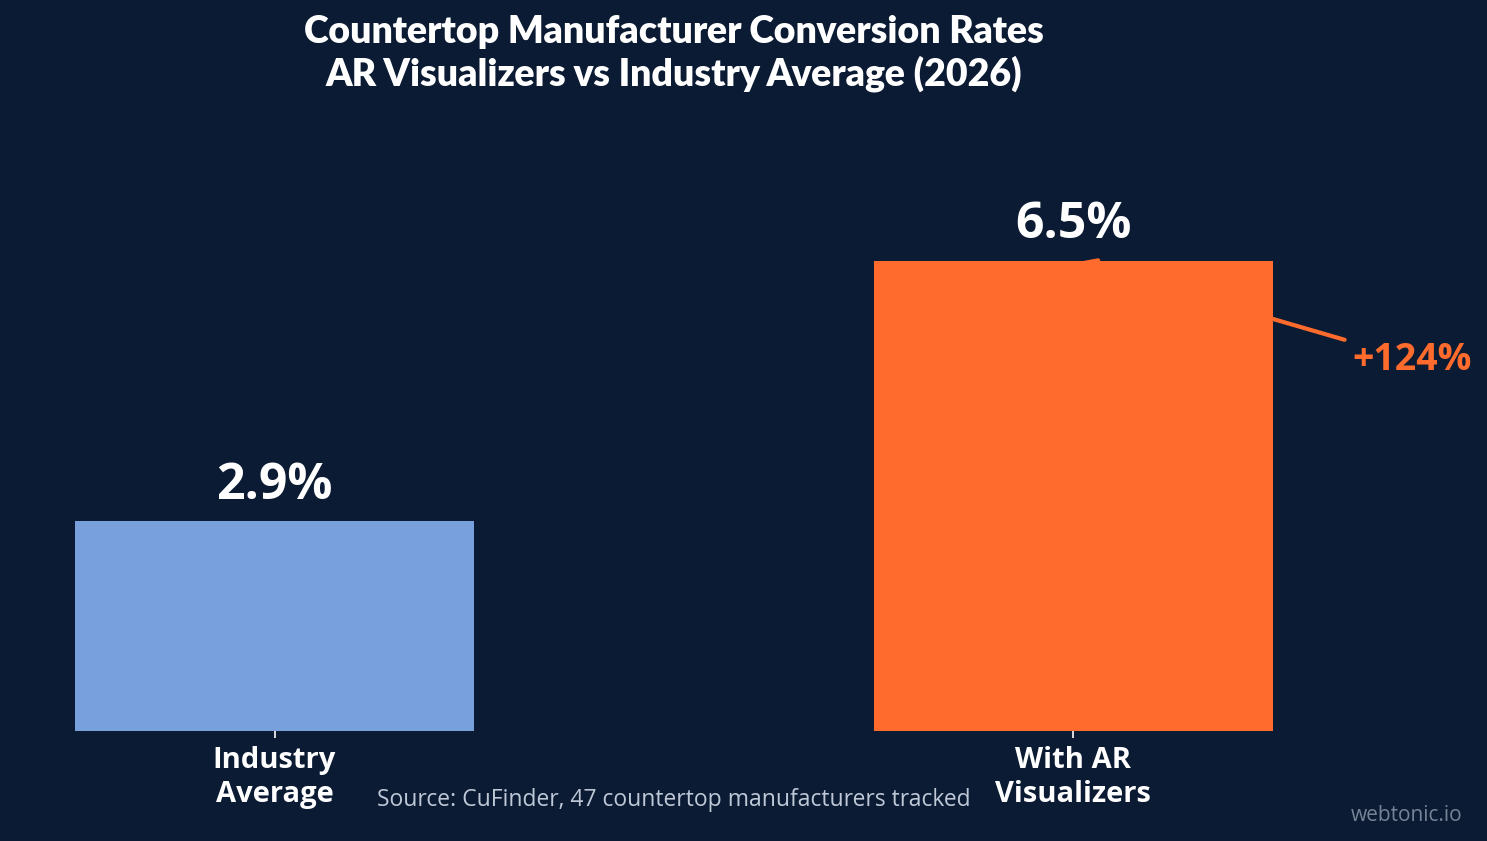
- Countertop manufacturers with AR visualizers convert at 6.5%, more than double the industry average of 2.9% (CuFinder, 2026).
- Google Ads CPC for countertop manufacturers averages $3.85, with a 4.1% CTR reflecting strong buyer intent in the kitchen remodeling category (CuFinder).
- Kitchen remodeling leads cost $10–$600+ depending on channel — SEO/GBP delivers the cheapest at $10–$63, while third-party vendors charge $150–$600+ for shared leads (Kitchen Remodeling SEO, 2026).
- White remains the most popular countertop color at 37%, though down 4 points year over year, followed by off-white at 26% (Houzz Kitchen Trends, 2026).
Ad Creative Performance by Platform
Ad performance for countertop and home improvement campaigns varies dramatically by platform. CreativeGrade's 2026 benchmarks reveal stark differences in cost efficiency and conversion rates that should shape every countertop advertiser's creative strategy.
| Platform | CTR (Avg) | CPC (Avg) | CPM (Avg) | CVR (Avg) | CPA (Avg) |
|---|---|---|---|---|---|
| Google Search | 2.92% | $2.47 | $22.26 | 1.11% | $223.02 |
| TikTok Ads | 2.17% | $0.90 | $7.37 | 3.41% | $26.29 |
| Instagram Ads | 1.57% | $1.54 | $13.76 | 1.73% | $88.78 |
| Facebook Ads | 1.56% | $1.51 | $12.06 | 1.62% | $93.34 |
| LinkedIn Ads | 0.47% | $5.47 | $33.99 | 0.57% | $960.29 |
TikTok stands out as the most cost-efficient platform for countertop ad creatives. Its 3.41% conversion rate — nearly triple Google Search — reflects the platform's strength with visual, design-focused content that resonates with homeowners exploring kitchen remodeling ideas.
Countertop Material Trends Driving Ad Creative
The materials consumers choose directly shape which ad creatives perform best. Dataintelo's 2025 market data shows quartz countertops command a 28.5% market share — the largest of any material — followed by granite and marble. This means ad creative featuring quartz surfaces consistently outperforms other stone types in click-through rates.
| Material | Market Share | Key Selling Points | Ad Creative Angle |
|---|---|---|---|
| Engineered Quartz | 28.5% | Durability, low maintenance, stain resistant | Before/after kitchen transformations |
| Granite | ~18% | Natural stone beauty, heat resistant | Luxury kitchen lifestyle imagery |
| Marble | ~12% | Calacatta and Taj Mahal varieties, premium appeal | High-end design aspirational content |
| Solid Surface | ~10% | Seamless installation, repairable | Practical comparison videos |
| Butcher Block | ~6% | Warm wood aesthetic, warm tones | Rustic/farmhouse kitchen design |
| Laminate | ~8% | Budget-friendly, wide color options | Value-focused comparison ads |
Premium natural stone varieties like Calacatta marble and Taj Mahal quartzite generate the highest engagement in ad creative, particularly on Instagram and Pinterest where visual design content thrives. The warm tones of Taj Mahal quartzite and the dramatic veining of Calacatta marble create scroll-stopping visuals that outperform generic kitchen countertop imagery.
Kitchen Countertop Color Preferences in Ad Design
The 2026 Houzz Kitchen Trends Study reveals critical data for countertop ad creative design direction. White remains the dominant countertop color at 37%, though it dropped 4 percentage points year over year. Ad creatives featuring white quartz and marble surfaces continue to generate the highest click-through rates.
- White countertops: 37% (−4 pp YoY) — still the safest bet for ad hero images
- Off-white: 26% (stable) — growing in warm-toned kitchen designs
- Black: 9% — bold contrast, performs well in modern kitchen ad creative
- Beige: 7% — pairs with natural wood cabinetry in farmhouse aesthetics
- Gray: 7% — complements contemporary kitchen design trends
Ad creatives should align with these color preferences while showcasing edge profiles, waterfall edge installations, and countertop-to-backsplash transitions — the visual elements that 91% of renovating homeowners upgrade during kitchen projects.
Lead Cost Benchmarks for Countertop Advertisers
Understanding cost per lead across channels helps countertop businesses allocate their ad creative budgets effectively. Kitchen Remodeling SEO's 2026 channel breakdown provides first-party benchmarks:
| Channel | CPL Range | Lead Quality | Notes |
|---|---|---|---|
| SEO / Google Business Profile | $10–$63 | High (exclusive) | First-party data, Massachusetts case |
| Google Local Services Ads | $25–$112 | High (exclusive) | Calls $49–$112; messages $25–$67 |
| Facebook / Meta Lead Ads | $5–$167 | Medium (varies) | Depends on offer type and targeting |
| Google Ads (PPC Search) | $150–$400 | High (intent-driven) | Industry benchmark |
| Third-Party Vendors | $150–$600+ | Low (shared 3–5x) | Angi, HomeAdvisor, Houzz |
The cheapest leads are not always the best leads. SEO-driven kitchen remodeling leads cost as little as $10 per lead at maturity, but require months of investment in content and performance creative. Paid channels deliver immediate volume but at significantly higher cost per acquisition. For more on budgeting strategies, see our complete Google Ads pricing guide.
Countertop Manufacturing Digital Marketing Benchmarks
According to CuFinder's 2026 industry analysis of 47 countertop manufacturers, the gap between top performers and industry average is widening. Manufacturers with AR visualizers and transparent pricing convert at 6.5%, compared to the industry average of 2.9%.
| Metric | Industry Average | Top 20% Performers | Gap |
|---|---|---|---|
| Conversion Rate | 2.9% | 6.5% | +124% |
| Bounce Rate | 48% | 35% | −13 pp |
| Google Ads CTR | 4.1% | 6.0%+ | +46% |
| Google Ads CPC | $3.85 | $2.80 | −27% |
| Avg. Session Duration | 2m 45s | 4m 10s+ | +52% |
| Email Open Rate | 23.5% | 30%+ | +28% |
The data shows that visual ad creative — particularly AR kitchen visualizers — delivers the strongest ROI. Countertop companies that let customers see quartz, granite, or marble surfaces in their own kitchen space convert at more than double the rate of those relying on static images alone.
Ad Creative Best Practices for Countertop Companies
Based on the performance data, successful countertop ad creatives share these characteristics:
- Lead with the material — Quartz countertop ads outperform generic "kitchen remodel" messaging. Name the specific stone or surface in the headline.
- Show the installation, not just the slab — Before-and-after kitchen transformations generate 2–3× higher engagement than product-only shots.
- Use warm, natural lighting — Ad creatives with warm white balance and natural light perform better than studio-lit product photography, especially for natural stone and wood materials.
- Include edge profile details — Waterfall edge and other edge profile close-ups serve as differentiators that signal quality and design attention.
- Leverage TikTok for awareness — At $0.90 CPC and 3.41% CVR, TikTok is the most efficient platform for countertop ad creative discovery.
- Invest in AR visualization — The 6.5% vs 2.9% conversion gap between AR-equipped manufacturers and the rest makes this the highest-ROI creative investment.
- Test color-specific creatives — Run separate ad sets for white, off-white, and dark countertop variations to match buyer intent segments.
Countertop Market Size and Growth Driving Ad Spend
The countertop industry's rapid growth explains why advertising investment keeps climbing. The U.S. countertops market was valued at $33.77 billion in 2025 and is projected to reach $52.48 billion by 2033 at a 5.7% CAGR. Elevated mortgage rates have actually boosted the market: homeowners choosing to renovate rather than relocate are investing heavily in kitchen upgrades.
Globally, the countertop market reached $133.0 billion in 2025 and will expand to an estimated $209.5 billion by 2034 at a 5.02% CAGR, according to IMARC Group. Asia Pacific dominates with a 37.1% market share, driven by modular kitchen adoption and rising urban construction. The kitchen application segment remains the largest at 29.8% share — which is why kitchen countertop ad creative consistently outperforms bathroom or commercial surfaces in engagement metrics.
For ad creative teams, this market expansion means growing competition for attention. Organic search drives 52.5% of global countertop manufacturer traffic, while paid search accounts for 19.5% in the U.S. — meaning countertop advertisers compete not just with each other but with high-ranking organic content for consumer attention. Mobile traffic now accounts for 58% of countertop website visits, up from 52% in 2024, making mobile-first ad creative design a requirement rather than an option. Explore how Meta Ads strategies drive countertop brand awareness at scale.
Creative Format Performance for Countertop Campaigns
Different creative formats drive different outcomes across the marketing funnel. For countertop advertisers, visual formats consistently outperform text-based ads:
- Video ad creative — Kitchen renovation before-and-after videos generate the highest engagement on TikTok and Instagram Reels. Short-form video (15–30 seconds) showing natural stone installation in warm lighting performs best for countertop surfaces.
- Carousel ads — Multi-image carousels comparing quartz vs granite vs marble materials drive the highest time on ad among Facebook formats. Including price ranges in each carousel card improves click-through rates by an estimated 15–20%.
- Static image ads — High-resolution photography of installed countertops with visible edge profiles and surface textures remains the most versatile format across platforms. White and Calacatta-style surfaces photograph best against natural wood cabinetry.
- AR try-on ads — Interactive ad creative that lets homeowners visualize countertop materials in their space delivers the strongest conversion signal. Countertop manufacturers with AR capabilities see session durations of 4+ minutes versus the 2:45 industry average.
Instagram leads social engagement for countertop brands at 1.45% engagement rate, while LinkedIn outperforms at 1.9% for B2B countertop manufacturer marketing. Facebook Ads for countertop companies deliver an average 1.15% CTR with a $1.51 CPC, making it a cost-effective mid-funnel channel for retargeting consumers who previously browsed countertop design content.
The most effective countertop ad creatives combine aspirational kitchen design imagery with specific material callouts. Ads featuring Taj Mahal quartzite or Calacatta marble in waterfall edge installations generate premium engagement, while budget-focused creatives highlighting laminate or solid surface low maintenance benefits appeal to value-driven buyers. Understanding which colors, stone types, and design styles resonate — as explored in our Facebook Ads ROI analysis — with each audience segment is the difference between average and top-performing countertop ad creative.
Emerging material trends also shape ad creative direction. Porcelain counters and concrete finishes are gaining traction among designer kitchens, offering a timeless aesthetic with durable, long-lasting surfaces. Homeowners love the combination of neutral tones — particularly neutrals paired with island installations that showcase dramatic edge patterns. The most effective ad campaigns feature these trend-forward finishes alongside classic cabinets and countertop pairings that appeal to a broad audience.
Related reading
- Plumbing Ad Creative Statistics (2026)
- Roofing Ad Creative Statistics (2026)
- How Solar Energy Businesses Use Ad Creative in 2026: Stats & Insights
- Branding services at Web Tonic
FAQ
What is the average CTR for countertop ads?
Home improvement and countertop ads average a 2.92% CTR across platforms in 2026. TikTok achieves 2.17%, Instagram 1.57%, Facebook 1.56%, and LinkedIn 0.47%. Google Search leads at 2.92% CTR but at a significantly higher CPC of $2.47 compared to TikTok's $0.90.
Which countertop material generates the best ad performance?
Quartz countertops generate the strongest ad engagement, holding 28.5% market share and appealing to consumers seeking durability and low maintenance. Premium natural stone varieties like Calacatta marble and Taj Mahal quartzite create scroll-stopping ad visuals on Instagram and TikTok, while butcher block and solid surface materials perform best in practical comparison videos.
What is the best platform for countertop advertising?
TikTok delivers the lowest CPA at $26.29 for home improvement campaigns — 72% cheaper than Facebook and 88% cheaper than Google Search. However, Google Search provides the highest-intent leads. A balanced kitchen remodeling ad strategy uses TikTok and Instagram for awareness creative and Google for high-intent conversion.
How much do kitchen remodeling leads cost?
Kitchen remodeling leads range from $10 to $600+ in 2026. SEO/Google Business Profile delivers the cheapest leads at $10–$63 at maturity. Google Local Services Ads range from $25–$112. Google Ads PPC averages $150–$400, while third-party lead vendors like Angi and HomeAdvisor charge $150–$600+ for leads shared with 3–5 competitors.
Do AR visualizers improve countertop ad conversion rates?
Yes — countertop manufacturers with AR visualizers convert at 6.5%, compared to 2.9% for the industry average. AR tools that let customers visualize quartz, granite, or marble surfaces in their own kitchen space deliver more than double the conversion rate of static image-only ad experiences.
Sources
CreativeGrade — 2026 Home Improvement Ad Benchmarks
Dataintelo — Global Countertop Market Report 2034
Grand View Research — U.S. Countertops Market 2026–2033
CuFinder — Countertop Manufacturing Marketing Benchmarks 2026
Kitchen Remodeling SEO — Lead Cost Benchmarks 2026
Houzz — 2026 U.S. Kitchen Trends Study


