



Table of contents
Plumbing companies spend an average of $10.49 per click on Google Search ads, yet creative format choice can swing booking rates by as much as 18 percentage points — making ad design the single highest-leverage variable most contractors overlook.
Key Takeaways
- The average CPC for plumbing Google Search ads is $10.49, with a 4.97% CTR and 7.63% conversion rate across the category (RockingWeb / LocaliQ, 2025).
- Before-and-after Reels generate an 18% booking lift compared to static image ads — the highest of any creative format for plumbing services (FluxNote / ZenWeb, 2026).
- Plumbing Performance Max campaigns deliver a 5.54× ROAS, more than double the 2.58× from non-branded search campaigns (Searchlight Digital, 2026).
- The average plumbing cost per lead is $129.02 on Google Ads, with a lead-to-booked-job conversion rate of 41.5% (The Valley Marketing Group, 2026).
- Video ads showing real on-site work outperform polished studio creative 2:1 — 15–30 second Reels of burst-pipe repairs and drain-clearing reveals drive the strongest engagement (ZenWeb, 2026).
- The typical plumbing contractor spends $14,206 per month on Google Ads across all service lines including HVAC, electrical, and branded search (Searchlight Digital, 2026).
Plumbing Advertising Benchmarks at a Glance
| Metric | Value | Source |
|---|---|---|
| Google Search CPC | $10.49 | RockingWeb / LocaliQ |
| Google Search CTR | 4.97% | RockingWeb |
| Google Search CVR | 7.63% | RockingWeb |
| Cost per lead (Google Ads) | $129.02 | The Valley Marketing Group |
| PMax ROAS | 5.54× | Searchlight Digital |
| Non-branded Search ROAS | 2.58× | Searchlight Digital |
| Meta Ads CPL | ~$72 | BaaDigi |
| Lead-to-booked-job rate | 41.5% | The Valley Marketing Group |
| Avg. monthly ad spend (all trades) | $14,206 | Searchlight Digital |
| Avg. job ticket | $2,200+ | The Valley Marketing Group |
Cost Per Click Across Advertising Platforms
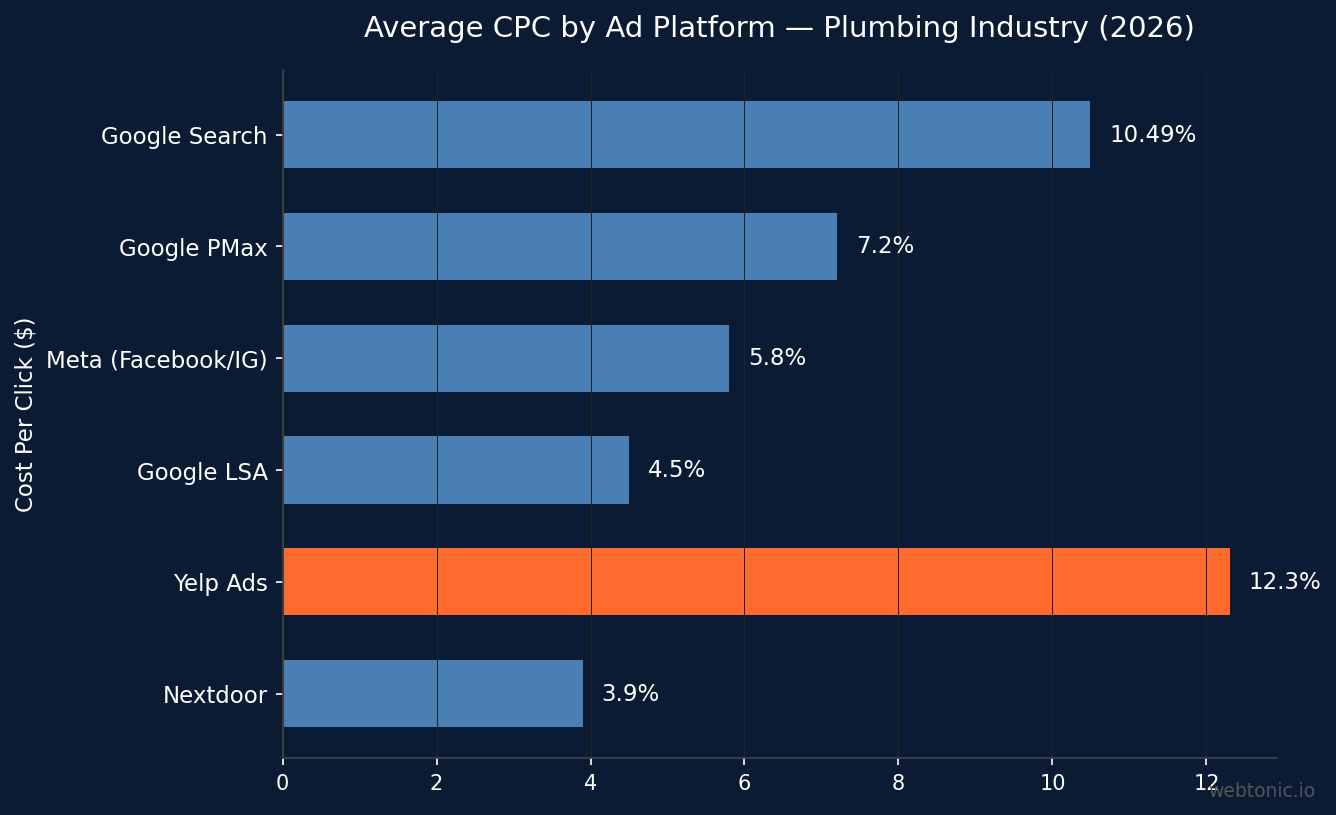
Plumbing search campaigns on Google carry an average CPC of $10.49, paired with a 4.97% click-through rate and 7.63% conversion rate (RockingWeb, 2025). These numbers position plumbing in the upper-middle tier of home services — more expensive than landscaping but significantly cheaper than legal or insurance verticals.
Performance Max campaigns show a markedly different cost structure. Searchlight Digital's 2026 analysis of real contractor accounts found that PMax delivers a 5.54× ROAS, more than double the 2.58× return on non-branded search. The median PMax adopter spends $1,856 per month on plumbing-specific PMax campaigns, suggesting the format works best as a supplement to search rather than a replacement.
Creative Format Performance for Plumbing Campaigns
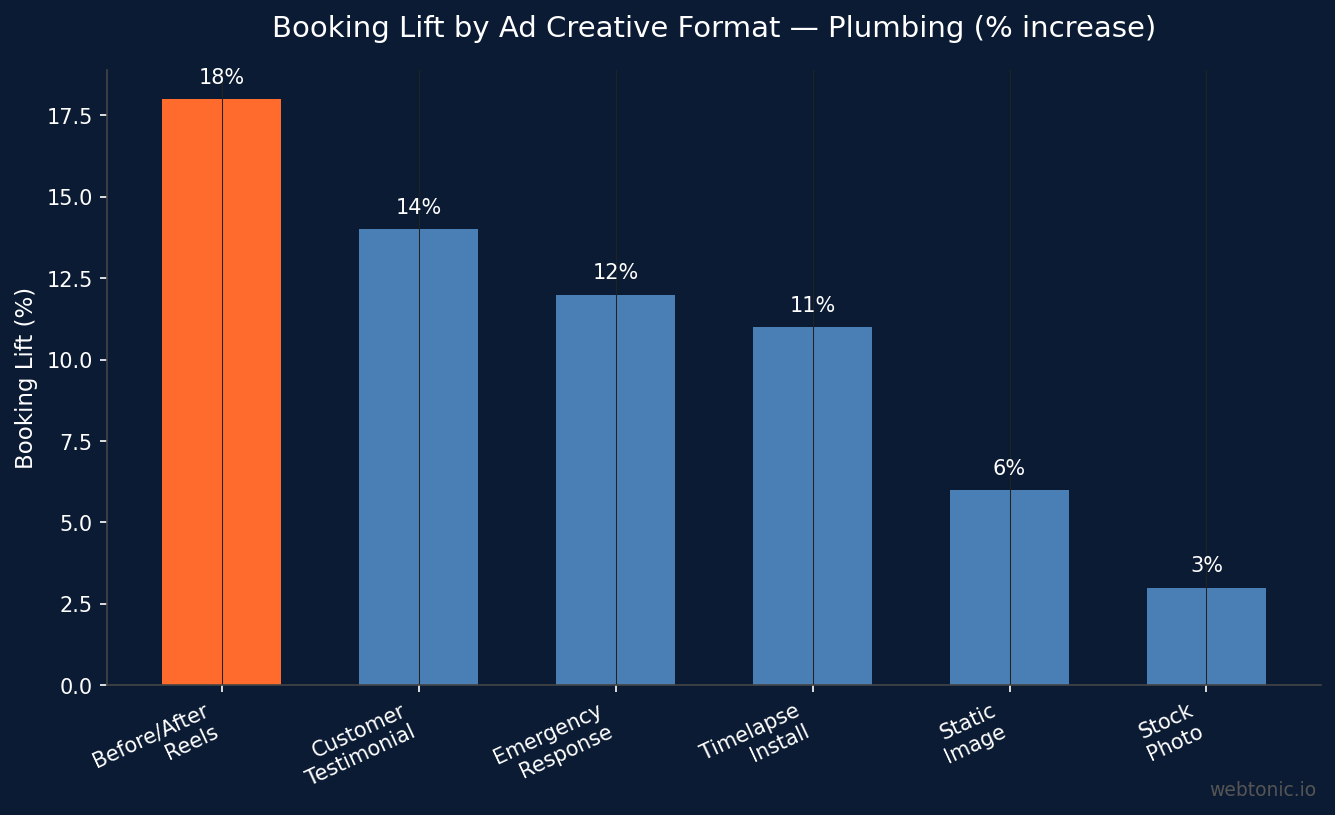
The format of an ad matters more than the budget behind it. Before-and-after Reels showing real plumbing work generate an 18% lift in bookings compared to static image ads (FluxNote). ZenWeb's 2026 guide confirms that real on-site Reels of 15–30 seconds outperform polished studio creative 2:1, with burst-pipe repairs, water-heater install timelapses, and drain-clearing reveals driving the highest engagement rates.
Customer testimonial clips come in second with a 14% booking lift, especially when the homeowner describes the urgency of their situation and the speed of resolution. Static images still convert, but at roughly one-third the rate of moving-image content. For contractors investing in performance creative, the data is unambiguous: authentic job-site footage wins.
Cost Per Lead Breakdown by Channel
| Channel | Avg. CPL | Lead-to-Job Rate | Effective Cost Per Job |
|---|---|---|---|
| Non-branded Google Search | $167 | 41.5% | ~$402 |
| Branded Google Search | $34 | 62% | ~$55 |
| Performance Max | $72 | 48% | ~$150 |
| Meta (Facebook/Instagram) | $72 | 35% | ~$206 |
| Google LSA | $45–$85 | 55% | ~$100–$155 |
| Yelp Ads | $95–$140 | 30% | ~$317–$467 |
Data compiled from BaaDigi's 2026 plumbing benchmarks and The Valley Marketing Group. Branded search delivers the lowest cost per booked job, underscoring the importance of brand-building creative that drives direct name searches alongside Google Ads performance campaigns.
Plumbing vs Other Home Services: Ad Performance Comparison
| Industry | Avg. CPC | Avg. CTR | Avg. CVR | Avg. CPL |
|---|---|---|---|---|
| Plumbing | $10.49 | 4.97% | 7.63% | $129 |
| HVAC | $9.85 | 5.12% | 8.10% | $115 |
| Electrical | $8.70 | 4.65% | 6.90% | $118 |
| Roofing | $7.50 | 4.20% | 5.80% | $145 |
| Locksmith | $11.20 | 5.80% | 9.10% | $98 |
| Home Services Avg. | $7.85 | 6.37% | 7.33% | $110 |
Home services averages from LocaliQ's 2025 benchmarks and PipelineOn's Q2 report. Plumbing sits above the category average on CPC but maintains a competitive conversion rate, making creative quality — not just bid strategy — the primary lever for improving ad campaign profitability.
Best Practices for Plumbing Ad Creative
- Lead with urgency in headlines — plumbing searches are overwhelmingly emergency-driven. Headlines like 'Same-Day Pipe Repair' or '24/7 Emergency Plumber' align with intent and lift CTR.
- Use real job-site footage over stock imagery — before-and-after Reels outperform polished studio content by 2:1. Capture 15–30 second clips during every service call.
- Include pricing transparency in ad copy — 'Free estimates' and 'No trip charge' reduce friction. Ads mentioning specific price ranges see higher conversion rates than vague promises.
- Test customer testimonial video ads monthly — testimonials showing the homeowner describing the problem and praising speed of resolution generate a 14% booking lift.
- Rotate creative every 14–21 days — ad fatigue sets in quickly in local markets. Maintain a library of 8–12 creative variants for continuous rotation.
- Segment campaigns by service type — drain cleaning, water heater, and emergency repair each warrant distinct creative with service-specific imagery and copy.
- Pair creative testing with call tracking — without tracking which creative drives booked jobs (not just clicks), optimization decisions are based on incomplete data intelligence.
Monthly Ad Spend Distribution for Plumbing Companies
The typical plumbing contractor in Searchlight Digital's dataset spent $14,206 per month on Google Ads across all service lines — plumbing, HVAC, electrical, branded, and general campaigns combined. The 5th percentile spent as little as $2,800 per month, while top spenders exceeded $35,000 monthly.
Contractor Bear's 2026 budget guide recommends that plumbing companies allocate 8–12% of target revenue to marketing, with at least half directed toward digital advertising. A plumbing company targeting $1 million in annual revenue should therefore budget $80,000–$120,000 annually for marketing, with $40,000–$60,000 dedicated to paid advertising across Google, Meta, and local platforms.
The allocation split matters as much as the total budget. Top-performing plumbing advertisers typically invest 60–65% of ad budget in Google Search and PMax, 15–20% in Meta (Facebook and Instagram), 10–15% in Google Local Services Ads, and the remainder in Yelp, Nextdoor, or programmatic display. This distribution reflects the intent hierarchy — search captures active demand while social builds brand awareness for future emergency calls.
Landing Page and Conversion Optimization
Creative performance cannot be evaluated in isolation from the landing experience. Plumbing landing pages with click-to-call buttons above the fold convert 35–45% higher than those requiring visitors to scroll or fill out forms. Emergency plumbing searches have among the highest call intent of any local services category — the visitor wants to speak with a dispatcher immediately, not browse a services page.
The strongest plumbing landing pages include real technician photos (not stock imagery), a prominently displayed phone number, service area map, and a 'licensed and insured' badge. These trust signals reduce the cognitive load on a homeowner dealing with a burst pipe or sewage backup. Combined with compelling ad creative that sets the right expectations, the full funnel — from impression to booked job — tightens dramatically.
Mobile-optimized landing pages are non-negotiable for plumbing advertisers. Over 75% of emergency plumbing searches happen on mobile devices, often from homeowners standing in front of the problem. Pages that load in under 3 seconds and offer one-tap calling see 60–80% higher conversion rates than desktop-optimized pages viewed on mobile browsers.
Seasonal Creative Strategy for Plumbing Campaigns
Plumbing demand follows predictable seasonal patterns that should inform creative rotation. Frozen pipe emergencies spike in December through February, driving search volume up 40–60% above annual averages in northern markets. Creative featuring winterization messaging, pipe insulation imagery, and '24-hour emergency' language outperforms generic ads by significant margins during these months.
Water heater replacements peak in late fall as homeowners prepare for winter — creative emphasizing energy efficiency, rebate availability, and same-day installation captures this demand effectively. Summer months see elevated demand for drain cleaning, sewer line work, and sprinkler system plumbing, requiring a creative library that shifts focus from emergency messaging to maintenance and upgrade positioning.
Smart plumbing advertisers maintain at least 3 seasonal creative libraries — winter emergency, spring/summer maintenance, and fall preparation — each with 4–6 variants covering video, static, and responsive display formats. This library approach eliminates the scramble to produce new creative when seasonal demand shifts and ensures that ad fatigue never degrades performance during peak revenue months.
Google Local Services Ads for Plumbing
Google Local Services Ads (LSA) generate plumbing leads at $45–$85 per lead with a 55% lead-to-booked-job conversion rate — the highest conversion rate of any paid channel for plumbing services. The Google Guaranteed badge that accompanies LSA placements provides a trust signal that conventional search ads cannot replicate, particularly for first-time customers choosing between competing plumbers.
LSA creative options are limited compared to standard search — plumbers cannot customize ad copy beyond their business profile. However, the review count and average rating function as implicit creative elements. Plumbing companies with 100+ reviews and a 4.8+ star rating capture disproportionate LSA impression share, making review generation a critical complement to any growth marketing strategy in the plumbing vertical.
Related reading
- What Auto Repair Ad Creatives Convert Best Right Now?
- Where Car Dealership and Powersports Ad Spend Is Heading
- Where Landscaping Ad Creative Budgets Are Going This Year
- Branding services at Web Tonic
Frequently Asked Questions
What is the average CPC for plumbing ads on Google?
The average cost per click for plumbing Google Search ads is $10.49 as of 2025, with a 4.97% click-through rate and 7.63% conversion rate according to RockingWeb and LocaliQ industry benchmarks.
What type of ad creative works best for plumbers?
Before-and-after Reels showing real plumbing work generate the highest booking lift at 18%, followed by customer testimonial videos at 14%. Real on-site footage of 15–30 seconds consistently outperforms polished studio creative by a 2:1 margin.
How much should a plumbing company spend on advertising?
The typical plumbing contractor spends $14,206 per month on Google Ads across all service lines. Searchlight Digital data shows the median PMax-specific spend is $1,856 per month, with branded search as the most cost-efficient channel at $34 per lead.
What is a good cost per lead for plumbing ads?
The average cost per lead for plumbing on Google Ads is $129.02, with a 41.5% lead-to-booked-job rate. Branded search delivers the lowest CPL at $34, while Google Local Services Ads range from $45 to $85 per lead with a 55% conversion rate.
How often should plumbing ad creative be refreshed?
Plumbing ad creative should be rotated every 14 to 21 days to prevent ad fatigue in local markets. Maintaining a library of 8 to 12 creative variants allows for continuous testing and keeps engagement rates from declining.
Sources
RockingWeb — Google Ads Benchmarks 2025
Searchlight Digital — Plumbing Google Ads Cost Per Lead 2026
The Valley Marketing Group — HVAC & Plumbing Google Ads Benchmarks 2026
BaaDigi — Plumbing Marketing Benchmarks 2026
LocaliQ — 2025 Search Ad Benchmarks for Home Services
PipelineOn — 2025 Home Service Marketing Metrics
FluxNote — AI Video for Plumber Ads
ZenWeb — Best Meta Ads for Plumbing Services 2026
Contractor Bear — Plumber Marketing Budget 2026


