



Table of contents
Solar energy ad creative determines whether your $200+ cost per lead turns into a profitable installation or wasted spend. In 2026, solar customer acquisition costs reached $0.84 per watt — a 40% jump from 2025 — making every ad creative decision a margin question. This article compiles the latest benchmarks on solar ad creative performance across Google, Meta, and video platforms to help installers and marketers make data-driven creative decisions.
Key Takeaways
- Solar Google Ads CPC ranges from $8 to $22 with a blended CPL of ~$206 across channels (BaaDigi, 2026)
- Facebook Ads deliver CPL 60% below Google Ads for solar companies, making Meta the most cost-efficient paid channel (SurgePV, 2026)
- Video ads generate 2–3× more leads than static image ads for solar installers (Daly Advertising, 2026)
- Financial messaging outperforms green messaging by 20–40% on Facebook for solar campaigns (SurgePV, 2026)
- Ad fatigue hits solar campaigns within 14–21 days, causing CTR drops of 40–60% (SurgePV, 2026)
- Millennials show 3.2× higher response to sustainability-focused ads than cost-only messaging (Gitnux, 2026)
- Solar ad campaigns with A/B testing exceeded benchmarks 92% of the time (Gitnux, 2026)
- Residential solar customer acquisition cost reached $5,880 per customer for a typical 7 kW system in 2026 (Wood Mackenzie / SurgePV)
- UGC-style phone-filmed testimonials outperform polished TV-style ads on Meta for solar companies (Uprise Digital, 2026)
- Average solar job value is ~$30,505 before incentives for a 12 kW residential system (BaaDigi / EnergySage, 2026)
Solar Ad Creative Benchmarks at a Glance
| Metric | Google Ads | Facebook / Meta | Industry Avg |
|---|---|---|---|
| Cost Per Click | $8–$22 | $1.90–$4.20 | $5–$15 |
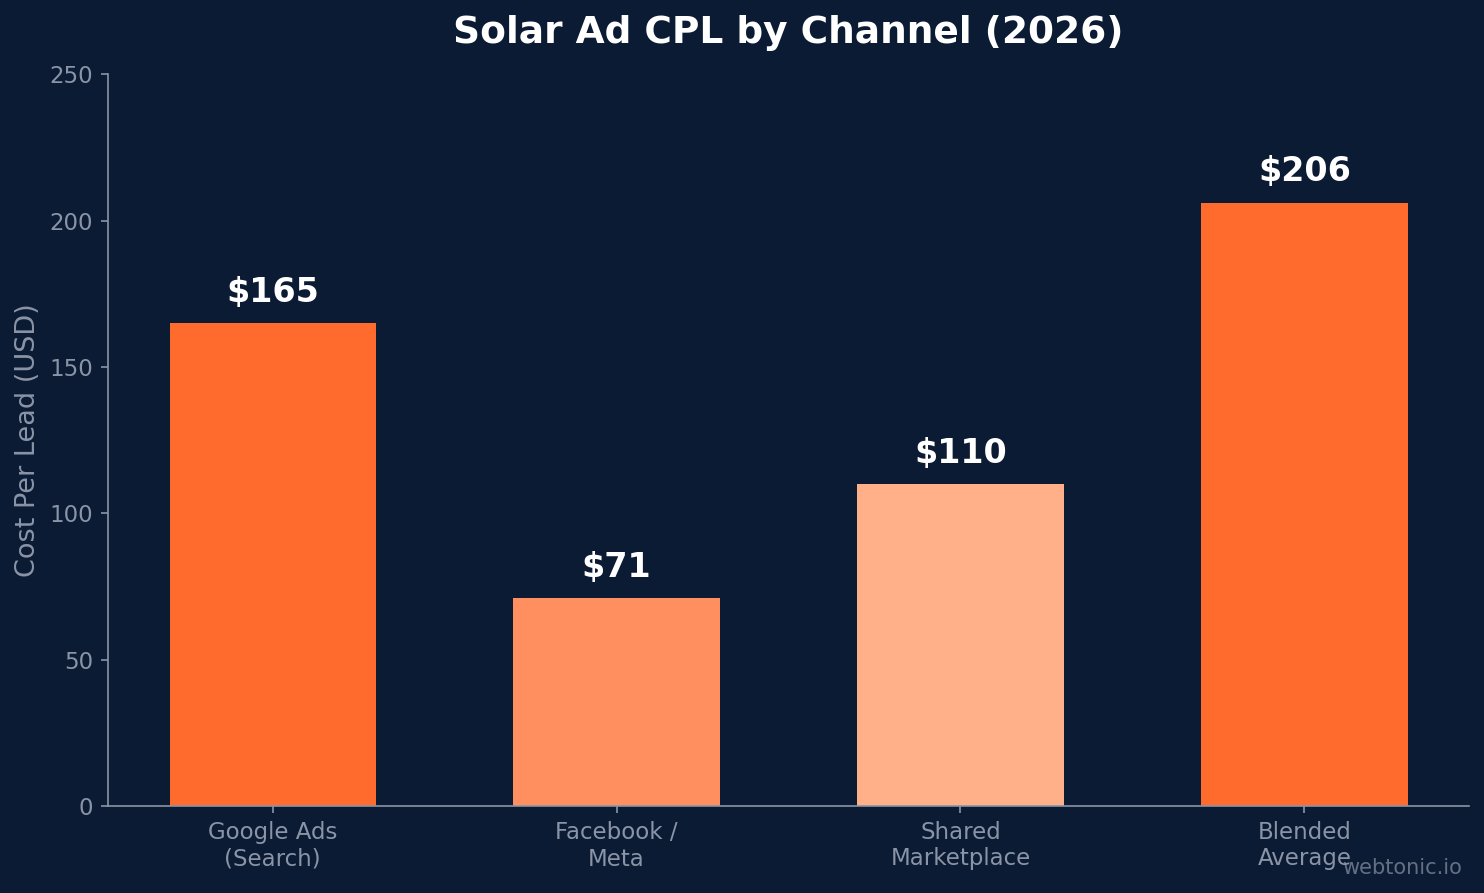
| Cost Per Lead | $80–$250 | $22–$120 | ~$206 blended |
| Click-Through Rate | 3.5% (Search) | 1.2%–2.8% | 2.0%–3.5% |
| Conversion Rate | 3.2% | 4%–8% | 3%–6% |
| Close Rate (Lead → Sale) | 10%–15% | 5%–10% | 8%–12% |
| Average Job Value | ~$30,505 (12 kW residential before incentives) | ||
| Creative Fatigue Window | 14–21 days before CTR drops 40–60% | ||
Google Ads vs. Facebook Ads for Solar Creative
The platform choice for solar advertising creative shapes both cost structure and creative requirements. Google Ads captures high-intent homeowners actively searching "solar panel installers near me" with CPCs averaging $8 to $22 and a conversion rate around 3.2% for qualified leads. The creative demands are primarily copy-driven: responsive search ads with tight messaging around savings, incentives, and local trust signals.
Facebook and Instagram ads offer CPL figures 60% below Google Ads, but they require creative excellence to convert. Solar ads on Meta reach homeowners through targeting before they even know they want solar — implicit intent that demands scroll-stopping visuals. Carousel ads work well for retargeting, with each card showing a different customer story, financing option, or FAQ answer. For prospecting, single-image or short-form video ads with a savings-first hook outperform educational or brand-awareness formats.
Australian solar Meta benchmarks from Uprise Digital show viable CPL between AU$35 and AU$140 for residential and AU$80 to AU$220 for battery retrofits. Creative refresh cadence — at least three new concepts per week — drives more CPL variance than audience targeting in the post-iOS 14 landscape.
Solar PPC advertising requires tight alignment between ad creative and landing page messaging. When a homeowner clicks an ad promising "$0 down solar," the landing page must reinforce that exact offer — not redirect to a generic services page. Dedicated landing pages with a single CTA convert 5× higher than generic homepages for solar campaigns, making creative-to-page consistency a critical factor in overall advertising ROI.
Video Ad Creative vs. Static Images for Solar
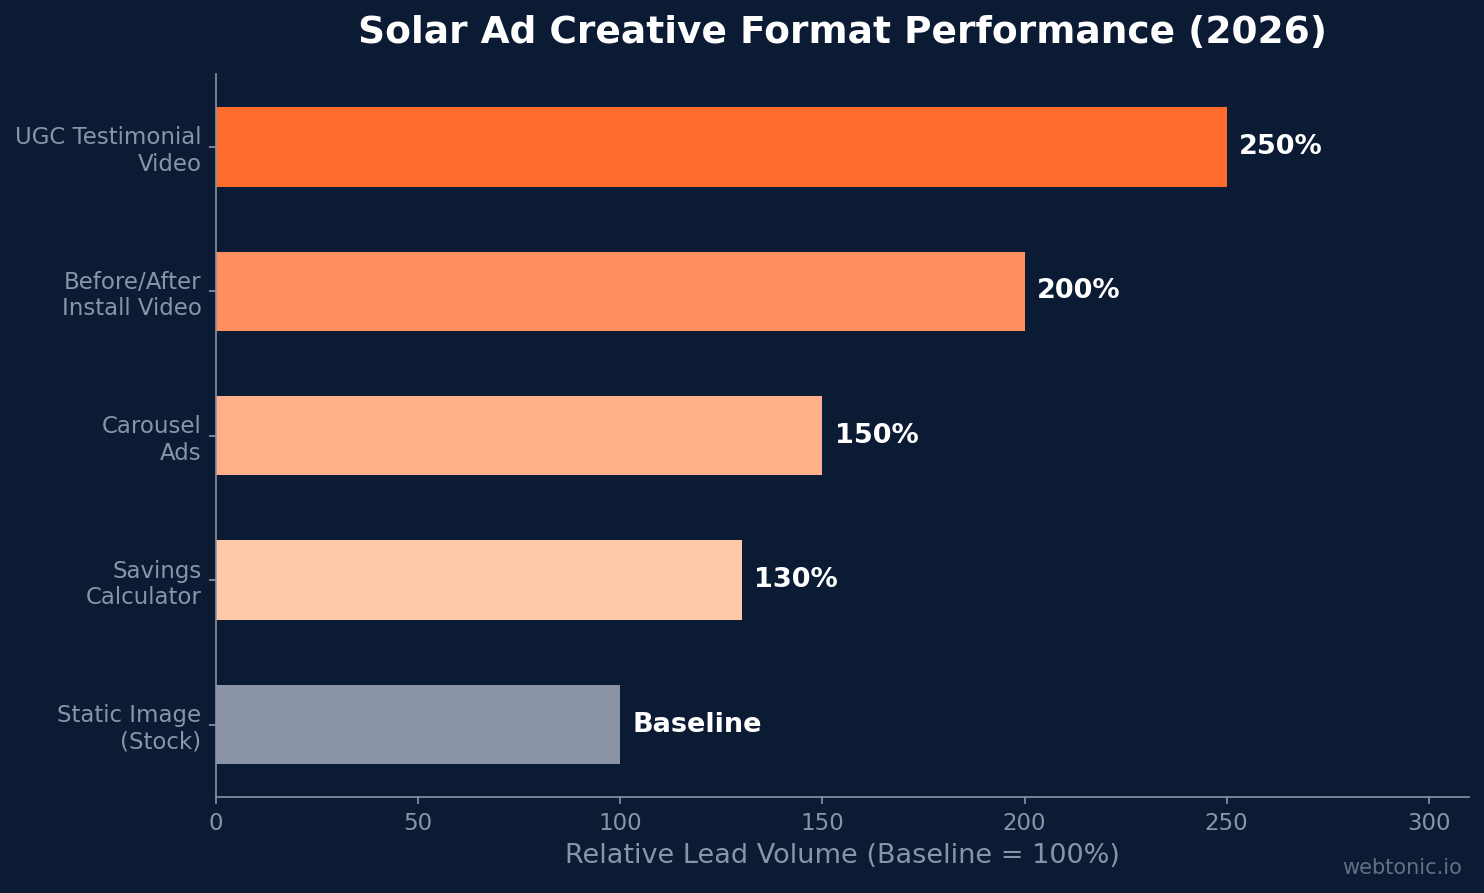
Video creative has emerged as the clear performance leader for solar advertising. A 30-second before-and-after video showing the installation process and a homeowner's first electric bill generates 2× to 3× more leads than static image ads. The data is consistent across multiple agencies and markets.
The winning video formula for solar follows a specific pattern: phone-filmed 30-second customer testimonials from real local customers — ideally in their home or near their panels — outperform polished TV-style production on Meta. This user-generated content (UGC) format mirrors organic Reels content, earning higher engagement and lower CPL. Solar companies that use owner-on-camera creative see 25–40% lower CPL compared to stock imagery or overly branded production.
However, creative fatigue hits solar video campaigns faster than most verticals. The same creative running to the same audience for 30 days sees CTR drop 40% to 60%. Plan a refresh every 14 to 21 days, and maintain a testing velocity of 25 to 35 new creative concepts per month at scale.
| Creative Format | Lead Volume Lift | Avg. CPL Impact | Best Use Case |
|---|---|---|---|
| UGC Testimonial Video | 2–3× vs. static | −25% to −40% | Prospecting, cold audiences |
| Before/After Install Video | 2× vs. static | −20% to −35% | Top-of-funnel awareness |
| Carousel Ads | 1.5× vs. single image | −10% to −20% | Retargeting, multi-story |
| Static Image (Stock) | Baseline | Baseline | Budget-constrained testing |
| Savings Calculator Interactive | 1.3× vs. static | −15% to −25% | Mid-funnel qualification |
Solar Ad Messaging That Converts: A/B Testing Data
Financial messaging outperforms environmental messaging by 20% to 40% on Facebook for solar campaigns. Data from multiple solar marketing agencies shows that savings-first hooks — "$0 down solar," "cut your bill by 60%," or "lock in rates before 2027" — consistently generate more leads than green-focused messaging such as "go green" or "reduce your carbon footprint."
That said, audience segmentation matters. Millennials show 3.2× higher response to sustainability-focused solar ads than cost-only messaging, while homeowners over 50 respond strongest to energy independence and fixed-cost narratives. The most effective creative strategies test all three angles — savings, independence, and environmental impact — then scale the winners by demographic.
Solar ad campaigns using systematic A/B testing exceeded benchmarks 92% of the time, compared to campaigns relying on creative intuition alone. The testing framework that delivers results follows a structured cadence: 3–5 new creative concepts per week, with a winner rate of 3–4% across the solar vertical. Time-to-winner typically runs 10 to 18 days, meaning a single test cycle aligns closely with the fatigue window.
Solar Customer Acquisition Cost Breakdown
Understanding the full economics of solar ad creative requires looking beyond CPL to the complete acquisition funnel. Residential solar customer acquisition cost hit $0.84 per watt in 2026, according to Wood Mackenzie projections — up from $0.60 in 2025. For a typical 7 kW system, that translates to $5,880 just to acquire one customer.
The funnel economics explain why creative quality is a margin question, not just a marketing metric:
| Funnel Stage | Benchmark | Top Performer | Revenue Impact |
|---|---|---|---|
| Cost Per Lead | ~$206 blended | $80–$120 | $126+ savings/lead |
| Lead → Sale Close Rate | 8–12% | 15%+ | 87% more closed deals |
| Avg. Job Value | ~$30,505 | $35,000+ | Higher with battery upsell |
| Net Margin | 10–25% | 20–25% | $3,050–$7,626/job |
| Referral Close Rate | ~30% | 35%+ | 3× paid lead rates |
| Purchased Lead Close Rate | 5–8% | 10% | Lowest margin channel |
Effective solar digital marketing campaigns combine creative testing with precise targeting parameters. Homeowner targeting by roof age, income bracket, and electricity usage patterns dramatically improves lead quality on Meta platforms. The most advanced solar companies layer CRM data — including past customer postcodes and average system sizes — into their advertising targeting to build high-performing lookalike audiences. This data-driven approach to PPC and social advertising reduces wasted spend and improves the quality of every lead entering the sales pipeline.
Solar Ad Creative Best Practices Backed by Data
The highest-performing solar ad creatives share specific structural elements. Based on 2026 platform data and agency benchmarks, these are the creative practices that consistently lower CPL and increase lead quality:
- Lead with savings, not features. "Save $1,200/year on electricity" outperforms "6.5 kW solar panel system" by 20–40% in click-through rates.
- Use real installation photos, not stock imagery. Authentic project photos with recognizable local landmarks build trust and reduce bounce rates.
- Refresh creative every 14–21 days. The fatigue window for solar is shorter than most verticals — plan 3+ new concepts weekly at scale.
- Film UGC-style testimonials under 30 seconds. Phone-filmed customer testimonials that look like organic Reels content outperform polished production by 25–40% on CPL.
- Test three angles simultaneously: savings, energy independence, and environmental impact. Scale winners by audience demographic.
- Gate your leads by qualification. Include postcode, property type, or electricity spend in your form to pre-qualify leads and improve close rates.
- Follow up within 5 minutes. Speed-to-lead is critical — solar installers responding within 5 minutes convert at 3–5× the rate of those responding within an hour.
Creative Refresh Cadence and Fatigue Patterns
Solar ad creative has a shorter effective lifespan than most home service verticals. The combination of a narrow targeting audience (homeowners in specific service areas) and high ad frequency means the same audience sees the same creative repeatedly. Across multiple agency accounts, the pattern is consistent:
- Days 1–7: Peak performance. New creative outperforms the account baseline.
- Days 8–14: Stable performance with gradual CTR decline.
- Days 15–21: Noticeable fatigue. CTR drops 20–30% from peak.
- Days 22–30: Severe fatigue. CTR drops 40–60%, CPL spikes, and the algorithm deprioritizes delivery.
The strategic implication is clear: solar advertisers need a creative pipeline, not a creative campaign. Top-performing solar companies maintain a creative testing velocity of 25–35 new concepts per month, with a winner rate of 3–4%. That means for every 30 concepts tested, only 1–2 become scale-worthy winners — making systematic testing non-negotiable.
Solar Ad Creative Performance vs. Other Home Services
| Industry | Avg. CPC (Google) | Avg. CPL | Close Rate | Avg. Job Value |
|---|---|---|---|---|
| Solar Energy | $8–$22 | ~$206 | 8–12% | $30,505 |
| HVAC | $5–$15 | ~$80 | 15–25% | $8,500 |
| Roofing | $10–$25 | ~$170 | 10–15% | $12,000 |
| Plumbing | $4–$12 | ~$55 | 20–35% | $2,500 |
| Electrical | $5–$14 | ~$65 | 18–30% | $3,200 |
Solar has the highest CPL of any major home service vertical, but the average job value ($30,505) is also the highest by a wide margin. This means creative optimization has outsized revenue impact: a 20% improvement in CPL on a $206 baseline saves $41 per lead — at 100 leads per month, that is $4,100 in monthly savings directly attributable to better creative.
The CTA structure within solar ad creative also impacts conversion rates significantly. Ads with a specific, benefit-driven call-to-action — such as "Get My Free Solar Savings Estimate" — outperform generic CTAs like "Learn More" or "Contact Us" by 15–25% in click-through rate. Pairing a compelling CTA with conversion tracking that connects ad clicks to closed installations enables solar marketing teams to optimize for revenue rather than vanity metrics like impressions or raw clicks.
Related reading
- Painting Ad Creative Statistics
- PI Law Ad Creative Stats 2026 | Web Tonic™
- Pest Control Ad Creative Statistics: Formats, CTR & Testing Benchmarks (2026)
- Branding services at Web Tonic
FAQ
What is the average cost per lead for solar ads in 2026?
The blended average cost per lead across all channels is approximately $206, with Google Ads running $80–$250 and Facebook/Meta delivering $22–$120 CPL. Shared marketplace leads cost around $110, while referral leads have no direct ad cost but convert at ~30% compared to 8–12% for paid leads.
Which ad creative format works best for solar companies?
Video ads outperform static images by 2–3× in lead volume. Specifically, phone-filmed UGC-style customer testimonials under 30 seconds deliver the best results on Meta platforms. These authentic, organic-looking creatives generate 25–40% lower CPL than polished production or stock photography.
How often should solar companies refresh their ad creative?
Every 14 to 21 days. Solar ad creative experiences fatigue faster than most verticals because the targeting audience (local homeowners) is relatively narrow. After 30 days with the same creative, CTR typically drops 40–60%. Top performers test 25–35 new creative concepts per month.
Should solar ads focus on savings or environmental messaging?
Lead with savings. Financial messaging outperforms green messaging by 20–40% on Facebook. However, for millennial audiences, sustainability messaging generates 3.2× higher response rates than cost-only messaging. The best strategy is to test all three angles — savings, independence, and environmental — then scale winners by demographic segment.
What is a good close rate for solar leads from ads?
The industry-wide close rate is 8–12%, with top performers achieving 15%+. Purchased or shared leads convert at just 5–8%, while referral leads close near 30%. Speed-to-lead is the biggest differentiator — responding within 5 minutes dramatically improves conversion rates.
Sources
baadigi.com/tools/benchmarks/solar
surgepv.com/blog/facebook-ads-solar-companies
surgepv.com/blog/solar-ppc-campaigns
uprisedigital.com.au/blog/meta-ads-for-solar-companies
wifitalents.com/marketing-in-the-solar-industry-statistics
dalyadvertising.com/blog/solar-marketing
gitnux.org/marketing-in-the-solar-industry-statistics
leadgen-economy.com/blog/google-vs-facebook-solar-leads-comparison


