Table of contents
Most A/B tests lose. The 2026 experimentation data below benchmarks realistic win rates, CTR/CVR/CPL ranges by industry, and testing maturity, so a CRO program is planned against what actually happens in 193,000-plus real tests instead of a highlight reel of case studies.
Key Takeaways
- The most-tested page element wins about 10% of the time across 3,500 CTA-copy tests.
- Click-through rate is the highest-volume test metric, at roughly 8,000 tests, also near a 10% win rate.
- Search bar tests return the highest win rate, around 12%, despite being rarely run.
- VWO's 2026 dataset spans 193,000 experiments across 38,000 websites and 17 industries.
- 54% of companies now sit at "strategic" or "transformative" testing maturity, up from 35% in 2021.
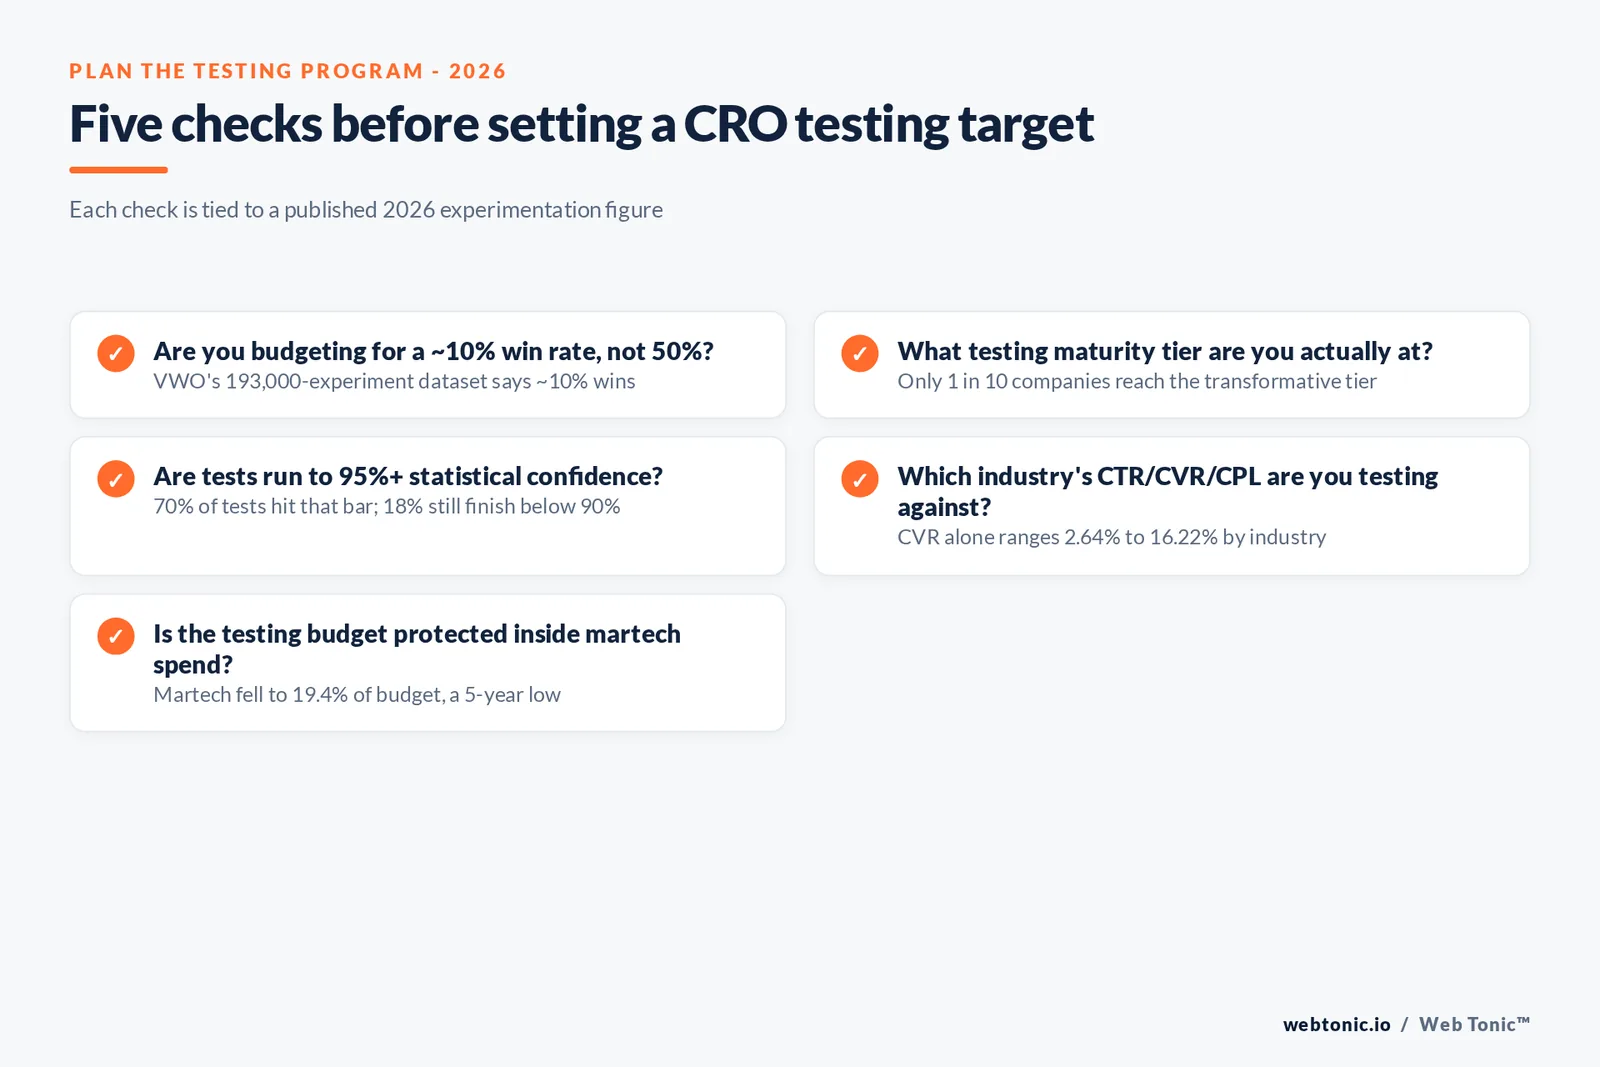
- Only 1 in 10 companies reach the top, "transformative" testing tier.
- A/B tests are 67.6% of all experiments run; multivariate testing is under 1%.
- 70% of experiments hit the 95% statistical confidence standard; 49% reach 99%+.
- Average Google Ads CTR is 6.64% across industries in 2026.
- Average Google Ads CVR is 8.18%, ranging 2.64% to 16.22% by industry.
- Average cost per lead is $66.69, ranging $26.84 to $131.63 by industry.
- Optimizely reported concluded experiments up 38.0% year over year in 2026.
- Experiment win rates reached 26.4% on Optimizely's platform in the same period.
- Retail & Ecommerce and Technology/SaaS run the most tests, at 27% and 23% of practitioners.
- 50% of marketers rank CRO as their second-most-used optimization tactic.
The win rate a testing roadmap should actually plan around
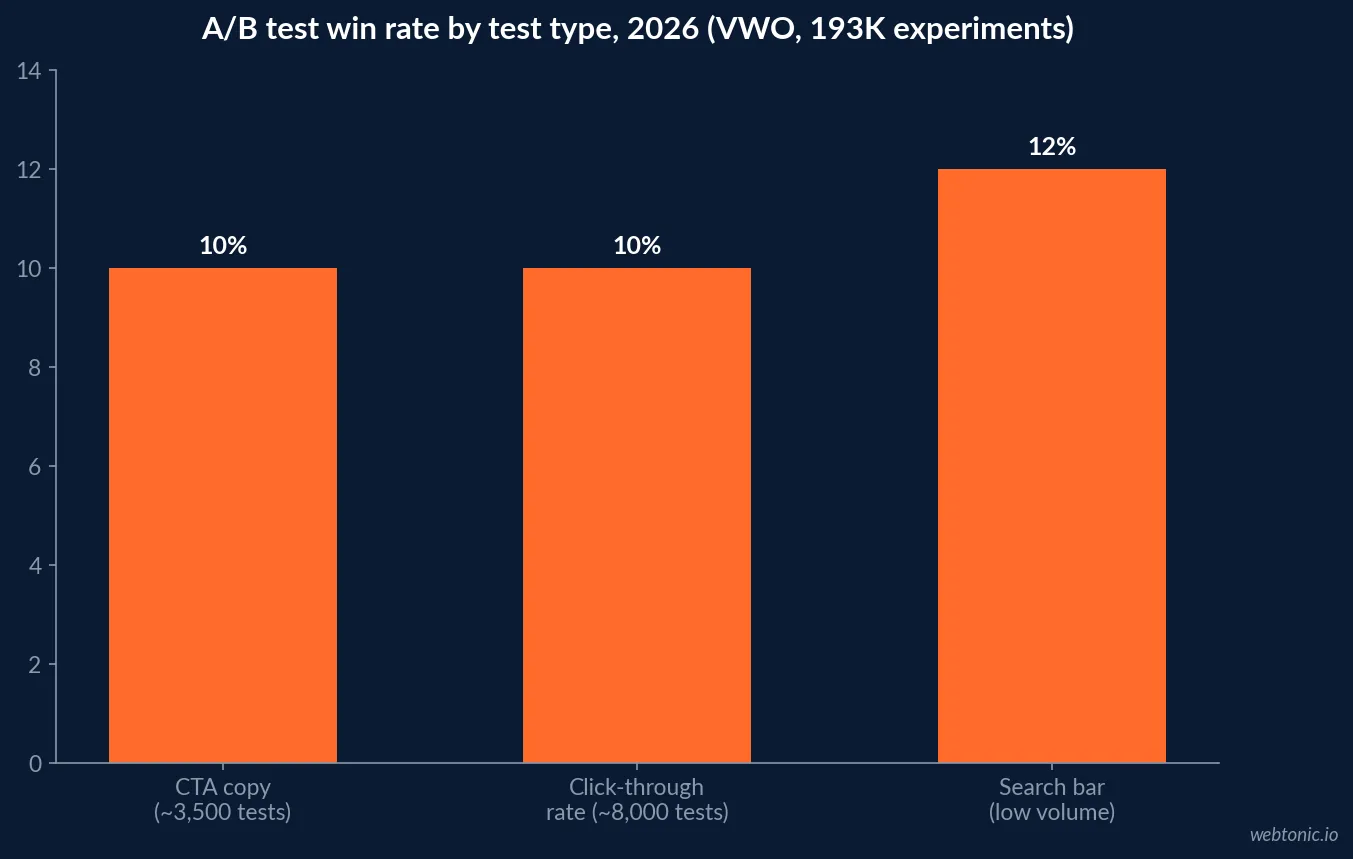
VWO's 2026 Industry Analysis, covering 193,000 experiments and 270,000 variations across 38,000 websites in 17 industries, found that CTA copy - the most-tested tactical change, run roughly 3,500 times - wins about 10% of the time. Click-through rate, the highest-volume metric tested at roughly 8,000 experiments, delivers a similar ~10% win rate. The standout is search bar testing: rarely run, but returning the highest win rate in the dataset at roughly 12%.
That 10% figure is the number worth sharing with anyone budgeting a testing program on the assumption that most experiments will move the metric. On VWO's data, roughly 9 in 10 will not, and that is normal, not a sign the program is broken.
| Test type (VWO 2026 dataset) | Volume tested | Win rate | Read |
|---|---|---|---|
| CTA copy | ~3,500 tests | ~10% | Most-tested tactic; reliable roadmap staple |
| Click-through rate (as primary metric) | ~8,000 tests | ~10% | Highest test volume overall |
| Search bar changes | Low volume | ~12% | Highest win rate; under-tested opportunity |
Testing maturity: most programs plateau before the top tier
Convert's 2026 A/B Testing Statistics report, citing Speero's Experimentation Maturity Program, found 54% of companies now sit at "strategic" or "transformative" maturity levels, up from 35% in 2021. The progress is real, but concentrated in the middle: only 1 in 10 companies reach the transformative tier, where executive sponsorship, cross-team collaboration and shared learnings are actually in place. Among beginner-tier companies, 33% have been testing a year or less and a striking 67% don't even know how long they've been running tests - a sign the program was never formally tracked in the first place.
Practitioner concentration follows the same maturity pattern: Retail & Ecommerce accounts for 27% of experimentation practitioners surveyed by Speero, Technology/SaaS for 23%, and Finance & Insurance for 13% - the industries most exposed to metrics like AOV, LTV and churn are also the ones that formalised testing earliest.
| Testing maturity tier | 2021 share | 2025 share | Change |
|---|---|---|---|
| Beginner / aspiring | 27% | 13% | Down 14pp |
| Progressive (middle) | 38% | 33% | Down 5pp |
| Strategic / transformative | 35% | 54% | Up 19pp |
| Transformative only | ~1 in 10 (est.) | ~1 in 10 | Still the hardest tier to reach |
What a mature program actually runs
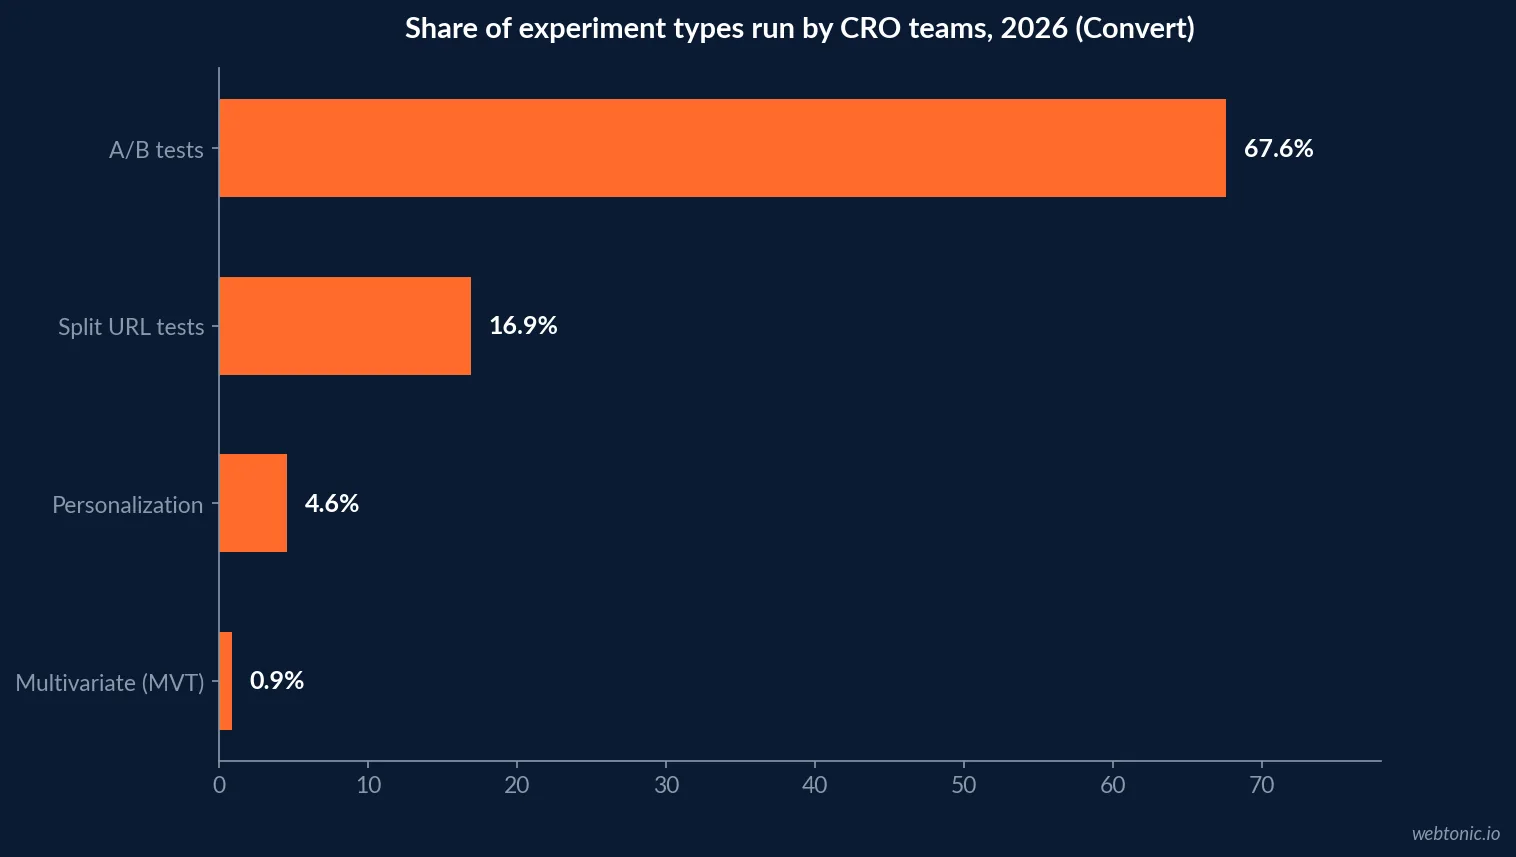
Convert's own 2026 platform data shows the shape of a working testing program: A/B tests account for 67.6% of all experiments, split URL tests 16.9%, personalization 4.6%, and multivariate testing under 1% - most teams do not have the traffic to run true MVT well. Statistical discipline is stronger than the "move fast and eyeball it" stereotype suggests: 70% of experiments reach the industry-standard 95% confidence threshold, and 49% push to 99%+. The most active accounts on Convert's platform run over 1,000 experiments a year.
Not every program clears the bar. Roughly 18% of tests still conclude below 90% confidence - the segment most likely to be called a "winner" internally on a result that would not survive a rerun.
The CTR, CVR and CPL numbers a test result gets measured against
A test only means something against a baseline, and WordStream's 2026 Google Ads Benchmarks, from over 13,000 US campaigns, supplies the industry floor most CRO programs are testing against on the paid side: average CTR of 6.64%, average CVR of 8.18%, and average CPL of $66.69. Each metric swings hard by industry - CTR from 5.56% (Automotive Repair) to 12.75% (Arts & Entertainment), CPL from $26.84 to $131.63.
| Metric (2026, all industries) | Average | Low end | High end |
|---|---|---|---|
| Click-through rate | 6.64% | 5.56% (Automotive Repair) | 12.75% (Arts & Entertainment) |
| Conversion rate | 8.18% | 2.64% (Finance & Insurance) | 16.22% (Animals & Pets) |
| Cost per lead | $66.69 | $26.84 (Arts & Entertainment) | $131.63 (Attorneys & Legal) |
| Cost per click | $5.42 | $1.63 (Arts & Entertainment) | $9.87 (Attorneys & Legal) |
Momentum on the vendor side confirms the pattern
Vendor-reported figures line up with the independent benchmark data. Optimizely's 2026 results announcement reported concluded experiments up 38.0% year over year and experiment win rates improving to 26.4% - both signs that programs are running more tests and getting somewhat better at picking which ideas to test, not that winning has become the default outcome.
Where CRO fits against everything else marketers are optimizing
CRO is not a niche discipline inside most marketing organisations any more. HubSpot's 2026 Marketing Statistics report found conversion rate optimization is the second-most-used optimization technique among marketers at 50%, one point behind audience segmentation refinement, and 56% of marketers say it is now easier to improve conversion rates than it was a decade ago - largely because testing tools have gotten cheaper and easier to run.
What a testing program should track once it is running
A win rate is only meaningful if the measurement behind it is trusted. Ruler Analytics' 2026 research found 90.2% of marketers use GA4 as their primary tool and 87.5% trust the data in it, but only 63.5% base most decisions on what it shows - a gap worth closing before crediting a test result to the right variant rather than a reporting quirk. On the landing page side, Unbounce's Conversion Benchmark Report, built from 57 million conversions across 41,000 pages, remains the reference baseline most CRO teams test their landing page variants against, with a cross-industry median of 6.6%.
Budget context matters here too: Gartner's 2026 CMO Spend Survey, reported by Chief Marketer, found martech's share of the marketing budget fell to a five-year low of 19.4% - which is exactly the budget line a testing platform usually sits inside. A shrinking martech allocation is one more reason to prove out win rate and confidence discipline before asking for a bigger testing budget.
Which industries are actually testing at this volume
Testing volume is not evenly distributed across business models. Convert's data on Speero's practitioner base found Retail & Ecommerce represents 27% of experimentation practitioners, Technology/SaaS 23%, and Finance & Insurance 13% - together well over half of everyone actively running structured tests. These are the businesses whose unit economics (AOV, LTV, MRR, churn) make a 10% win rate worth chasing at volume; a business without a metric that sensitive to small conversion lifts will struggle to justify the same testing cadence.
| Industry (Speero 2025 practitioner data) | Share of testing practitioners |
|---|---|
| Retail & Ecommerce | 27% |
| Technology / SaaS | 23% |
| Finance & Insurance | 13% |
| All other industries combined | 37% |
Test volume needed to make a 10% win rate meaningful
The arithmetic behind a realistic testing cadence is simple once the win rate is set at 10% instead of an optimistic 30-50%. A program running 10 tests a quarter should expect roughly one win; a program wanting four or five wins a quarter, the volume needed to keep a roadmap credible to stakeholders, needs to be running 40 to 50 tests in that window. Convert's data point that its most active accounts run over 1,000 experiments a year - roughly 250 a quarter - is what that level of commitment actually looks like at the top end.
Most teams under-budget for this because they plan the roadmap around expected wins rather than expected volume, then treat a quiet quarter as a program failure when it is closer to statistical normal.
| Target wins per quarter | Tests needed at a 10% win rate | Comparable to |
|---|---|---|
| 1 win | ~10 tests | A new or part-time testing program |
| 2-3 wins | 20-30 tests | A dedicated CRO hire running a steady cadence |
| 4-5 wins | 40-50 tests | A small, focused CRO team |
| 10+ wins | 100+ tests | Convert's most active platform accounts run 1,000+/year |
Setting a testing cadence you can actually defend
Use the ~10% win rate as your default planning assumption, not the exception. Budget enough tests per quarter that a 1-in-10 win rate still produces a meaningful number of wins, and hold every test to the 95% confidence bar rather than calling early winners under pressure to show progress. Map your program's maturity honestly against Speero's tiers - most teams over-estimate where they sit.
If the testing program sits downstream of paid traffic, our Google Ads strategy guide and Facebook Ads budgeting breakdown cover the acquisition side this data feeds into. Our performance creative team can help build the test backlog itself - get in touch to scope a program against your own baseline.
Frequently Asked Questions
What is a realistic A/B test win rate to plan around?
Roughly 1 in 10. VWO's 2026 industry analysis, drawn from 193,000 experiments across 38,000 websites, found the most-tested change - CTA copy, run about 3,500 times - won around 10% of the time, and click-through rate as a metric, the highest-volume test type at roughly 8,000 tests, also won near 10%. Search bar tests were rarer but won closer to 12%. Any testing roadmap assuming most tests will win is set up to disappoint stakeholders.
How much of a testing program's traffic goes to CRO versus other channels?
Very little for most companies, and testing maturity data explains why. Convert's 2026 analysis of Speero's Experimentation Maturity Program found 54% of companies now sit at 'strategic' or 'transformative' testing maturity, up from 35% in 2021, but only 1 in 10 companies reach the top, transformative tier where executive sponsorship and cross-team collaboration are actually in place.
What conversion rate should CPL and CTR benchmarks be measured against?
Against your specific industry, not a blended average. WordStream's 2026 Google Ads data shows CTR ranging from 5.56% (Automotive Repair) to 12.75% (Arts & Entertainment), CPL from $26.84 (Arts & Entertainment) to $131.63 (Attorneys & Legal Services), and CVR from 2.64% to 16.22% depending on industry. A CRO program should test toward its own industry's band, then benchmark improvement against its own historical baseline, not a cross-industry number.
How statistically rigorous do most CRO teams actually run their tests?
More than the stereotype suggests, at least among teams using dedicated tools. Convert's 2026 data on its own platform found 70% of experiments reached the industry-standard 95% statistical confidence threshold, with 49% reaching 99% or higher. About 18% of tests still finished below 90% confidence, which is the group most likely to produce a false-positive 'winner.'
Which page elements are worth testing first if the program is new?
Start where volume and win rate both justify the effort. VWO's data shows CTA copy is tested most often (~3,500 times) at a solid ~10% win rate - a reliable staple - while search bar tests, though rarer, return the highest win rate at roughly 12%, flagging it as an under-tested opportunity. New programs typically get the fastest credibility by starting with CTA copy, then moving budget toward the higher-yield, lower-volume opportunities once the program has proven itself.
Sources
VWO - 2024-2026 Experimentation Benchmark / Industry Analysis
Convert - A/B Testing & CRO Stats Every Optimizer Should Know, 2026
WordStream - 2026 Google Ads Benchmarks
PR Newswire - Optimizely reports 42% QoQ ARR growth, experimentation metrics
HubSpot - 2026 Marketing Statistics, Trends & Data
Ruler Analytics - 150+ Marketing Attribution Statistics
Unbounce - Conversion Benchmark Report
Chief Marketer - Gartner 2026 CMO Spend Survey coverage