Table of contents

A growth marketer budgeting against "the average conversion rate" is budgeting against a number that does not exist for their business. The 2026 data below breaks conversion rate down by channel and industry so a budget target is defensible instead of borrowed.
Key Takeaways
- The median landing page converts at 6.6%, across 41,000 pages and 57 million conversions.
- Google Ads conversion rate averages 8.18% across all industries in 2026.
- By industry, Google Ads CVR ranges from 2.64% to 16.22% - a 6x spread.
- Conversion rate rose in 87% of industries year over year in the 2026 data.
- Average cost per lead is $66.69, and fell for the first time in five years.
- The average e-commerce conversion rate sits under 2% industry-wide.
- Skincare converts at 2.7% online; luxury apparel at just 0.4%.
- Email marketing converts at 2.8% for B2C and 2.4% for B2B brands.
- CRO is the second-most-used optimization technique among marketers, at 50%.
- 56% of marketers say improving conversion rate is easier than a decade ago.
- Marketing budgets sit at 9.0% of company revenue in 2026, the lowest in years.
- Marketing spend grew just 1.7% year over year, the smallest increase since 2021.
- Almost 60% of growth spending targets existing markets, not new ones.
- 90.2% of marketers use GA4 as their primary measurement tool.
- Consented users convert 2 to 5 times more often than unconsented users, per Google.
Why the headline average is the wrong budgeting anchor
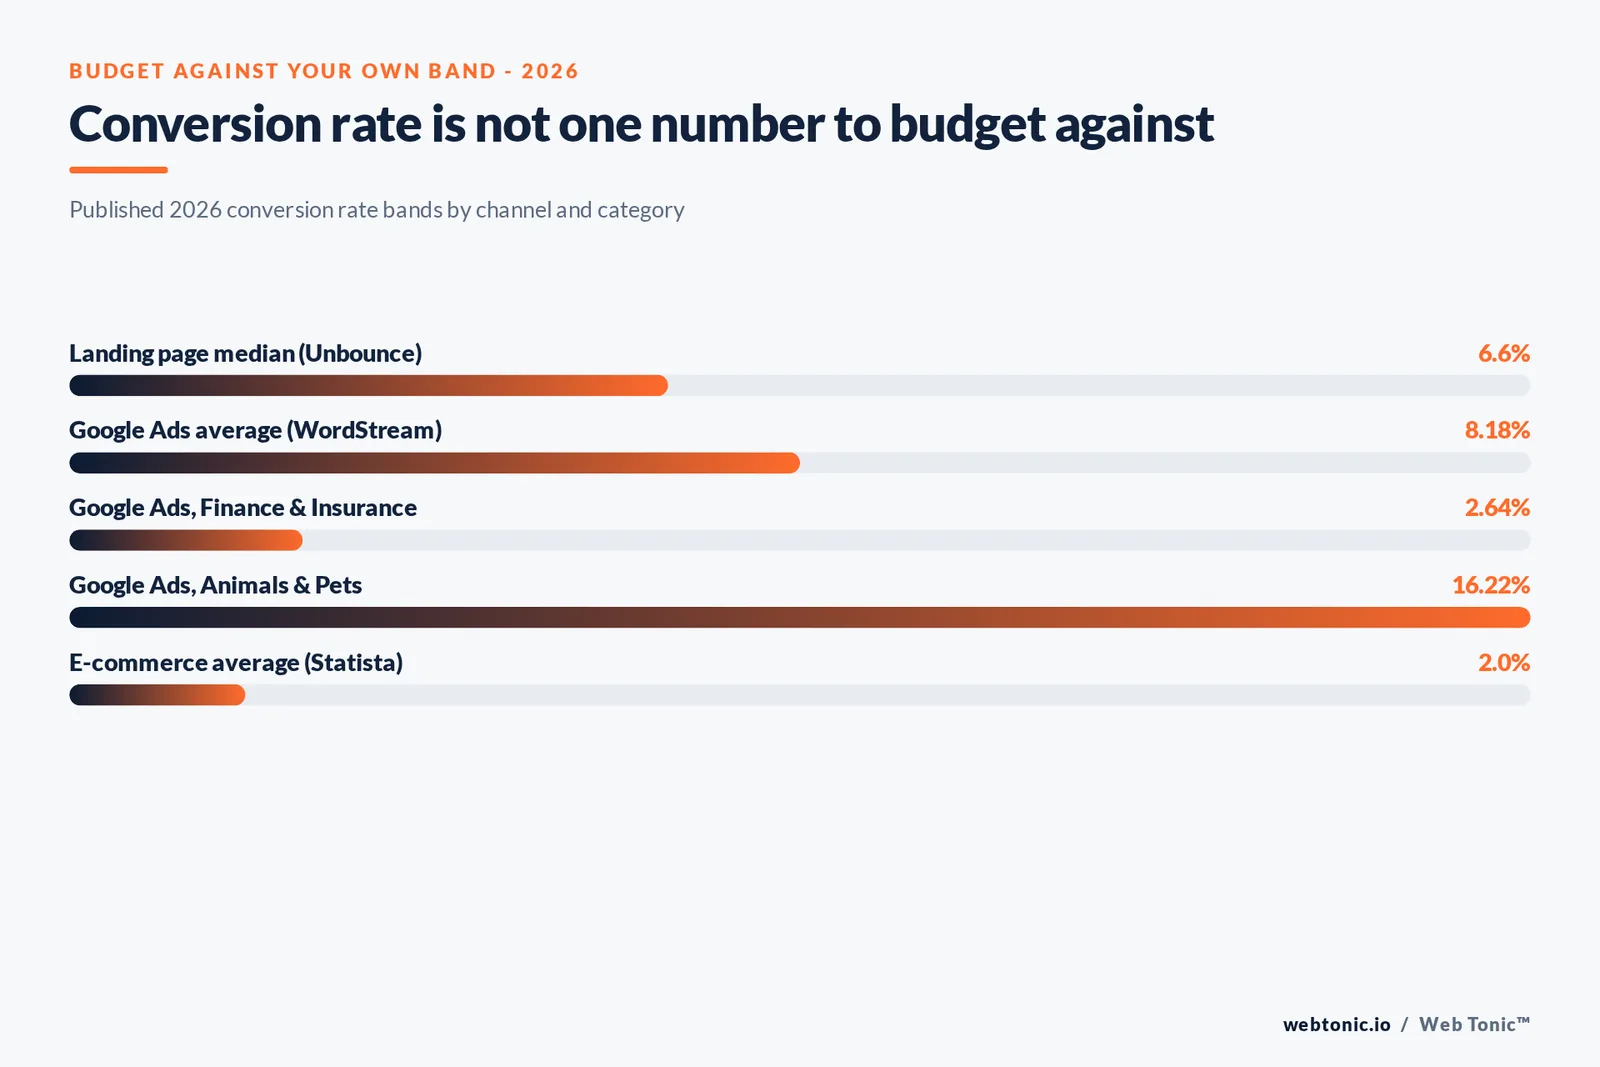
Unbounce's Conversion Benchmark Report, built from 464 million visits across 41,000 landing pages and 57 million conversion actions, reports a median landing page conversion rate of 6.6% across all industries. That number is genuinely useful as a sanity check, but it is a median across pages selling everything from a $10 newsletter signup to a $10,000 service, and Unbounce itself flags that a "good" rate depends entirely on the page's goal and industry.
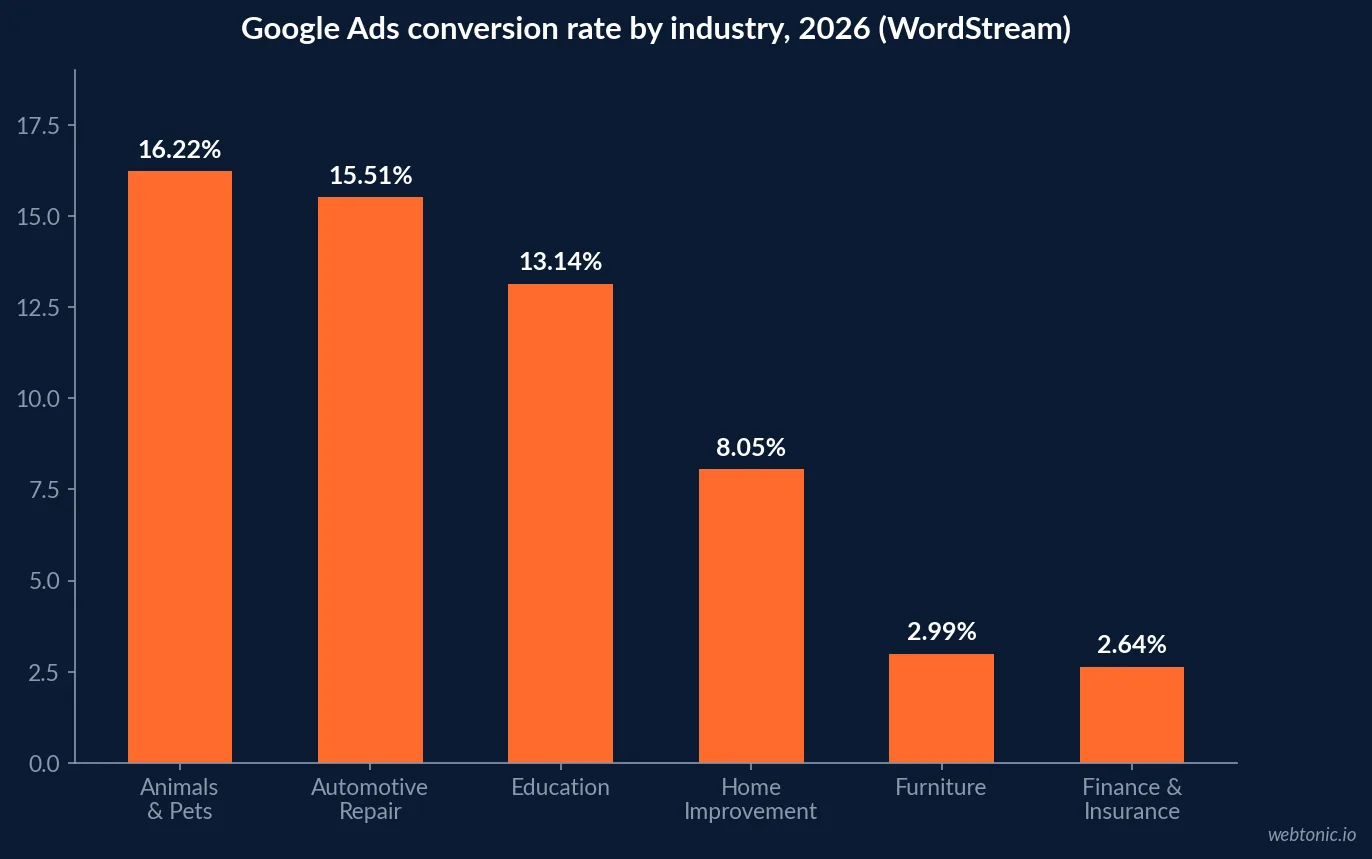
Google Ads data tells the same story with a wider spread. WordStream's 2026 benchmarks, analysing over 13,000 US-based search campaigns running April 2025 through March 2026, put the cross-industry average conversion rate at 8.18% - but the range beneath that average spans from 2.64% (Finance & Insurance) to 16.22% (Animals & Pets). Budgeting against the average instead of your industry's band means either under-forecasting revenue or setting a target your channel cannot realistically hit.
| Industry (Google Ads, 2026) | Average CVR | Average CPL | Where it lands |
|---|---|---|---|
| Animals & Pets | 16.22% | $31.50 | Highest CVR band |
| Automotive - Repair, Service & Parts | 15.51% | $29.96 | High CVR, low CPL |
| Education & Instruction | 13.14% | $77.48 | High CVR, mid CPL |
| Home & Home Improvement | 8.05% | $90.92 | At the cross-industry average |
| Furniture | 2.99% | $106.70 | Low CVR, high CPL |
| Finance & Insurance | 2.64% | $74.44 | Lowest CVR band |
What actually moved between 2025 and 2026
The trend line matters as much as the snapshot for a budget conversation. WordStream reports conversion rate increased in 87% of industries year over year, and for the first time in five years, average cost per lead across Google and Microsoft Ads fell to $66.69. That combination - rates up, cost down - is the strongest argument in years for holding or increasing a paid search budget rather than reflexively cutting it when leadership asks for savings.
Not every industry shared in that improvement. Career & Employment conversion rate dropped 29.42%, the steepest decline measured, while Beauty & Personal Care rose 32.34%, the largest gain. A flat budget applied evenly across industries in 2026 would have badly mispriced both.
| Metric (2026 vs 2025) | Direction | Figure | Budget implication |
|---|---|---|---|
| Industries with rising conversion rate | Up | 87% of industries | Broad tailwind for paid search |
| Cross-industry cost per lead | Down | $66.69, first fall in 5 years | Room to hold spend, not just cut it |
| Career & Employment CVR | Down | -29.42% | Re-forecast this vertical separately |
| Beauty & Personal Care CVR | Up | +32.34% | Strongest case for reallocating budget here |
| Real Estate CPC | Up | +27.27% | Rising cost even where CVR is flat |
E-commerce sits well below the landing-page median
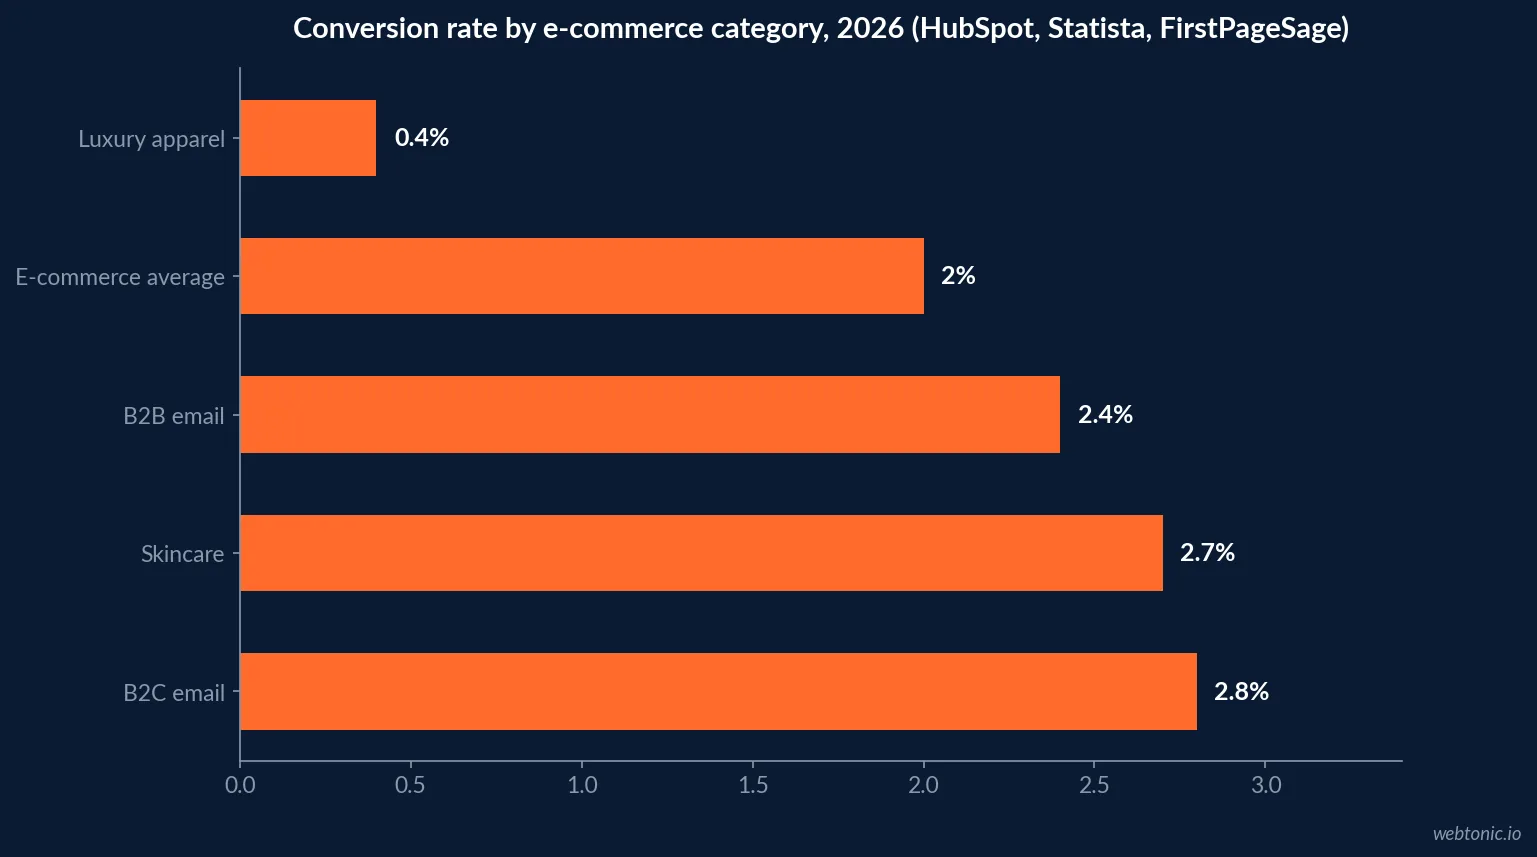
Away from lead generation, the number to plan against is much lower. HubSpot's 2026 Marketing Statistics roundup, citing Statista, puts the average conversion rate across all e-commerce sites at under 2%, with wide variation inside that: skincare converts at 2.7% while luxury apparel converts at just 0.4%. Email holds up better than most acquisition channels for retail specifically, converting at 2.8% for B2C and 2.4% for B2B brands, per FirstPageSage data cited in the same report.
A growth marketer budgeting a new ecommerce line against the 6.6% landing-page median, rather than the sub-2% ecommerce reality, will overstate expected revenue by more than 3x before a single dollar is spent.
The budget envelope this all has to fit inside
Conversion rate targets do not get set in a vacuum; they compete for a marketing budget that is itself under pressure. The CMO Survey's 2026 Highlights and Insights Report found marketing budgets at 9.0% of company revenue, the lowest share in several years, with overall spend growing just 1.7% - the smallest increase since 2021. Under that constraint, almost 60% of growth spending is already going toward selling more to existing customers rather than acquiring new ones.
That inward shift is itself a conversion-rate story: when the acquisition budget is flat, improving the conversion rate on the traffic you already have is the only lever left that does not require asking for more money.
| Budget context (2026) | Figure | Source | What it means for CVR planning |
|---|---|---|---|
| Marketing budget, % of company revenue | 9.0% | The CMO Survey | Least room to fund new acquisition tests |
| Marketing budget growth, YoY | 1.7% | The CMO Survey | CRO work has to fund itself from existing traffic |
| Growth spend directed at existing markets | ~60% | The CMO Survey | Retention-side CVR work is the priority |
| Marketers who find CRO easier than 10 years ago | 56% | HubSpot 2026 | Tooling has lowered the cost of testing |
| Marketers using CRO as their #2 tactic | 50% | HubSpot 2026 | It is already a mainstream budget line |
The martech budget squeeze behind the pressure to convert better
Part of why conversion rate has become the lever marketers reach for is that the martech budget itself is shrinking as a share of the pie. Gartner's 2026 CMO Spend Survey, covering 401 CMOs and reported by Chief Marketer, found marketing technology spend fell to a five-year low of 19.4% of the marketing budget, down from 26.6% in 2021, while overall marketing budget sits at 7.8% of company revenue - and organisations with fully optimised AI programmes average 11%. Google's own guidance to marketers planning 2026 budgets makes the practical case directly: Think with Google reports that UK advertisers who stay budget agile could gain an average of 20% more conversions in Search from the same spend, yet only 17% of companies say their budgets are actually flexible enough to do it.
Both figures point the same direction: with less new martech budget to work with, the return has to come from converting the traffic already being paid for, which is exactly the conversion rate work this page is meant to help you plan.
| Budget flexibility signal (2026) | Figure | Source |
|---|---|---|
| Marketing technology share of budget | 19.4%, down from 26.6% in 2021 | Gartner via Chief Marketer |
| Marketing budget, all respondents | 7.8% of company revenue | Gartner via Chief Marketer |
| Marketing budget, AI-optimised organisations | 11% of company revenue | Gartner via Chief Marketer |
| Extra conversions available to budget-agile advertisers | ~20% more, same spend | Think with Google |
| Companies with genuinely flexible budgets | 17% | Think with Google |
What most marketers measure the target against
Whatever target you set has to be tracked somewhere, and Ruler Analytics' research shows the near-universal default: 90.2% of respondents use GA4 as their go-to marketing tool, and 87.5% say they trust the data it shows them. The catch is that GA4 defaults to last-click, and 63.5% of respondents base the majority of their decisions on that view - which means most conversion-rate budgeting in practice is being done against a partial picture of the journey, not the full one.
Google's own documentation adds a consent-side wrinkle worth budgeting time for: under Consent Mode, consented users are typically 2 to 5 times more likely to convert than unconsented users in the reported data, which is a measurement artifact as much as a behavioural one. A rising or falling conversion rate can partly reflect a shifting consent rate rather than a real change in buyer behaviour.
Traffic source is the other variable a single average hides
Industry is not the only axis conversion rate moves on. WordStream's PPC benchmarks also show channel-level variance that a growth marketer should fold into the same budget model: within search alone, brand versus non-brand keywords convert at meaningfully different rates, and the accounts WordStream analysed span a wide range of match types and bidding strategies. The practical rule holds across every cut of the data: a target set from one channel's number should never be applied to a different channel's budget line without adjustment.
This is also why a marketer moving budget between channels mid-quarter needs a conversion rate model for each destination, not one shared number - the WordStream, Unbounce and HubSpot figures above are three different channels' realities, not three versions of the same fact.
| Channel type | Typical 2026 CVR reference point | Source | Budgeting note |
|---|---|---|---|
| Paid search, cross-industry | 8.18% | WordStream | Wide industry variance beneath this average |
| Landing page, cross-industry | 6.6% median | Unbounce | Goal-dependent; a lead form differs from a sale |
| E-commerce site-wide | Under 2% | Statista via HubSpot | Do not benchmark ecommerce against lead-gen pages |
| Email, B2C | 2.8% | FirstPageSage via HubSpot | Owned-audience channel; steadiest to plan against |
| Email, B2B | 2.4% | FirstPageSage via HubSpot | Slightly lower than B2C but still owned-audience |
Setting a defensible number for next quarter's plan
Start from your own channel and industry band, not the cross-channel average. Use WordStream's industry table if the budget is paid search, Unbounce's median if it is a lead-gen landing page, and the sub-2% ecommerce figure if it is a product page - then apply the CMO Survey's spending context to decide whether that budget should be growing new traffic or converting existing traffic harder.
If paid search is the channel carrying most of that budget, our guide to building a Google Ads strategy for a better ROI and our 2026 pricing breakdown are useful next reads. Our data and analytics practice can help set the target against your own numbers rather than an industry median - talk to us before you lock the plan.
Frequently Asked Questions
What conversion rate should I actually budget against?
Not the single average you'll find quoted everywhere - it hides too much. Unbounce's benchmark, built from 57 million conversions across 41,000 landing pages, puts the median landing page at 6.6%, but WordStream's 2026 Google Ads data shows paid search conversion rates ranging from 2.64% (Finance and Insurance) to 16.22% (Animals and Pets) depending on industry. Budget against your own industry's band, not the headline number.
Why does Google Ads conversion rate vary so much by industry?
Purchase intent and price point differ enormously between what someone searches for. WordStream's 2026 benchmarks, built from over 13,000 US campaigns, show Animals & Pets and Automotive Repair converting above 15% because the click already carries strong intent and a low-friction action, while Finance & Insurance (2.64%) and Furniture (2.99%) sit lowest because the purchase decision is slower and higher stakes. Budgeting on the cross-industry average of 8.18% will overstate what a finance campaign can do and understate what a pet-care campaign should be delivering.
Is conversion rate optimization worth budgeting for on its own line item?
HubSpot's 2026 State of Marketing data suggests most marketers already think so: conversion rate optimization is the second-most-used optimization technique, one point behind audience segmentation, and 56% of marketers say it is now easier to improve conversion rates than it was ten years ago. Given that e-commerce conversion rates average under 2% industry-wide per Statista, even small CRO gains compound meaningfully against a fixed traffic budget.
How much of my marketing budget should go toward conversion work versus new traffic?
There is no universal split, but The CMO Survey's 2026 report is a useful anchor: marketing budgets overall sit at 9.0% of company revenue, and companies are already directing almost 60% of growth spending toward penetrating existing markets rather than acquiring new ones. That inward shift argues for weighting new budget toward conversion and retention work over pure traffic acquisition in the current climate, not the reverse.
Which channel gives the most reliable conversion rate to plan around?
Owned and high-intent channels are the steadiest. Ruler Analytics' research shows GA4 is the default measurement tool for 90.2% of marketers and email consistently benchmarks among the highest-converting channels across most 2026 reports, because the audience already opted in. Paid social is the most volatile to plan against, since it depends heavily on creative and audience match rather than search intent.
Sources
Unbounce - Average landing page conversion rates (Conversion Benchmark Report)
WordStream - 2026 Google Ads Benchmarks
HubSpot - 2026 Marketing Statistics, Trends & Data
The CMO Survey - Highlights and Insights Report 2026
Ruler Analytics - 150+ Marketing Attribution Statistics
Google Ads Help - About consent mode modeling
Chief Marketer - Gartner 2026 CMO Spend Survey coverage
Think with Google - How to build a demand-driven marketing budget in 2026